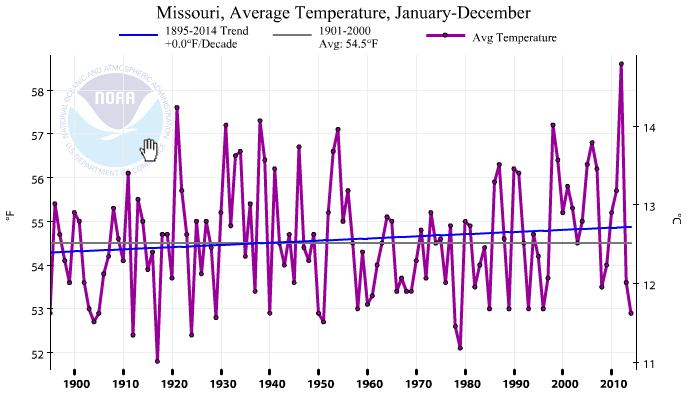
Testing TOBS by station removal is a little tricky because morning stations tend to be in warmer parts of the country, so diverging regional trends affect the result. But one state had a 50/50 mix of morning/afternoon stations in July 1936.
There are 26 HCN stations in Missouri and 13 of them took readings either at morning or night during July, 1936. These 13 stations would tend to be biased cold in the 1930’s according to TOBS theory.
I compared the cold stations vs. all stations, and there is essentially no difference. TOBS is 99% BS.
Based largely on their phony TOBS adjustment, NCDC turns a cooling trend in Missouri into a warming trend.
Here is the list of morning/night stations from July, 1936
APPLETON CITY       	MO	USC00230204
CLINTON             	MO	USC00231711
FARMINGTON          	MO	USC00232809
JEFFERSON CITY WTP  	MO	USC00234271
LAMAR 2W            	MO	USC00234705
LEBANON 2W          	MO	USC00234825
LEES SUMMIT REED WR 	MO	USC00234850
LEXINGTON 3E        	MO	USC00234904
MEXICO              	MO	USC00235541
MOBERLY             	MO	USC00235671
MTN GROVE 2 N       	MO	USC00235834
SPICKARD 7 W        	MO	USC00237963
UNIONVILLE          	MO	USC00238523


I used to watch a number of stations in the Midwest as my canaries in the coal mine. I checked out their locations to be sure there was no UHI contamination, and not one of them showed any warming over the past century, in fact most showed cooling.
Something strikes me about TOBS and about the idea that modern thermometers measure warmer than traditional mercury thermometers.
In the case of TOBS, instead of seeing some kind of gradual change (which is what we see in any of the graphs that you or Paul Homewood, or Ken’s Kingdom in Australia show, when you compare original data with homogenised results), we should see a one-off step change when one kind of observation technique was replaced by another.
Similarly, when a traditional thermometer was replaced by a digital system, we should see a step change, but we do not see that.
Presumably in both cases, the change from one to the other is a known date.
THe effect of homogenisation is a curve as opposed to a one-off step change. Apart from all the evidence you have, shown, this ought to be an additional nail in the coffin of the adequacy of the homogenisation technique.
Steve,
why was this test of the theory obvious to you and not to Gavin and the rest.
No answer required.
They lower the old readings because of TOBS (Time of Observation) because “….Observation times have shifted from afternoon to morning at most stations since 1960…” – Zeke Hausfeather of the BEST data set writing @ Judith Curry’s Understanding Adjustments to Temperature Data.
Here is what the Meteorology: A Text-book on the Weather, the Causes of Its Changes, and Weather Forecasting By Willis Isbister Milham 1918 says about the reason why the older temperature readings were taken during the hotter part of the day.
On page 68 Milham says a thermometer in a Stevenson screen is correct to within a half degree. Two thermometers are used an Alcohol for Minimum and a Mercury for Maximum supplied with a manual in 1882 to the coop stations by the US Weather Bureau. Milham mentions the Six Min/Max thermometer and says the accuracy was not good so the US weather service used the two thermometers mentioned above.
He also states there are 180 to 200 ‘regular weather stations’ ordinarily in the larger cities that take reading twice daily and a continuous reading too. There were also 3600 to 4000 coop stations and 300 to 500 special stations that recorded other aspects of the weather.
Zeke Hausfeather goes on to say:
“….For example, MMTS sensors tend to read maximum daily temperatures about 0.5 C colder than LiG thermometers at the same location. There is a very obvious cooling bias in the record associated with the conversion of most co-op stations from LiG to MMTS in the 1980s…. “
Yet notrickszone reports
So with just those two wrong way adjustments they change the data by more than 1 °C and that does not get into dropping rural stations and smearing the data from airports for 1200 kilometers.