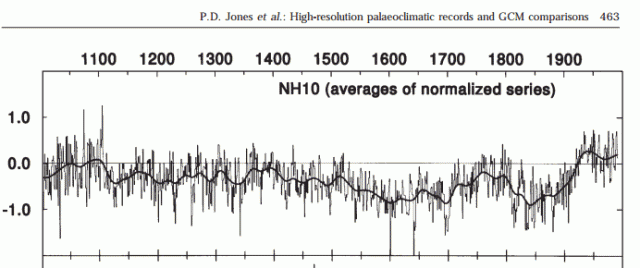
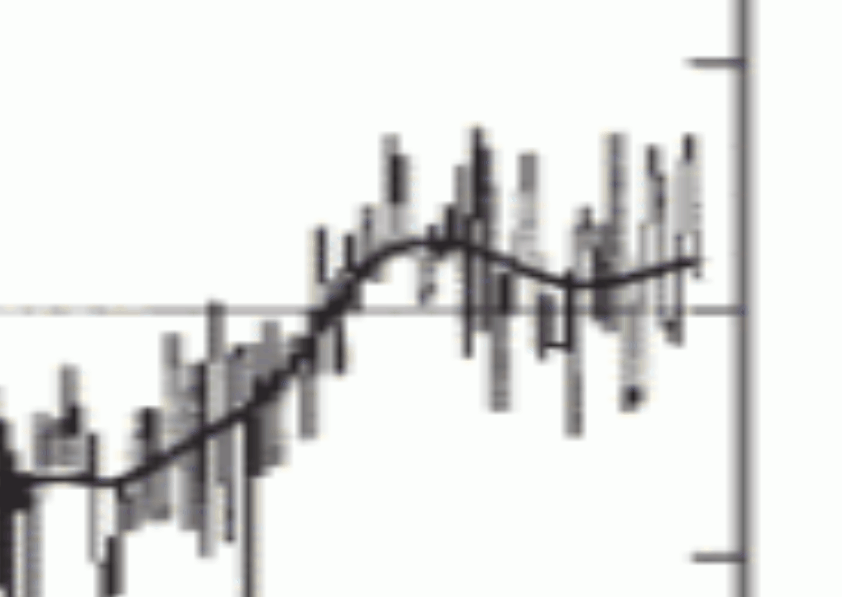
Jones 1998 showed that all Northern Hemisphere warming occurred before 1940, and recent temperatures were similar to the MWP.
The graph below shows just the recent portion.
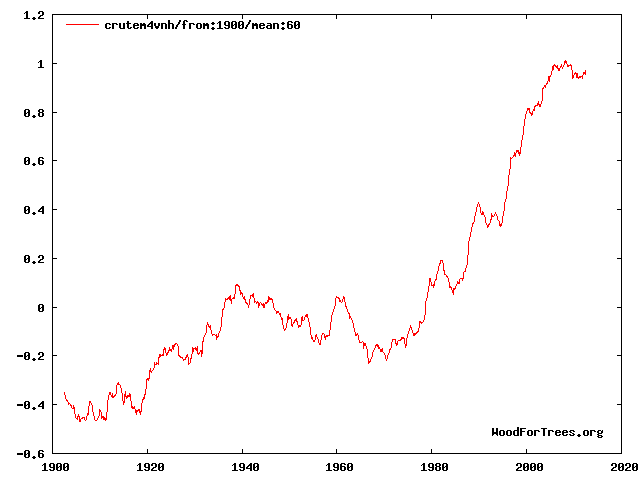
But Phil has changed all that, and now shows that essentially all warming occurred after 1970.
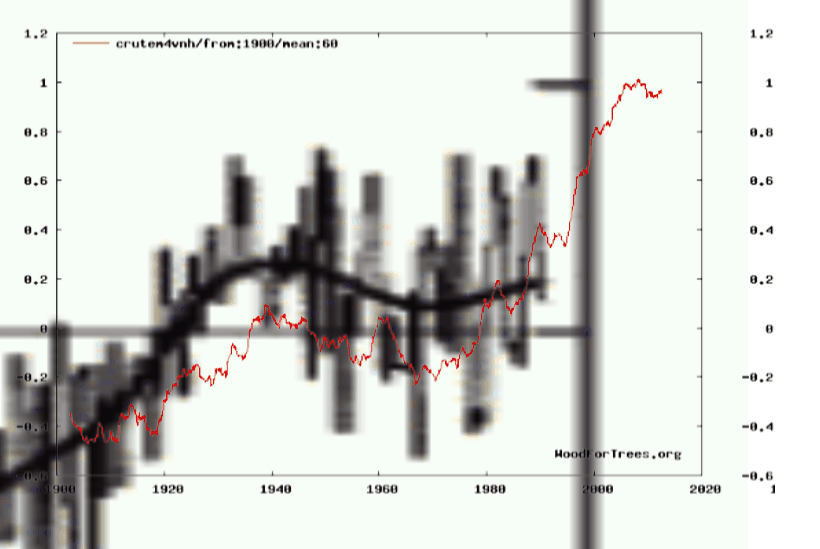
The next graph is an overlay showing the current CRUTEM (red) on top of 1998 Jones.
You can see how Phil removed the 1940’s blip, and created a hockey stick after 1970. Then he deleted all his E-mails related to this.
From: Tom Wigley <[email protected]>
To: Phil Jones <[email protected]>
Subject: 1940s
Date: Sun, 27 Sep 2009 23:25:38 -0600
Cc: Ben Santer <[email protected]>It would be good to remove at least part of the 1940s blip, but we are still left with “why the blip”.
Mike,
Can you delete any emails you may have had with Keith re AR4? Keith will do likewise… Can you also email Gene [Wahl] and get him to do the same? I don’t have his new email address. We will be getting Caspar [Ammann] to do likewise.
Cheers, Phil


Nicely put together. There is really no chance they did this by chance.
Hope says it’s all Big Oil talking points, and all the adjustments HAVE NOT BEEN MADE YET! ::lol:
Phil Jones talks about removing the decline to the late 1970s… (From EM Smith with his commentary after the quote….
“No satisfactory explanation for this cooling exists, and the cooling itself is perplexing because it is contrary to the trend expected from increasing atmospheric CO2 concentration. Changing Solar Activity and/or changes in explosive volcanic activity has been suggested as causes… but we suspect it may be an internal fluctuation possibly resulting from a change in North Atlantic deep water production rate.”
So, Jones said in 1985 that: “the cooling itself is perplexing” – but why not say so today? And why don’t we see a “perplexing” cooling after 1940 in the IPCC graphic today? And furthermore, back in the early 1980´ies Jones appears to accept data as is, at least to such an extent that here he is considering how nature has produced these “perplexing” cooling data – like a real scientist should.
I’m especially fond of that “internal fluctuations”…”from a change in North Atlantic deep water”. Gee, maybe the planet has cycles all on it’s own. Guess he’d not been “in church” long enough at that time and was still wondering about the status of the Apocrypha… (Of course now the ENSO cycles can explain the pause, but still they cannot explain the warming!)
This blatant and constant changing of the past, as well as the emails discussing it, was what turned me into a global warming skeptic in 2009. The winter of 2009/10 confirmed my suspicions about changes to the records and some seriously messed up behavior going on behind the scenes.
Five years later, even the adjusted data confirms the cooling trend,
Thank you. I was hoping you would get around to Mr. “why would I give you my data, you just want to find something wrong with it.”