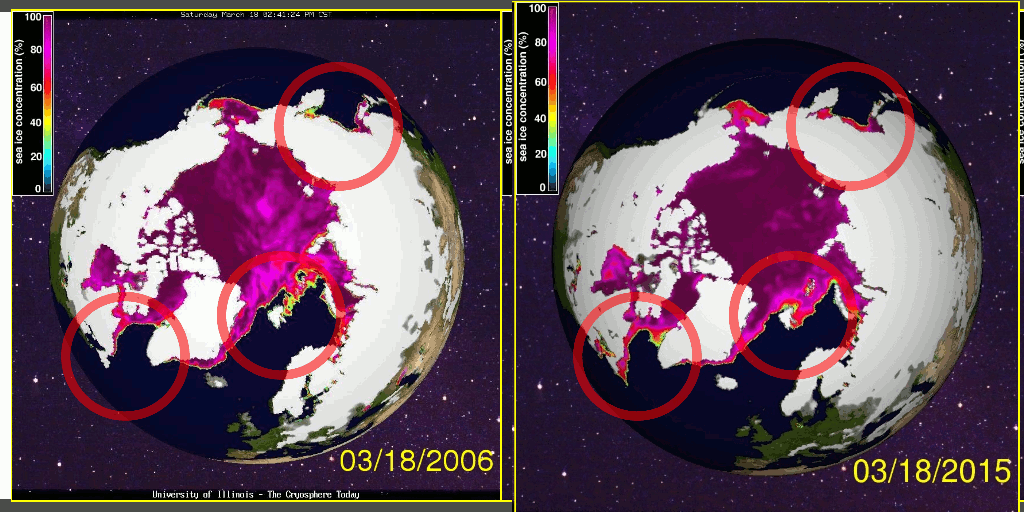
Maps from Cryosphere Today at the University of Illinois show that there is a lot more ice in the Arctic than there was on the same date in 2006.
The animation below flashes between March 18, 2006 and 2015. They changed the eye-altitude since 2006, but I aligned the land boundaries as closely as possible. There is a lot more ice around Svalbard this year, as well as Baffin Bay and Eastern Canada. The only ares with less ice than 2006 are the Bering Sea and a small area between Greenland and Iceland
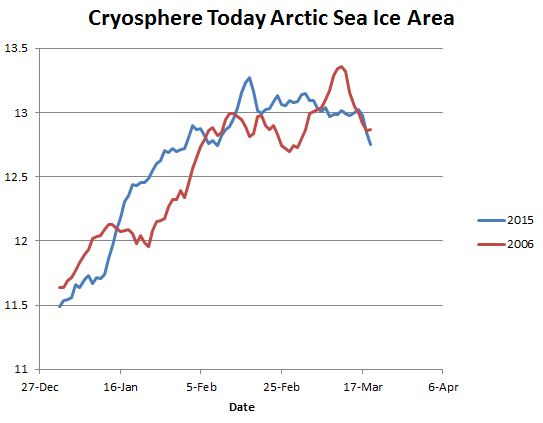
But if we look at reported ice area from Cryosphere today, they show less ice than 2006.
It is hard to win a debate with people who simply change the score any time they are losing.


OK Steve, I’m confused. Is this or is this not the earliest and lowest maximum? Different sources saying different things. Why? What source is one to believe and why? Help me out here. I have people asking if the claim is really BS or not.
DMI shows ice extent is higher than 2005, 2006, 2007. CT maps show that it is a lot higher than 2006. I don’t trust any of the propaganda from NSIDC. I call BS.
Try going back to March 2000 and March this year for a comparison. That’s a real eye opener.
Is that on DMI?
Who’s eyes were shut?
No one is saying that there was not more ice in the past.
But if we had this data going back a hundred years or more, there is ample evidence that we would find similar cycles as we have seen since the satellite record began.
“It is hard to win a debate with people who simply change the score any time they are losing.”
That’s the money quote.
It was probably also hard to win a debate with loyal citizens who believed Goebbels’ all-pervasive propaganda.
Today, the Reich has all media outlets singing in perfect harmony. It is hard to logically debate with closed-minded idiots who will simply parrot the messages from the Propaganda Ministry.
I always suspected CT was fiddling the NH ice data. This confirms it. They cant manipulate the SH ice because its one piece.
Not only is the extent greater, its much thicker ice too. They will probably remove this graphic soon, so guys… keep copies.
They own the data and there is no one who can stop these experts from changing it. We need another hacker to help get the truth out.
You cannot change data. Alterations to data are called artifacts, or my preferred term, fraud.
Where will be the polar vortex in the April Fool’s Day?
http://www.cpc.ncep.noaa.gov/products/stratosphere/strat_a_f/gif_files/gfs_z70_nh_f240.gif
The real test of ice extent comes in the summer when it reaches it’s minimum. The minimum reached a couple of years ago won’t be attained again. It was the result of a cyclone dispersing the sea ice and our government bean counters not correctly accounting for that ice in their hurry to get to a new “all time” low ice extent record. These same government bean counters stepped on their own dicks by setting a bar too low for future comparisons. They are on a mission to save what little is left of their miserable reputations. This is just another example.
Reblogged this on Globalcooler's Weblog.