
Last time CO2 was this high, Boston was very warm. Therefore CO2 is the control knob.
Disrupting the Borg is expensive and time consuming!

Google Search
-
Recent Posts
- Cattle And The Climate
- One Atomic Bomb Per Hour
- New Video : Analyzing Oil And Gas
- Is Antarctica Melting?
- High Speed Analysis And Visualization
- El Nino To The Rescue?
- Fake News Update
- Growth Of Antarctic Sea Ice
- 65 Years Of Progress!
- El Nino To The Rescue?
- Worst March Drought On Record
- ChartGL Process Control Demo
- The Biggest Money Laundering Scam
- Drought In The Headwaters Of Lake Powell
- Unrealistic Expectations Of Water Availability
- Did Bill Gates Do This?
- Worst March Drought On Record In The US
- The Real Hockey Stick Graph
- Analyzing The Western Water Crisis
- Gaslighting 1924
- “Why Do You Resist?”
- Climate Attribution Model
- Fact Checking NASA
- Fact Checking Grok
- Fact Checking The New York Times
Recent Comments
- Robertvd on Cattle And The Climate
- Robertvd on Cattle And The Climate
- Robertvd on Cattle And The Climate
- conrad ziefle on Cattle And The Climate
- arn on Cattle And The Climate
- arn on Cattle And The Climate
- Gordon Vigurs on Cattle And The Climate
- Gordon Vigurs on Cattle And The Climate
- Jack the Insider on Cattle And The Climate
- Crispin Pemberton-Pigott on Cattle And The Climate
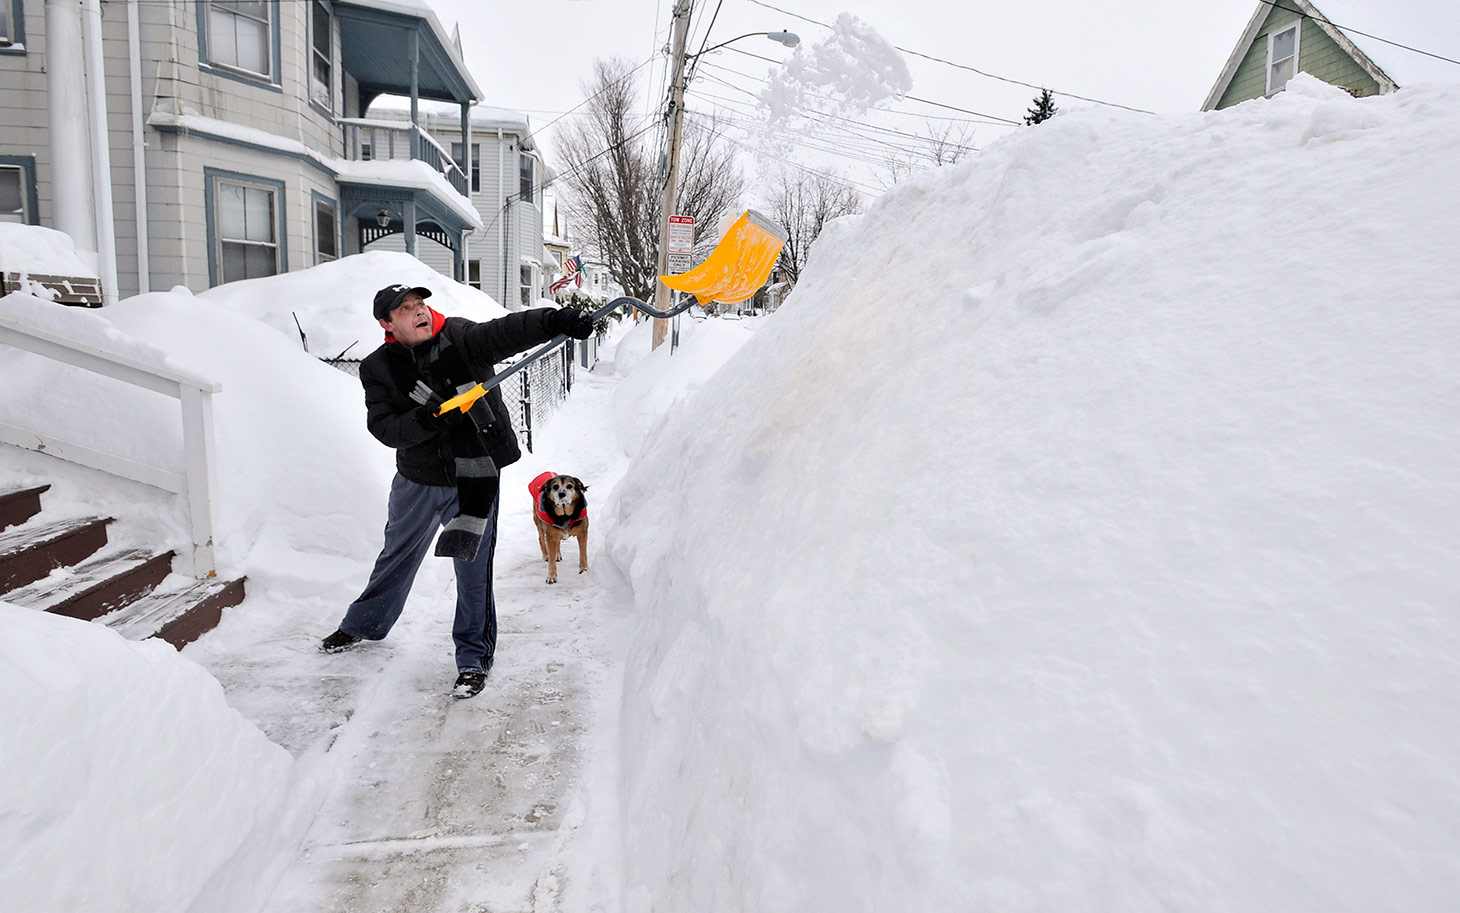
Shouldn’t the Headline read –
Learning To “Think” Like A Climate Scientist – ?
Imagine that mound as BullS***. And you have a perfect picture of the AGW theory.
http://fc07.deviantart.net/fs19/f/2007/297/e/8/Serioius_Science_by_Conservatoons.jpg
Well—-on a lighter note; my first thought when I saw the picture, was that the dog was waiting
for the dude to uncover a fire hydrant.
I am so glad I no longer live north west of Boston!
This is what they look like http://www.huffingtonpost.com/2014/08/25/nick-bowers_n_5701202.html
Odd, I was picturing this…
http://californiatrustestateandprobatelitigation.default.wp1.lexblog.com/files/2014/02/Greedy-heir.jpg
Steven, your great sense of humor is an extremely effective response to BS disguised as Nobel Prize-winning, 97%-consensus science!
Good grief, this article from discover on extinction caused by global warming. The last paragraph is priceless (for it’s alarmism).
One in Six Species Could Go Extinct With Climate Change
By Kiona Smith-Strickland | April 30, 2015 1:00 pm
Urban told Discover, “These predictions need not be realized if greenhouse gas emissions are controlled and we do not follow the current trajectory in global temperatures — or if conservation measures are put in place that are effective at limiting losses.”
http://blogs.discovermagazine.com/d-brief/2015/04/30/species-extinct-climate-change/#.VUK04ZOm34J
As Willis said SHOW ME THE BODIES! The only ones you will find are under the wind turbines…
poor birdies or cooked by solar panels
As long as species have been evolving, species have been going extinct. It is estimated that over 99.9% of all species that ever lived are extinct.
http://en.wikipedia.org/wiki/Extinction
List of all species that may have gone extinct since the invention of “CAGW”…
1979 – Last sightings of the Javan tiger.
1981 – The Puhielelu hibiscadelphus becomes extinct.
1981 – Last sighting of the green-blossom pearlymussel
– The 24-rayed sunstar.
1985 – The platypus frog
1989 – The golden toad
– The Atitlán grebe
1990 – The dusky seaside sparrow
1994 – Saint Croix racer
1997 – The Hainan ormosia
Ten in forty years. How many species are there? Good question!
About 8.7 million (give or take 1.3 million) is the new, estimated total number of species on Earth.
http://www.sciencedaily.com/releases/2011/08/110823180459.htm
Alarmists just aren’t real good with math. Maybe instead of using models, they should try a calculator.
Until humans started exhaling, there was no: warming/cooling/co2/forests disappearing/volcanoes erupting/earthquakes….
but the delta smelt is being saved
they aren’t good with numbers, you are right gator. they just massage them a la “hockey stick”.
I am expecting the every-American-breathing tax next.
http://fc01.deviantart.net/fs70/f/2010/084/c/8/Breath_Penalty_by_Conservatoons.jpg
The ‘Bird’ that needs to go extinct!
http://fc08.deviantart.net/fs70/i/2010/135/6/6/here_to_help_by_Satansgoalie.jpg
exactly gator
2021 -Climate alarmist
Ironic that the person who made that claim would use the term “knob”. He still cannot explain what the difference is between now, and then.
It is nearly identical to a term with which alarmists are closely associated…
nob
British slang term for the penis. Typically used as an excellent cheap insult. Used in jest (above “moron”, just below “twat”, and well below “c*nt”), or used to describe someone who is doing something you think is annoying or a bit crap.
Now CO2 is the cause of earthquakes
“Newsweek is not the first publication to tie global warming to earthquakes. On Monday, Countercurrents.org published a piece by Dr. Vivek Kumar Srivastava, an assistant professor at India’s Kanpur University, blaming warming on the massive quakes that rocked Nepal over the weekend.
“It now appears that there exists a clear relationship between the global warming and earthquakes and other under earth activities,” Srivastava wrote.”
http://dailycaller.com/2015/04/28/scientists-say-global-warming-will-cause-deadly-earthquakes/
They ignore the sun’s role. Ben Davidson of Suspicious0bservers issued an enhanced warning of earthquake activity based on his solar research.
https://www.youtube.com/watch?v=GIv0lpB2zjI
https://youtu.be/9XniKINwlNw?list=PLHSoxioQtwZeQaRnO5_9AJB2RmevUpuPT
I meant to share the April 24th news and it put the whole playlist. Sorry.
This is what you’re saying:
http://i.imgur.com/A7ws8P6.jpg
Global warming, real or not, was never a claim that Boston would tectonically drop in latitude and cease experiencing Winter.
Surely if you warm the surface and cool the stratosphere, more evaporation and more of the vapour freezing to snow is just what you’d expect. The temperature where it falls is not the temperature of where it evaporated.
There are plenty of good arguments against CAGW. No need to resort to absurdity.
And before anyone chimes in with David Viner’s infamous prediction about snow, that only shows Viner was a paid-up catastrophist, it doesn’t argue against an accelerated greenhouse generally. The only way snow can never form is if moist air never rises above an altitude where freezing occurs. How on earth can you ever rule that out? The air only has to be less dense than the surrounding air to rise, so it only has to be warmer, regardless of water vapour content.
What warimg?
https://suyts.files.wordpress.com/2015/04/image50.png
What increase in water vapor?
http://notrickszone.com/wp-content/uploads/2013/08/Caryl_2.png
What warming? The warming in the sea surface temperature, which has continued until this year.
http://www.woodfortrees.org/graph/hadsst3gl/mean:36/from:1950/plot/hadsst3gl/from:2000/trend
The satellites don’t measure surface temperature, just read Roy Spencer’s blog posts on that topic. They integrate over a range of altitudes which includes 1000hPa, but the value of the channel weighting function is close to zero at low altitudes. See fig 4 of http://www.drroyspencer.com/Spencer-Braswell-97-BAMS.pdf
There is a good reason the satellites are cross-checked against weather balloons and not surface temperature stations. Satellites don’t measure surface temperature. Global warming is a proposition of both surface warming and stratospheric cooling.
Your graph of relative humidity is irrelevant to your conclusion. If warming increases the theoretical moisture carrying capacity faster than the absolute humidity increases, then relative humidity decreases even while absolute humidity increases.
In fact, absolute humidity does have a positive trend of about 0.08g/kg/decade : http://hadobs.metoffice.gov.uk/hadcruh/index.html
Their data (CRU) can also be downloaded via KNMI Climate Explorer, and KNMI show only CRU as a source of absolute humidity data, no other sources are offered.
It’s these sorts of bogus arguments from the hoi polloi that StevenGoddard attracts when he strays from the firm foundation of data adjustments, WV feedback suppositions, failed models, rigged peer review, adaptability, and natural weather precedents, and just launches into snowflake silliness.
The Paris treaties are only 7 months away. It’s way overdue for genuine climate skeptics to clean their house of hollow punditry. We have good reasons to be skeptical of the IPCC position on CAGW. Stick to the good arguments and skip the fallacious ones.
What warming? The warming in the sea surface temperature, which has continued until this year.
The claimed SST warming is less than the error range of the sensors. Then of course there is the data torturing, but we’ll get to that later.
Cooling waters in the tropical Pacific Ocean appear to be a major factor in dampening global warming in recent years, scientists said on Wednesday.
Their work is a big step forward in helping to solve the greatest puzzle of current climate change research – why global average surface temperatures, while still on an upward trend, have risen more slowly in the past 10 to fifteen years than previously.
Waters in the eastern tropical regions of the Pacific have been notably cooler in recent years, owing to the effects of one of the world’s biggest ocean circulatory systems, the Pacific decadal oscillation.
Many people are aware of the El Niño and La Niña weather systems, which affect the Pacific and bring hotter and stormier or cooler weather in cycles of just a few years, and can have a strong effect on global weather. But few are aware that both of these systems are just part of the much bigger Pacific decadal oscillation, which brings warmer and cooler weather over decades.
http://www.theguardian.com/environment/2013/aug/28/cooling-pacific-dampened-global-warming
Personally, I don’t take either claims of warming or cooling oceans seriously, as we have only recently started using Argo buoys, and are still deploying them. The satellites are again more consistent and reliable.
http://cornellsailing.com/2015/04/ordinary-act-deployment-pacific-drifter-buoys-argo-floats-2/
The marine data are taken from the International Comprehensive Ocean-Atmosphere Data Set, ICOADS, from 1973 to 1997 and from the NCEP-GTS from 1998 to the present. The marine component of HadCRUH is produced by taking in-situ measurements of T and dewpoint T from ships, marine platforms and drifting buoys, and converting q and RH. Observations undergo quality checks for internal consistency, spatial consistency and outliers and the remaining values are converted to anomalies by subtracting climatological means based on the period 1974 to 2003. The anomaly values are then averaged over a 5° by 5° monthly mean grid.
Wow! That sure is alot of fiddling. But you are OK with that, apparently.
I’ve been suspicious about sea surface temperatures since the bizarro Unisys incident a few weeks ago, when they suddenly replaced cold North Atlantic temperatures with warm ones, based on a completely incoherent explanation.
The claims of record 2014 heat are based on sea surface temperatures, which don’t make any sense. Look at the strip between Greenland and Iceland – they show sea surface temperatures about 6C above normal.
https://stevengoddard.files.wordpress.com/2014/12/sst_anom.gif?w=640&h=480
Now look at the sea ice map. Ice extends all the way from Greenland to Iceland – far above normal.
https://stevengoddard.files.wordpress.com/2014/12/n_daily_extent-1.png?w=640
It is simply not credible that the seas between Greenland and Iceland are 6C above normal, and have excess ice. The excess ice indicates that sea surface temperatures there are below normal. Something is seriously amiss.
https://stevengoddard.wordpress.com/2014/12/10/something-is-very-rotten-in-denmark/
Everything you present to counter my claims is based upon fudged data, and therefore is an artifact of analysis at best, and fraud at worst.
da·ta ?dad?,?d?d?/ noun
1- facts and statistics collected together for reference or analysis.
ar·ti·fact ?ärd?fakt/ noun
1- an object made by a human being…
fraud ?fro?d\ noun 1- the crime of using dishonest methods to take something valuable from another person, a copy of something that is meant to look like the real thing in order to trick people
Bernie Madoff went to jail for this very thing.
If warming increases the theoretical moisture carrying capacity faster than the absolute humidity increases, then relative humidity decreases even while absolute humidity increases.
Again, what warming?
As Tony has repeatedly pointed out, the surface temps are warming (UHI and fiddling) while the more reliable satellite data shows no warming for 20 years now.
https://stevengoddard.files.wordpress.com/2014/01/screenhunter_253-jan-22-11-02.gif
ftp://ftp.ssmi.com/msu/monthly_time_series/rss_monthly_msu_amsu_channel_tlt_anomalies_land_and_ocean_v03_3.txt
data.giss.nasa.gov/gistemp/graphs_v3/Fig.A2.txt
And now RSSS and UAH data are a close match.
https://suyts.files.wordpress.com/2015/04/image_thumb50.png?w=663&h=441
Version 6 of the satellite data shows faster warming in the early part of the satellite record, which stretches from Dec. 1978 to March. 2015, but shows reduced, or even eliminated, warming in the latter part of the record, wrote climatologists Roy Spencer, John Christy and William Braswell. UAH Version 6 satellite data now shows a decreased warming trend of 0.114 degrees Celsius per decade, compared to Version 5.6’s 0.140 degree trend.
“This is partly due to our new diurnal drift adjustment, especially for the NOAA-15 satellite,” the scientists added. “Even though our approach to that adjustment (described later) is empirical, it is interesting to see that it gives similar results to the RSS approach, which is based upon climate model calculations of the diurnal cycle in temperature.
Version 6 also shows that land areas have warmed faster than ocean areas. Land areas have warmed at a rate of 0.19 degrees Celsius per decade while ocean areas have only warmed at 0.08 degrees per decade — both of these, however, are below warming trends shown by surface thermometer data.
Children are not allowed to ‘adjust’ report cards to gain favor with their parents, or alter history to improve their history exam scores.But ‘scientists’ are allowed to constantly change historic temps and contemporary data to fit their agendas?
https://stevengoddard.files.wordpress.com/2014/12/gissus19992014.gif?w=640
You just keep ingesting the ever changing artifacts, bow to your masters when they tell you the MWP never happened, and that we must eliminate the 1940’s blip.
https://stevengoddard.files.wordpress.com/2015/03/screenhunter_7839-mar-10-09-25.gif?w=640
From: Tom Wigley
To: Phil Jones
Subject: 1940s
Date: Sun, 27 Sep 2009 23:25:38 -0600
Cc: Ben Santer
It would be good to remove at least part of the 1940s blip, but we are still left with “why the blip”.
You present nothing but nonsense. You certainly do not sound like a skeptic to me, but rather a troll sent here to sow confusion.
Go buy some carbon credits.
Suck your own bullshit. Leave the rest of us out of it.
I’m serious, go to north korea, and live there, or china and live there. Unelss you are the example that they want the world to see, then you are no better than them. Or go live in the middle east then?
WHAT POLAR VORTEX? —– OOOPS!
North America
http://www.cosmographicresearch.org/Images/glacial_maximum_map2.jpg
Wisconsin Ice Age Glacial Maximum – Artist’s rendition
http://www2.nau.edu/rcb7/namQ.jpg
Wisconsin Ice Age Glacial Maximum – geologist’s rendition
Eurasia during most extreme part of full glacial conditions (17,000-15,000 14C y.a.). – geologist’s rendition
http://www.esd.ornl.gov/projects/qen/euras(2_.gif
“This map concentrates on the time window slightly after the LGM, when aridity seems to have reached its most extreme point. Only slightly moister conditions prevailed for most of the period 22,000-14,000 14C y.a. (25,000-15,000 calendar years ago). A large area of extreme desert conditions existed across central Asia (dark red), surrounded by semi-desert (light red), under conditions much colder than the present-day. In the north, Siberia was colder and much more arid, with steppe-tundra (pink) and polar desert (grey). Ice masses (light grey) were present in north-western Siberia. In China, colder more arid conditions caused a retreat of forests, with grasslands (yellow) and open woodlands (medium green) in southern China and Japan. Forest steppe (violet) and conifer forest (blue green) may have predominated elsewhere. In south Asia, rainforest (darkest green) retreated and was replaced by grasslands (yellow) and monsoon forests and woodlands (lime-green). Scrub and open woodland (lighest green) probably existed in presently moist forest climates of Bangladesh and SW China.”
…….
Seems the Wisconsin Ice Age and the present weather system had the meridional pattern jet stream (negative Arctic Oscillation) in common! —OOOPS!
http://frontierscientists.com/wp-content/uploads/2013/06/JetStream_Meridional.jpg
“The Polar jet stream is pictured in this screencap of NASA video “Aerial Superhighway”. This image portrays a meridional jet stream, with winds meandering more slowly, predominantly north-to-south. The fastest winds are colored red; slower winds are blue. / Courtesy NASA (National Aeronautics and Space Administration) Goddard Space Flight Center”
http://frontierscientists.com/wp-content/uploads/2013/06/JetStream_ArcticOscillation.jpg
Andrew M says “There are plenty of good arguments against CAGW. No need to resort to absurdity.” Perhaps Andrew might like to start his own blog and show us how it is done.
It turns out there really isn’t any good evidence for macro-evolution. In a way similar to how AGW is being uncritically taught to a generation, many have been incorrectly taught that there was good evidence for macro-evolution. See
http://scienceagainstevolution.info/topics.htm
and
http://www.detectingdesign.com/
The best humor is one that cuts to the truth. Absurdities like warming causes snow and cold (current theory) explains why 50% of youth do not believe in CAGW. Unfortunately 50% still do! Since alarmists won’t look at the science, keep up with the humor! It’s better than the ad-homenim attacks and name calling that alarmists resort to.
Correction: Almost 50% It’s actually 43%.
http://joannenova.com.au/2015/04/youth-are-rebelling-against-climate-dogma-at-18-20-nearly-half-in-us-are-skeptical/
USA http://www.rasmussenreports.com/public_content/politics/current_events/environment_energy/environment_update
December 2014
Human activity…. Planetary Trends …. Other Reason
42% …………………… 42% ………………….. 7%
Looks like either an even split or CAGW believers are only 42% of those polled.
http://www.rasmussenreports.com/public_content/politics/current_events/environment_energy/environment_update
December 2014
Global Warming is Primarily Caused By…
Human activity…. Planetary Trends …. Other Reason
42% ……………………… 42% ……………………. 7%
Looks like either an even split or CAGW is only 42%.
Thanks for the link. Similar poll. Same result. Neck and neck.
The propaganda is not working the way they had hoped it would.
Even worse, those who do think “Global Warming is Primarily Caused By Human activity” are suffering from adrenal fatigue and just don’t care any more. In other surveys Global Warming comes in near last or dead last on the list of concerns.
In 2013 it was found 76% of Americans are living paycheck-to-paycheck