I am a wheat trader. Vomi can wreck the value of wheat as some importing countries have very strict tolerances. Even as feed 10ppm hurt cattle weight gain. Human consumption is 2ppm.
But perhaps you have struck on the real cause of the climate hysteria.
Remember the Salem Witch events? The most likely theory in my opinion is that the town’s wheat was infected by Ergot (another wheat disease), which, in the right conditions, acts as a halucinogen similar to LSD. The whole town was tripping on acid and did not understand it.
I think tofu or kale must be similarly infected because it seems to be that crowd that is living in a purple haze. Check the vending machines at NASA and NOAA.
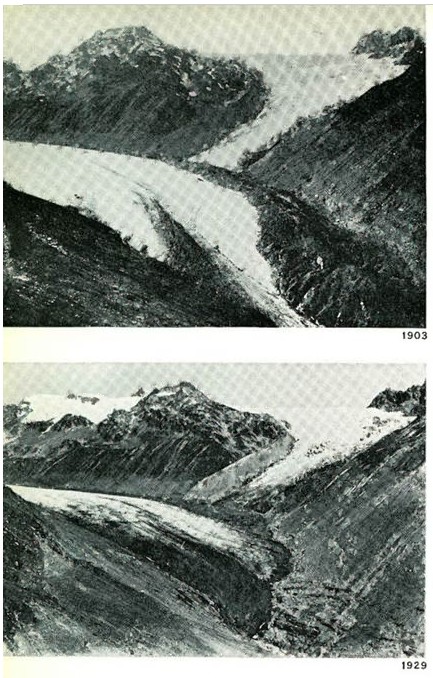
But does ice growing back indicate temperature tampering.
From LSAT data.
Figure 6. Change analyses of Hintereisferner for the 1991 and 1997 images and a scatter plot of
the area of Hintereisferner 1894–2002. Dark grey colours in the images indicate correctly identifed pixels, light grey and black colours refer to omissions and commissions respectively. Omissions refer to those pixels that are classified as glacier but are not in real-time. Circles in the scatter plot are computed areas from reference grids, triangles are derived from the glacier masks (satellite). The error bars average 15 % omissions. Arrows indicate omissions of the ice areas on the flanks of Rofenköpfe.
Shows growth in glacier area 1953 to 1978. Also – (their words, no mine) Between 1991 and 1997 a gain in area of 6 km2 was recorded. The 1991 mask of Hintereisferner and neighbouring glaciers contained multiple gaps of 1–4 pixels each, despite of the fairly high NDSI threshold used (0.59). Whilst comparing to the situation in 1997 these gaps produce the gain in area. Although finding the reason, it was decided not to manipulate the mask as the least possible manual alterations were desired. The changes in area are shown in Figure 7. It can be seen that the majority of calculated losses in area are at the tongues of individual glaciers and are consistent with the common retreat dynamics of glaciers. It is interesting to notice the retreat of the snout of the glacier Kesselwandferner (Inset Fig. 7b). Firstly it advanced 320 m between 1965–1985. Thereafter it started its retreat to the position in 1998 that corresponds to the one in 1965 (Span 1999). This retreat is shown in the inset of Figure 7b. It can be seen as well in the smaller inset that Langtauferer-Joch-Ferner lost its connection with Hintereisferner between 1985 and 1999.
So from 1965 to 1985 if grew and in 1998 was back to 1965 position. And during the ‘highest temperatures ever’ –
1998–1999 Area from images – 8.16 / –0.7% Data from glaciological records
2001–2002 Area from images – 8.58 / +8.7% Data from glaciological records


This is why I love this site. Not sure where you find these or where you get the time, but it is appreciated.
I was searching information about gluten and a grain fungus called vomitoxin.
http://en.wikipedia.org/wiki/Vomitoxin
Then this little ditty at the end of the first paragraph:
“It occurs abundantly in grains in Norway due to climate change.[4]”
Looking further about Climate Change in Norway, I found the following tripe from “State of the Environment Norway”:
http://www.environment.no/Topics/Climate/Norways-climate/Impacts-in-Norway/
It’s worth a read for the oozing propaganda and laughs.
ps: Steven Goddard, I love your Twitter page.
I am a wheat trader. Vomi can wreck the value of wheat as some importing countries have very strict tolerances. Even as feed 10ppm hurt cattle weight gain. Human consumption is 2ppm.
But perhaps you have struck on the real cause of the climate hysteria.
Remember the Salem Witch events? The most likely theory in my opinion is that the town’s wheat was infected by Ergot (another wheat disease), which, in the right conditions, acts as a halucinogen similar to LSD. The whole town was tripping on acid and did not understand it.
I think tofu or kale must be similarly infected because it seems to be that crowd that is living in a purple haze. Check the vending machines at NASA and NOAA.
I think you are on to something! No wonder the Vegans are often Fruit loops (Tony is one of the few exceptions)
There is also the problem of brain development in their kids.
Reducing diet early in pregnancy stunts fetal brain development, study finds
This gives lots of links about half way down the page: http://board.crossfit.com/showthread.php?t=41759
Also on the ergot poisoning? It looks like a good bet.
Oh, and Vomi has been occuring in Triticum since the beginning of time.
Reblogged this on Climatism.
But does ice growing back indicate temperature tampering.
From LSAT data.
Figure 6. Change analyses of Hintereisferner for the 1991 and 1997 images and a scatter plot of
the area of Hintereisferner 1894–2002. Dark grey colours in the images indicate correctly identifed pixels, light grey and black colours refer to omissions and commissions respectively. Omissions refer to those pixels that are classified as glacier but are not in real-time. Circles in the scatter plot are computed areas from reference grids, triangles are derived from the glacier masks (satellite). The error bars average 15 % omissions. Arrows indicate omissions of the ice areas on the flanks of Rofenköpfe.
Page 14 of http://www.helsinki.fi/geography/geoinformatics/pdf/zgg_41_055-075_hendriks.pdf
Shows growth in glacier area 1953 to 1978. Also – (their words, no mine)
Between 1991 and 1997 a gain in area of 6 km2 was recorded. The 1991 mask of Hintereisferner and neighbouring glaciers contained multiple gaps of 1–4 pixels each, despite of the fairly high NDSI threshold used (0.59). Whilst comparing to the situation in 1997 these gaps produce the gain in area. Although finding the reason, it was decided not to manipulate the mask as the least possible manual alterations were desired. The changes in area are shown in Figure 7. It can be seen that the majority of calculated losses in area are at the tongues of individual glaciers and are consistent with the common retreat dynamics of glaciers. It is interesting to notice the retreat of the snout of the glacier Kesselwandferner (Inset Fig. 7b). Firstly it advanced 320 m between 1965–1985. Thereafter it started its retreat to the position in 1998 that corresponds to the one in 1965 (Span 1999). This retreat is shown in the inset of Figure 7b. It can be seen as well in the smaller inset that Langtauferer-Joch-Ferner lost its connection with Hintereisferner between 1985 and 1999.
So from 1965 to 1985 if grew and in 1998 was back to 1965 position. And during the ‘highest temperatures ever’ –
1998–1999 Area from images – 8.16 / –0.7% Data from glaciological records
2001–2002 Area from images – 8.58 / +8.7% Data from glaciological records
it grew.