
The Guardian reports that Arctic ice is melting “faster and earlier”
Arctic ice melting faster and earlier as scientists demand action | Environment | The Guardian
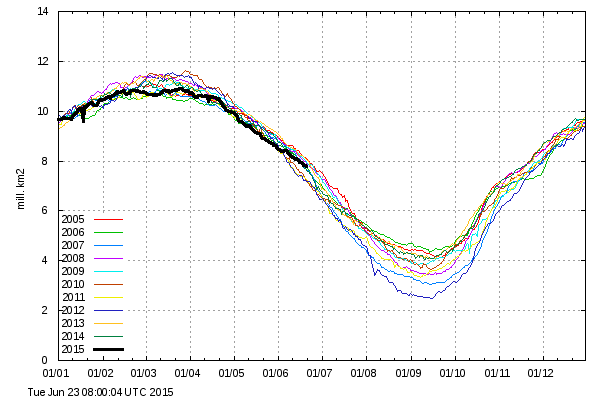
What is actually going on is the exact opposite of the Guardian’s claims. Arctic sea ice is melting very slowly, and is nearing a mid-summer high for the past decade.
Arctic sea ice looked like this on June 20 – nothing like the fake picture in their May 5 article.
The Greenland melt season started more than a month late, and has seen below normal melt every day this year.
The capital of Greenland is having its coldest year on record, with temperatures plummeting over the past decade.
ftp://ftp.ncdc.noaa.gov/pub/data/ghcn/daily/all/GL000004250.dly
Every single claim in the Guardian article is incorrect. Their goal is to mislead their readers and direct them towards disastrous policies which destroy the English countryside.
“A lie told often enough becomes the truth”
– Vladimir Lenin“The most brilliant propagandist technique will yield no success unless one fundamental principle is borne in mind constantly and with unflagging attention. It must confine itself to a few points and repeat them over and over. Here, as so often in this world, persistence is the first and most important requirement for success”
– Adolf Hitler

And just to make sure their propaganda is never refuted by facts, the Groiniad censors comments allowing no real discussion.
Of course they are also losing paying customers by the droves. Guardian CEO: my newspaper can’t survive in the UK (Ain’t Karma wonderful.)
A few years ago i would read something like this in the Guardian and I would feel I had to do something.
These days, so much is going against the Guardian that I now just laugh at their antics.
it is hard to take them seriously any longer because they are so much out on a limb – sitting on a branch with a saw cutting.
And we say “please don’t cut that branch … please don’t …” and do we really want them to stop printing their garbage any longer now that no one takes it seriously?
…it is a tale Told by an idiot, full of sound and fury, Signifying nothing.
A quote from the Guardian?
My, you’re are taking a risk,
They banned me from commenting
They were ever so brisk.
http://rhymeafterrhyme.net/the-guardian-and-censorship/
I like the poem; however, I do have to agree with the idea that there is no sky dragon.
I have to disagree with much more that is in (parts of) the Guardian and much of SKS.
I know you’re a big fan of DMI Steve, but does this graph of theirs really look like it’s “nearing a mid-summer high for the past decade” to you?
http://greatwhitecon.info/wp-content/uploads/2015/06/DMI-CICE_thick_LA_EN_20150622-1024×865.png
Jim is just upset that he was not listed as the climate criminal of the day. He works so very hard at keeping money flowing to bogus climate change studies, instead of starving children.
Better luck next time Jim.
He is linked in with eth Exeter Uni climate alarmists.. Betts, and that silly lady, who’s name I can’t remember.
I thought he had been sack for blatant incompetence….
maybe he’s just been cut back to part time propaganda.
Hey Jimbo, have you done any research on the Arctic temps and sea ice level for most of the last 10,000 years yet?
Willing to admit that Arctic sea ice is actually quite high compared to the seasonal ice from the earlier Holocene?
No?? You still haven’t found any honesty or integrity within your putrid soul??
Jim H.
Note that Steve’s graph is area and theirs is volume.
It may not be too out of line, but I would like to see the methodology of determining
the volume.
Perhaps the average height of the ice sheet(s) can regularly and readily be determined
but it would seem that winds, currents and perhaps other factors can readily play a variable role in changing the amount sort of (squished) together. I see no confidence interval associated with it.
Tell you what Jim, average the DMI and your beloved NSIDC data and call it a day.The arctic is not melting down.
Why not use this volume graph?
http://psc.apl.washington.edu/wordpress/wp-content/uploads/schweiger/ice_volume/BPIOMASIceVolumeAnomalyCurrentV2.1.png
Coz Tony luvs DMI?
Coz Iceland shared the Danish Monarchy until World War II and Iceland needs real data not the pasturized pap served to the lemings of the world.
Notice how the countries around the Arctic circle are not falling for the Gore Bull Warbling? They are well aware their countries will sit under a glacier if it turns cold. They also know their agriculture is marginal and even a return to the weather of the 1960s spells famine and unreast.
In 1976 CIA warned of global cooling bring drought famine social unrest.
The 1974 CIA report: A Study of Climatological Research as it Pertains to Intelligence Problems
Why else do you think Putin is desperate to keep the Ukraine in the Russian sphere of influence? Not only is it a warm water port it is also the breadbasket of Europe with rich farmland. The original agreement was the Ukraine would remain in the Russian sphere and the European Union and NATO (usa) broke that agreement. SEE: Luboš Motl of the Czech Republic on the happenings in the Ukraine
In a new paper Russian solar physicist Habibullo Abdussamatov predicts another Little Ice Age within the next 30 years. Dr. Abdussamatov is the supervisor of the Astrometria project of the Russian section of the International Space Station and the head of Space research laboratory at the Saint Petersburg-based Pulkovo Observatory of the Russian Academy of Sciences. So he is someone Putin would listen to.
Here are a couple of Russian peer-reviewed papers showing the climate in Russia is cooling long term.
Holocene climate conditions in central Yakutia [Eastern Siberia] inferred from sediment composition and fossil chironomids of Lake Temje
Larisa Nazarova, Herman Lüpfert, Dmitry Subetto, Ludmila Pestryakova, Bernhard Diekmann
Another Russian paper:
A combined oxygen and silicon diatom isotope record of Late Quaternary change in Lake El’gygytgyn, North East Siberia
4 George E.A. Swann1*, Melanie J. Leng1,2, Olaf Juschus3, Martin Melles3, Julie Brigham-Grette4, Hilary J.
Sloane1
The Russian weather has not exactly made the Russians think it is getting warmer either.
So now Jim changes from extent to volume. Why Jim? Because it’s the only measurement you can find from somebody that shows any decline? Oh, and BTW. I don’t see 2006 on that graph.
dec·ade ?dek?d noun 1. a period of ten years.
Jim isn’t the brightest or most honest troll. He still has not explained why he refuses to confront alarmists who make ridiculous apocalyptic statements on a world stage, and why he continues moon over Tony. Obviously he is not about correcting inaccurate statements, and obviously he carries some form of torch for Tony. Jim also could not figure out the message in Lomborg’s TED talk (or lied), and continues to lobby against starving children, and in favor of ice. So why would we expect a cogent argument from such a sick individual?
https://www.youtube.com/watch?v=Dtbn9zBfJSs
We’ve been having global warming! At least in the Northern Hemisphere anyhow. It is commonly referred to as summer.
Yeah, summer.
That’s when the neighbors leave bags of summer squash and zuchnni aka baseball bats on the porch when you are not looking.
https://manicddaily.files.wordpress.com/2011/09/20110902-081617.jpg
Come on Gail, you know it was that there dawg that brung that zucchini ! 🙂
And here I thought it was the zucchini that birthed that dawg.
https://lastroadreviews.files.wordpress.com/2013/01/20130102-212743.jpg
Still a little early for that here. Give it another 2 to 4 weeks. But the fields around here that haven’t been flooded look great! I also noticed the early southern sweet corn this year has been excellent. Almost as good as Indiana corn which will be showing up at the road side stands very soon.
https://www.youtube.com/watch?v=ojFjntE3Yko
Alright, you guys are having too much fun!
and squash is sooo good for you.
One of the many reasons why Stevengoddard’s is so much more fun to hang around than WUWT.
Could it be that using cars to transport these things to other homes is driving them out of their gourds?
===|==============/ Keith DeHavelle
Every populist movement requires hard times and a class of people that can be vilified as the cause – from the medieval witch burners to Hitler’s Jew haters ad-infinitum.
The climate change movement is no different except that the hard times are mythical future prognostications. “Save the planet” is the new catch cry and “Deniers” are the new sinners.
Nothing new here – hopefully the human race will one day have the intelligence to think for themselves rather than follow just another false prophet.
Hopefully they will also avoid the witch burnings this time around even if they are still blaming others for the weather.
You gotta be a real optimist to say something like that after Obama has been elected TWICE and still has significant support despite all the damage he’s done!
The alchemy crowd that frequents this site has had to backpedal in light of recent reanalysis of climate trends over the past 15 years. Contrary to skeptics’ (scientific illiterates’ ?) claims that the earth has undergone a recent warming hiatus, a reanalysis shows just the long, inexorable trend continues. Here’s was actual scientists (not the pseudo frauds that are found on these pages stringing together ad hoc newspaper clippings and trembling all the while at the prospect of a WORLD GOVERNMENT) have to say (excerpted from realclimate.org)
“Over this interval 1999-2010 the warming trend is actually larger than the long-term trend of 0.175 °C per decade. Yet it is not statistically significant. But this has nothing to do with the trend being small, it simply is to do with the confidence interval being large, which is entirely due to the shortness of the time period considered. Over a short interval, random variability can create large temporary trends. (If today is 5 °C warmer than yesterday, than this is clearly, unequivocably warmer! But it is not “statistically significant” in the sense that it couldn’t just be natural variability – i.e. weather.) – See more at: http://www.realclimate.org/index.php/archives/2014/12/recent-global-warming-trends-significant-or-paused-or-what/#sthash.AmlclQxd.dpuf”
The skeptics’ (idiots’ ?) have been defanged of another one of the impotent tools.
Moron alert
Yes, the “new” analysis that goes against all other data sets.
The alchemy crowd that frequents this site has had to backpedal in light of recent reanalysis of climate trends over the past 15 years. Contrary to skeptics’ (scientific illiterates’ ?)…
These scientific illiterates?
Dr. Phil Jones – CRU emails – 5th July, 2005
“The scientific community would come down on me in no uncertain terms if I said the world had cooled from 1998. OK it has but it is only 7 years of data and it isn’t statistically significant….”
Dr. Phil Jones – CRU emails – 7th May, 2009
‘Bottom line: the ‘ no upward trend’ has to continue for a total of 15 years before we get worried.’
__________________
Dr. Judith L. Lean – Geophysical Research Letters – 15 Aug 2009
“… This lack of overall warming is analogous to the period from 2002 to 2008 when decreasing solar irradiance also countered much of the anthropogenic warming…”
__________________
Dr. Kevin Trenberth – CRU emails – 12 Oct. 2009
“Well, I have my own article on where the heck is global warming…..The fact is that we can’t account for the lack of warming at the moment and it is a travesty that we can’t.”
__________________
Dr. Mojib Latif – Spiegel – 19th November 2009
“At present, however, the warming is taking a break,”…….”There can be no argument about that,”
__________________
Dr. Jochem Marotzke – Spiegel – 19th November 2009
“It cannot be denied that this is one of the hottest issues in the scientific community,”….” We don’t really know why this stagnation is taking place at this point.”
__________________
Dr. Phil Jones – BBC – 13th February 2010
“I’m a scientist trying to measure temperature. If I registered that the climate has been cooling I’d say so. But it hasn’t until recently – and then barely at all. The trend is a warming trend.”
__________________
Dr. Phil Jones – BBC – 13th February 2010
[Q] B – “ Do you agree that from 1995 to the present there has been no statistically-significant global warming”
[A] “ Yes, but only just”.
__________________
Prof. Shaowu Wang et al – Advances in Climate Change Research – 2010
“…The decade of 1999-2008 is still the warmest of the last 30 years, though the global temperature increment is near zero;…”
__________________
Dr. B. G. Hunt – Climate Dynamics – February 2011
“Controversy continues to prevail concerning the reality of anthropogenically-induced climatic warming. One of the principal issues is the cause of the hiatus in the current global warming trend.”
__________________
Dr. Robert K. Kaufmann – PNAS – 2nd June 2011
“…..it has been unclear why global surface temperatures did not rise between 1998 and 2008…..”
__________________
Dr. Gerald A. Meehl – Nature Climate Change – 18th September 2011
“There have been decades, such as 2000–2009, when the observed globally averaged surface-temperature time series shows little increase or even a slightly negative trend1 (a hiatus period)….”
__________________
Met Office Blog – Dave Britton (10:48:21) – 14 October 2012
“We agree with Mr Rose that there has been only a very small amount of warming in the 21st Century. As stated in our response, this is 0.05 degrees Celsius since 1997 equivalent to 0.03 degrees Celsius per decade.”
Source: metofficenews.wordpress.com/2012/10/14/met-office-in-the-media-14-october-2012
__________________
Dr. James Hansen – NASA GISS – 15 January 2013
“The 5-year mean global temperature has been flat for a decade, which we interpret as a combination of natural variability and a slowdown in the growth rate of the net climate forcing.”
__________________
Dr Doug Smith – Met Office – 18 January 2013
“The exact causes of the temperature standstill are not yet understood,” says climate researcher Doug Smith from the Met Office.
[Translated by Philipp Mueller from Spiegel Online]
__________________
Dr. Virginie Guemas – Nature Climate Change – 7 April 2013
“…Despite a sustained production of anthropogenic greenhouse gases, the Earth’s mean near-surface temperature paused its rise during the 2000–2010 period…”
__________________
Dr. Judith Curry – House of Representatives Subcommittee on Environment – 25 April 2013
” If the climate shifts hypothesis is correct, then the current flat trend in global surface temperatures may continue for another decade or two,…”
__________________
Dr. Hans von Storch – Spiegel – 20 June 2013
“… the increase over the last 15 years was just 0.06 degrees Celsius (0.11 degrees Fahrenheit) — a value very close to zero….If things continue as they have been, in five years, at the latest, we will need to acknowledge that something is fundamentally wrong with our climate models….”
__________________
Professor Masahiro Watanabe – Geophysical Research Letters – 28 June 2013
“The weakening of k commonly found in GCMs seems to be an inevitable response of the climate system to global warming, suggesting the recovery from hiatus in coming decades.”
__________________
Met Office – July 2013
“ The recent pause in global warming, part 3: What are the implications for projections of future warming?
………..
Executive summary
The recent pause in global surface temperature rise does not materially alter the risks of substantial warming of the Earth by the end of this century.”
Source: metoffice.gov.uk/media/pdf/3/r/Paper3_Implications_for_projections.pdf
__________________
Professor Rowan Sutton – Independent – 22 July 2013
“Some people call it a slow-down, some call it a hiatus, some people call it a pause. The global average surface temperature has not increased substantially over the last 10 to 15 years,”
__________________
Dr. Kevin Trenberth – NPR – 23 August 2013
“ They probably can’t go on much for much longer than maybe 20 years, and what happens at the end of these hiatus periods, is suddenly there’s a big jump [in temperature] up to a whole new level and you never go back to that previous level again,”
__________________
Dr. Yu Kosaka et. al. – Nature – 28 August 2013
“ Recent global-warming hiatus tied to equatorial Pacific surface cooling
Despite the continued increase in atmospheric greenhouse gas concentrations, the annual-mean global temperature has not risen in the twenty-first century…”
__________________
Professor Anastasios Tsonis – Daily Telegraph – 8 September 2013
“We are already in a cooling trend, which I think will continue for the next 15 years at least. There is no doubt the warming of the 1980s and 1990s has stopped.”
__________________
Dr. Kevin E. Trenberth – Nature News Feature – 15 January 2014
“The 1997 to ’98 El Niño event was a trigger for the changes in the Pacific, and I think that’s very probably the beginning of the hiatus,” says Kevin Trenberth, a climate scientist…
__________________
Dr. Gabriel Vecchi – Nature News Feature – 15 January 2014
“A few years ago you saw the hiatus , but it could be dismissed because it was well within the noise,” says Gabriel Vecchi, a climate scientist…“Now it’s something to explain.”…..
__________________
Professor Matthew England – ABC Science – 10 February 2014
“Even though there is this hiatus in this surface average temperature, we’re still getting record heat waves, we’re still getting harsh bush fires…..it shows we shouldn’t take any comfort from this plateau in global average temperatures.”
__________________
Dr. Jana Sillmann et al – IopScience – 18 June 2014
Observed and simulated temperature extremes during the recent warming hiatus
“This regional inconsistency between models and observations might be a key to understanding the recent hiatus in global mean temperature warming.”
__________________
Dr. Young-Heon Jo et al – American Meteorological Society – October 2014
“…..Furthermore, the low-frequency variability in the SPG relates to the propagation of Atlantic meridional overturning circulation (AMOC) variations from the deep-water formation region to mid-latitudes in the North Atlantic, which might have the implications for recent global surface warming hiatus.”
__________________
Dr. Hans Gleisner – Geophysical Research Letters – 2015
Recent global warming hiatus dominated by low latitude temperature trends in surface and troposphere data
Over the last 15 years, global mean surface temperatures exhibit only weak trends…..Omission of successively larger polar regions from the global-mean temperature calculations, in both tropospheric and surface data sets, shows that data gaps at high latitudes can not explain the observed differences between the hiatus and the pre-hiatus period….
http://onlinelibrary.wiley.com/doi/10.1002/2014GL062596/abstract
__________________
==
Shuai-Lei Yao et al – Theoretical and Applied Climatology – 9 January 2015
The global warming hiatus—a natural product of interactions of a secular warming trend and a multi-decadal oscillation
….We provide compelling evidence that the global warming hiatus is a natural product of the interplays between a secular warming tendency…..
http://link.springer.com/article/10.1007/s00704-014-1358-x
__________________
H. Douville et al – 2015
The recent global-warming hiatus: What is the role of Pacific variability?
The observed global mean surface air temperature (GMST) has not risen over the last 15 years, spurring outbreaks of skepticism regarding the nature of global warming and challenging the upper-range transient response of the current-generation global climate models….
http://onlinelibrary.wiley.com/doi/10.1002/2014GL062775/abstract
__________________
Dr. Kevin E. Trenberth 11 July 2014
Seasonal aspects of the recent pause in surface warming
Factors involved in the recent pause in the rise of global mean temperatures are examined seasonally. For 1999 to 2012, the hiatus in surface warming is mainly evident in the central and eastern Pacific…….atmospheric circulation anomalies observed globally during the hiatus.
in light of recent reanalysis of climate trends over the past 15 years. ……….., a reanalysis shows just the long, inexorable trend continues.
===
You poor little thing……you don’t even see the total disconnect