
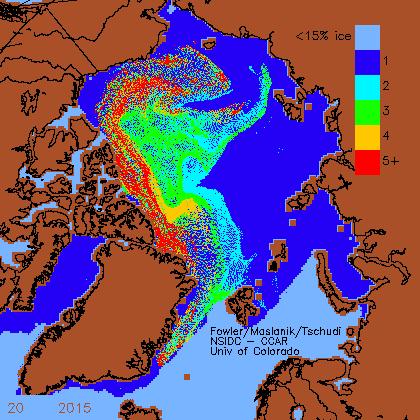
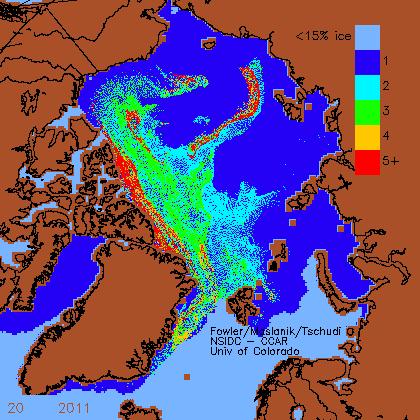
Arctic sea ice is rapidly recovering from its lows in 2007 and 2012. The reason the lows occurred was because starting in 1988, winter winds were blowing a lot a sea ice out into the North Atlantic, where it melted. The loss of thick multi-year ice led to large summer melts.
But since 2011 the winter winds have changed, and there has been a large increase in the amount of thick multi-year ice. This ice is harder to melt in summer, and has led to the higher summer minimums seen in recent years.
It has nothing to do with “global warming” and never did.

Remember how long it took the warming mongers, to “finally acknowledge” that there’s record volumes of Ice in the Antarctic region ; we can expect the same aversion to anything gaining Ice, especially the Arctic making a recovery.
Reblogged this on Climate Collections.
“Steven Goddard” is a good brand.
That’s my only issue with realclimatescience. I just referenced and transcribed this blog at the hotair qotd: http://hotair.com/archives/2015/07/16/quotes-of-the-day-2143/comment-page-4/#comment-9603037
I added this to the text:
Yup, the whole “melting Arctic ice” thing has been a cycle. Not due to “global warming.” It’s a scam.
Jeb Bush: “The climate is changing, and I’m concerned about that. We need to work with the rest of the world to negotiate a way to reduce carbon emissions.”
In contrast:
Donald Trump: “This very expensive GLOBAL WARMING bullshit has got to stop.”
So what is your bet for this years minimum sea ice area/extent/volume? You seem to know a priori that the recovery will continue…
My bet is, if the ice melts you’ll cheer about it, and if it doesn’t you’ll lie about it. I’ll put $100 down.
Your $100 is a safe bet…
My bet is that cfgi will be quiet about the uptick in today’s extent graph:
http://ocean.dmi.dk/arctic/plots/icecover/icecover_current_new.png
But he will resume being noisy when the extent graph resumes its ordinary fall.
Every year the arctic loses more than half its ice. It’s normal. Every 30 years the ice decreases, followed by thirty years when the ice increases. It’s normal.
I don’t watch sea-ice melt because it is wildly exciting; I do it because, like a summer sky, normalcy can hold serenity and beauty. It is better than watching paint dry, because with paint there can be a problem caused by inhaling the fumes. I think certain Alarmists have inhaled too many fumes, because when they see what is normal they flip out.
https://sunriseswansong.wordpress.com/2015/07/12/arctic-sea-ice-breaking-up-is-hard-to-do/
I don’t know why the uptick doesn’t show on the above DMI graph. Let me try again:
http://ocean.dmi.dk/arctic/icecover.uk.php
to me that looks like the the melting has hit the myi far sooner than the last two years,indicating the thicker ice has increased in area. the next 4 weeks should be a good indicator of where we will end up extent wise. as usual ,some areas have less ice than the previous years,some have more. the weather will decide how they end up overall.
Every once in awhile they get bogus numbers. have to see if it stays there.
The way its behaving, it could easily come in somewhat above 6M km².
Depends on the winds and the weather up there, as it always has.
The DMI graph is starting to repeat the patterns of 2013 and 2014, with a small plateau from mid July to the beginning of August. The plateau almost formed even in 2012.
There is high possibility that the ice will reach the 1979-2000 mean, or slightly above, be mid August.
The Arctic ice recovery continues apace and should accelerate even more in 2016, due to the declining of the present solar cycle.
Certainly nowhere near as low as during the first 7000 or so years of the current Holocene interglacial.
Back then, summer sea ice was non-existent, with sea ice only being a problem during winter.
And how did insolation differ back then?
There must have been a lot of SUV’s driving around emitting evil CO2 then. How else could the ice disappear in summer?
Insolation at 65 N was much higher then,
https://upload.wikimedia.org/wikipedia/commons/5/53/MilankovitchCyclesOrbitandCores.png
we’re presently at a local minimum that will stay at levels similar to now for a very long time (more than 1k years before any significant change).. glacial inception should happen at some point during this period, IMO.
From the United Nations “MY World” initiative, which has recorded the opinions for All Countries & Country Groups with votes of 7,679,273 at the time of this writing. They describe it as:
“MY World is a United Nations global survey for citizens. Working with partners, we aim to capture people’s voices, priorities and views, so world leaders can be informed as they begin the process of defining the next set of global goals to end poverty.”
The data collected so far is telling, at least about opinions surrounding global warming aka climate change. It is dead last in the list of concerns queried:
https://wattsupwiththat.files.wordpress.com/2015/07/un-poll-agw-dead-last.png?w=720&h=363
http://wattsupwiththat.com/2015/07/17/despite-the-urgency-of-paris-a-u-n-sponsored-global-poll-rates-climate-change-dead-last/
I guess only the fringers with the tin caps are still fretting over Arctic ice. The rest of the world has more common sense.
The MYI plots you used here do not show the Canadian arctic. This plot shows that region.
http://iceweb1.cis.ec.gc.ca/IceGraph/graphPage.xhtml?startWeek=0716&endSeason=2015&PNGurl=csod%3Fcharttype%3Dsdtt%26ssnsta%3D1971%26ssnend%3D2015%26histdtsta%3D0716%26histdtend%3D0716%26region%3Dncw%26nrmlsta%3D1981%26nrmlend%3D2010%26showwarn%3Dtrue%26plotnormal%3Dfalse%26plotmedian%3Dtrue%26plottrend%3Dfalse%26plotwarn%3Dtrue%26plotscaled%3Dfalse%26cachelife%3D0%26errorpage%3DerrorPage.jsp%26format%3Dcsod%26sizex%3D1100%26sizey%3D850&endWeek=0716&type=sdtt&startSeason=1971
Looks like the Canadian arctic has recovered MYI and total ice area to match 2002!
+1
my guess is that this scam has only a year or two left in it, then it will switch back to global cooling and the adjustments that have been made to raw data will be switched. The change will be necessary due to the previously unrealized effects of ozone or other supposedly human generated gas.
Combustion particulates will be said to cause cooling, and be just another excuse for asking to burn less fuel.
Decades of continuous planetary warming and now you prophesize global cooling? Lets see..
Raw data from reliable US stations, away from the urban heat island effect showed actual cooling from 1940-1979. Then warming from 1980-1998. After that, no change. So does one 18 year period of warming over the last 75 years represent “continuous planetary warming?” I think not. That notion is only based on “adjustments” by “scientists” who are trying to “prove” their own predetermined conclusion, obviously to keep the flow of grant money coming their way.
Most stations in the midwest (the midwest not being effected by marine influences) that have stayed rural, actually show no warming trend over more than a century. Some even recorded a slight cooling since the late 19th century. The data used to be available at a NASA web site that included photos of the staions and their sites, but oddly that data is now gone.
Pick a time period, and pick your trend. Pick a city, and pickup UHI.
There has NOT been decades of continual warming.
1920-1940 ish warming
1945-1970 ish cooling
1975-1998 slight warming culminating in the 1998 El Nino step ( all bought about by a series of strong solar cycles)
2001 – now.. pretty much flat as a tack.
So again, you show your brainwashed ignorance.
Since the culmination in 2001 of the large solar induce El Nino of 1998, ALL THREE temperature series that attempt to get an evenly spaced, unadjusted, non-UHI, non-airport data series show COOLING
RSS, UAH, and USCRN (since it was established in 2005) all COOLING !
ONLY the heavily mal-adjusted farce that is the NOAA/GISS/HadCrut group shows any warming and most of that warming comes from the NOAA Schmidt/Karl data fraud (which feeds into the other fabrications) since early-mid 2013 when Schmidt was assigned to create a warming trend out of nothing.
“Decades of continuous planetary warming…”
caused by strong solar cycles, C21, C22 and C23. Even the end of C20 was already quite strong, for a cycle minimum,
http://www.woodfortrees.org/graph/sidc-ssn/from:1956/to:2016/plot/best/from:1956/to:2016/trend
https://dmhscratch1.files.wordpress.com/2014/12/last-5cycles-wood4trees-trend.png
Iqaluit grocery shelves left bare as ice and fog hinder food shipments
A rare lingering fog and thick ice have caused majors delays in food shipments to Iqaluit, where store shelves that were bare for nearly a week are only now beginning to be restocked.
http://www.theglobeandmail.com/news/national/iqaluit-grocery-shelves-left-bare-as-ice-and-fog-hinder-food-shipments/article25543820/
Somewhat depressing video.
The Inuit have declined from being superb at surviving at the North Pole into being in heated homes on welfare eating alien food that is bad for them. Note how all the ‘starving’ Inuit are grossly overweight, mainly due to too much sugar plus not being outside much.
The same is happening to the Desert Tribes. They are also getting very obese while at the same time not going outside much anymore but staying indoors where it is air conditioned and this is making them extremely obese and in increasingly poor health.
Mark Steyn gave a great and very funny speech at the 10th International Conference on Climate Change, it is well worth the time. The last few minutes are Q&A and Mark brings us up to speed on the Mann lawsuit, something to which we should all pay close attention, as it is all about freedom of speech in the US.
http://www.c-span.org/video/?326526-1/mark-steyn-climate-change
When you say large increase in multi-year ice do you actually mean small increase in multiyear ice?
http://nsidc.org/arcticseaicenews/files/2014/04/Figure5.png
There was a large drop in 2007 due to the melting of that year, Since then a small increase in multiyear ice, but not up to the levels before 2007.
Andy
Andy,
Your plots are missing a year, it’s July 2015 now. Get the March 2015 data so that it matches the week 20 2015 plot for this post and then make the comparison. The trend has continued up. Even PIOMAS has 2015 volume this spring as greater then 2013 or 2014 because of the increase MYI and ice thickness.
Crashex
I will try to locate that, but I doubt it will be back to pre 2007 levels, as I said it is slowly rising.
It does not show the claim that since 1988 winds pushing ice out over winter lead to large summer melts as claimed. Look at 1999 !
Some education for you, .
https://vimeo.com/14366077
That’s education? Brave attempt at posting something worthwhile.
Pity you couldn’t attempt to understand it. !
Looks like the orginal statement is wrong , ie it is due to winter winds
http://www.bbc.co.uk/news/science-environment-33594654
“We found that the the highest correlation by far was with the melt season length – and over the summer of 2013, it was the coolest of the five years we have seen, and we believe that’s why there was more multi-year ice left at the end of summer
Yes, 2013 was the coolest for a while….
DMI recorded probably the shortest time above freezing of their whole record.
Same last year, a shorter time above freezing.
http://ocean.dmi.dk/arctic/meant80n.uk.php
So favourable winds for ice compaction AND colder for longer.
Of course Arctic sea ice is increasing, the Sun is sleeping after the series of strong solar peaks last century.