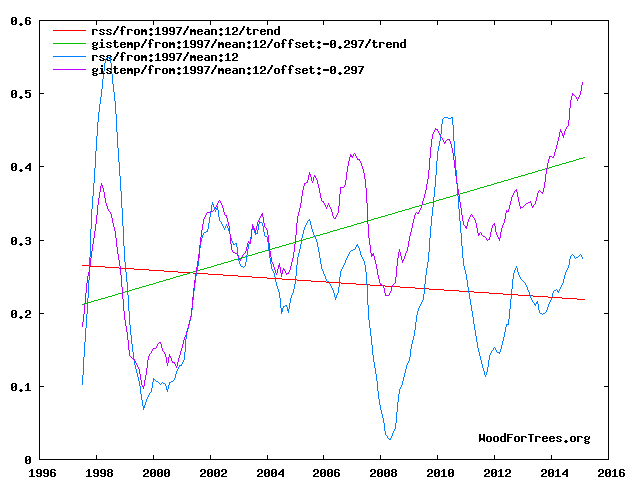
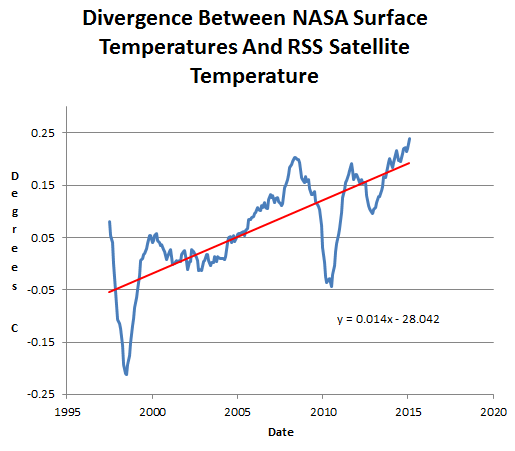
Satellites show that global temperatures have been falling for almost two decades, but this doesn’t suit NASA’s agenda – so they generate fake temperature data to create the appearance of warming.
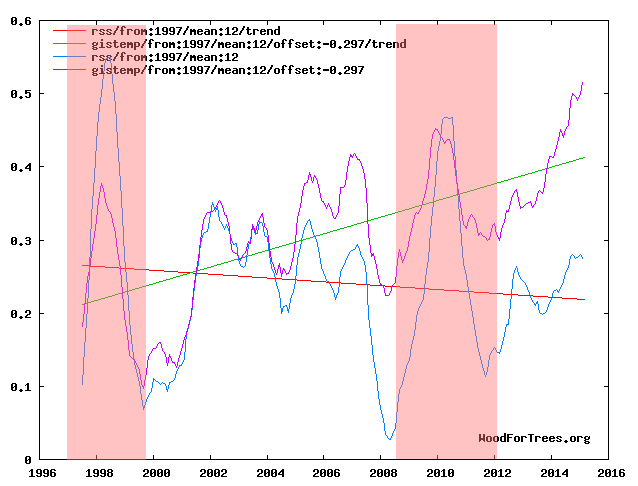
The divergence is spectacular, but particularly interesting is level of fraud going on during the current El Nino.
Global warming theory tells us that satellite temperatures should rise much more than surface temperatures during an El Nino – as occurred in 1998 and 2010. But this year, we don’t see that occurring. This is a smoking gun that Gavin and Tom have massively ramped up their fraud ahead of Paris.
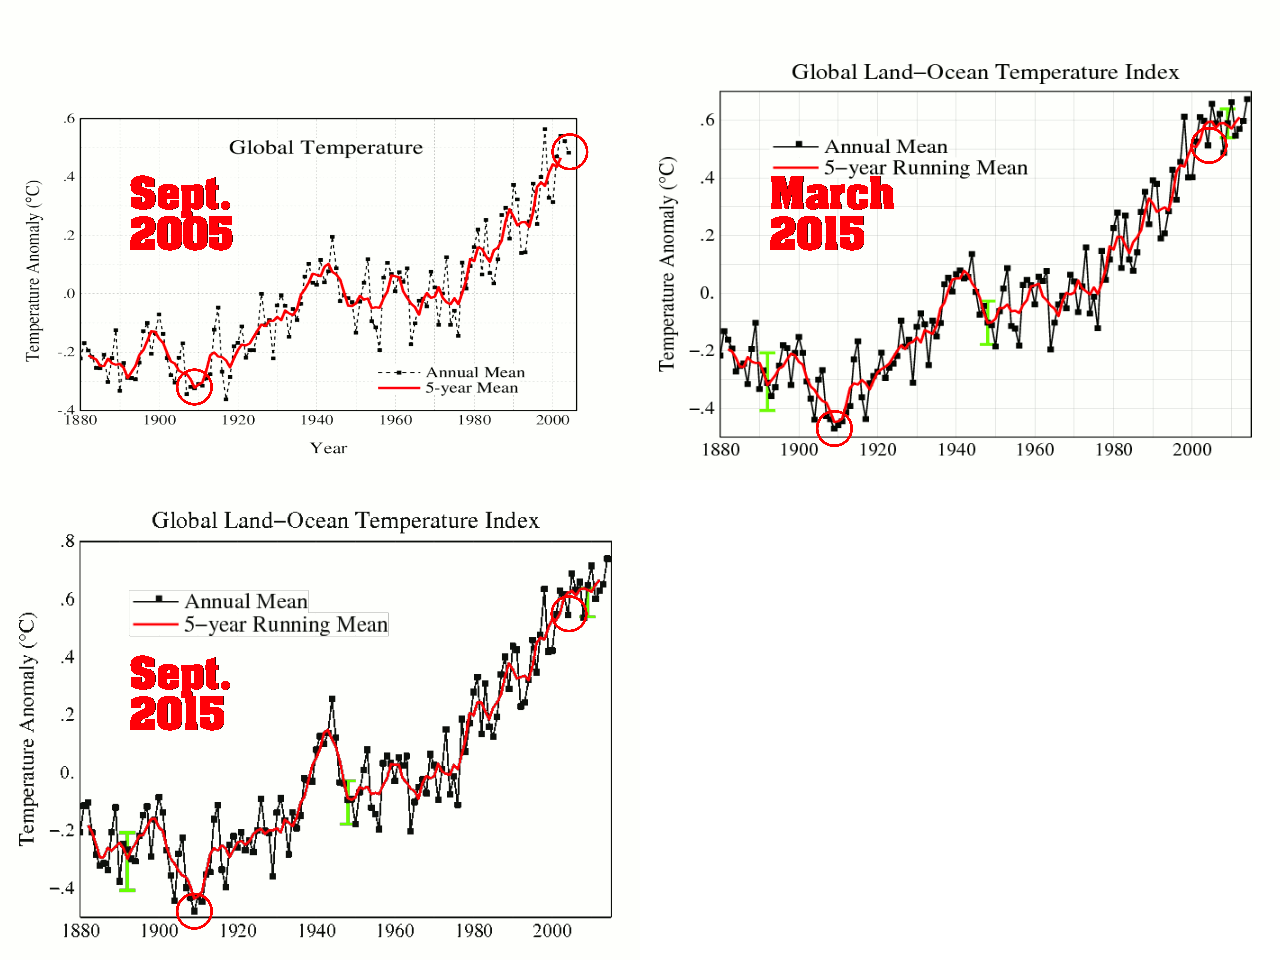
NASA is constantly tampering with data to make the past cooler and the present warmer. Over the past six months, Gavin has implemented yet another spectacular alteration of the data – to make the hiatus disappear.
Global warming is biggest fraud in science history, and your tax dollars are financing it – to assist Obama’s efforts to “make electricity prices skyrocket”
https://www.youtube.com/watch?v=HlTxGHn4sH4
Progressives are completely insane, and are hell bent on wrecking our civilization. Will you continue to assist them?


Obama was hoping for change. He’s hoping for change in climate.
Actually, I suspect he is hoping that there ISN’T a change in the climate
ie… That the inevitable COOLING doesn’t manifest itself too much before the Paris junket, and destroys his future in the UN !
Cooling is just evidence of warming, according to 97% of Obama’s henchmen.
Yuppers, That is why they changed from Gore Bull(sh…t) Warbling to ‘Climate Change’
A (Not Quite) Complete List Of Things Supposedly Caused By Global Warming
Great Post!
The satellite methodology is consistent and verified by weather balloons. The surface record is a FUBAR mess. The CAGW theory DEMANDS that the troposphere warms 1.5 times the rate of the surface. By ALL the physics of the IPCC, whatever is causing the supposed surface warming, CO2 has NOTHING TO DO WITH IT.
NASA actually put man on Antarctica!!! https://www.facebook.com/NasaOperationIcebridge?fref=ts
A while back there was a history of NASA by NASA explaining how NASA put lots of money into environmentalism. The reason is pretty obvious to me: environmentalism generates a whole host of demands for more “monitoring” of the earth … and so every time there is another scare, NASA get a huge trance of public money to monitor the scare that they largely created.
Of course, I doubt anyone at NASA actually has the brains to see it that way. They are just cogs in the wheel. Some will be encouraging the growth of end user academics, some will be encouraging the end users to publish research into issues needing more funding. Some will be publicising all the “research” showing that more NASA funding is needed. Individually they may just be a cog in the machinery – but the whole machinery is certainly fraudulent. It either directly or indirectly encourages others to manufactures false data in order to gain money.
The Alarmist keep telling us that the USA is not the world. However it sure looks like the USA is the main contributor to the ‘adjusted data’ Not all the tiny dots (meaning dropped stations)
https://upload.wikimedia.org/wikipedia/commons/thumb/a/ab/GHCN_Temperature_Stations.png/800px-GHCN_Temperature_Stations.png
In Africa Canada and Australia.
Steve has already covered the lack of stations in the interior of Africa. E.M. Smith covers The Bolivia Effect in South America.
Verity Jones covers the deceit at length. Here is her graph for the drop out of Canadian stations. Dark Black Diamonds are the stations now used. Notice only two stations above 60N, only ~seven above 56N and one of the many above 64N.
https://diggingintheclay.files.wordpress.com/2010/04/canada-bypopulation.png
Canada – Top of the Hockey League (Part 1)
https://diggingintheclay.files.wordpress.com/2010/04/canadadt.png
Do not forget the Russians complained about CRU dropping their long running rural stations in favor of short term cities showing UHI.
And the Climate fraud is just one of the minor frauds and crimes committed by these criminals.
How did government fraud make arctic sea ice, ice sheets, mountain glaciers and permafrost melt so much since 1997?
They started in 1997?
http://www.hyzercreek.com/glacierbaymap.gif
The same way government fraud caused an inverse relationship and Antarctic ice sheet growth, mountain glaciers and expansion of permafrost so much in the Southern Hemisphere since 1997. http://www.climate4you.com/images/NSIDC%20NHandSHandTOTALiceExtension12monthRunningAverage.gif
On balance, no, the ice on this planet didn’t melt “so much” since 1997.
http://www.climate4you.com/images/NSIDC%20GlobalSeaIceAreaSince2000.gif
The fraud is about shaving and adding temps that didn’t exist, starting datasets near the bottom of temperature troughs or at the height of ice accumulation, purposefully, to create false trends.
AHHHhhh, yes cherry pick a VERY short time span that is far less than a full 88 year cycle and point to the ‘warming’ up swing of the cycle.
When you look at CLIMATE, not weather you see a different story.
The climate flipped around 1850 around eleven years after the sunspot cycle want from moribund to very active as predicted by Dr. Evans Notch-Delay Solar theory.
No SUVs around in 1850 were there?
Norway is experiencing the Greatest Glacial Activity in the past 1,000 years.
There is a nice study in Quaternary Research that did a study on glacial activity in Norway for the past ~8,000 years. That is during the Holocene.
The authors state that most glaciers likely didn’t exist 6,000 years ago, and the highest period of the glacial activity has been in the past 600 years.….
Top-Down Solar Modulation of Climate: evidence for centennial-scale change
New Insights into North European and North Atlantic Surface Pressure Variability, Storminess, and Related Climatic Change since 1830
Spatial and temporal oxygen isotope variability in northern Greenland – implications for a new climate record over the past millennium
Figure 10
https://i1.wp.com/snowhare.com/climate/charts/doi-10.5194_cpd-11-2341-2015-figure-10.png
The middle graph covers 1000 AD through 1960 AD with a 40 year average.
At no time during the last thousand years has it dipped as low as it has been since 1979. It never even came close.
The ClimAstrologists have to deny history. Here is the history lesson.
A seminal event for the season of popularity of global cooling was Stephen Schneider’s 1971 paper published in Science warning of a coming anthropogenic ice age entitled “Atmospheric Carbon Dioxide and Aerosols: Effects of Large Increases on Global Climate.”
Come on cfgjd.
Do your due diligence in studying each issue.
Yes, Glaciers have been melting since the industrial
revolution, but there was no increase in rate since the heart of the little ice age
long before.
Arctic sea ice has been cyclic, Enormous amounts of articles and events
verify all this.
But since you like to challenge (which is good) I will throw a challenge to you.
Can you explain why the following events, according to science occurred?
12,000 years ago the Laurentide ice sheet (glacier) covered almost all of Canada
and much of northern United States. .Later it melted, and the great lake Agassiz was formed; a lake larger than the sum of the area of the five Great Lakes.
Much of it drained through the Great River Warren which was miles wide, Now the
comparatively tiny Minnesota River flows in its basin. That change caused a tremendous oceanic rise.
So, what were the reasons for that huge climate change? I am sure even you will have to admit that the purported 0.65 degree C. change is small compared to the change associated with that great melt.
Of course going back millions of years, there must have been a tropical environment on the north shore of Alaska, or there would not be oil reserves there. The great Gorical, code name Al tried to associate the temperature changes as being caused by changes in CO2 concentration, but in fact the temperature change led the change in atmospheric CO2 concentration.
Incidentally I calculated for myself, what the change in CO2 concentration would be with a 0.65 C change and it was only an increase of about 5%. If anybody was interested, I would show it here. It is about a two pages process because there are several compounds and chemical laws. present. ,
He also might need to stop the kool-aide drinking. From info about Obama’s trip to Alaska.
http://touch.latimes.com/#section/-1/article/p2p-84333175/
But –
Unlike many glacial terrains where cooling trends reduce summer melting, bringing on glacial advances, the Kenai Fjords glaciers move forward when warmer weather brings moisture-laden storms to the coast. Air is rapidly forced over the abrupt mountains and drops copious snowfall onto the Harding Icefield.
http://www.nps.gov/akso/nature/science/ak_park_science/PDF/2004Vol3-1/Ecological-Overview-of-Kenai-Fjords-National-Park.pdf
So if there is less ice, is Resident Obama now confirming it is getting cooler?
On the “unprecedented rate”, since when?
Changes in magnetic susceptibility (MS), organic-matter content (OM), and biogenic silica (BSi), record environmental changes since ~9500 BP. Goat Lake is situated ~450 m north of a drainage divide at ~70 m above lake level that separates the lake basin from the Harding Icefield (HIF) outlet glacier. Sediment analyses focused on the last 1000 yr; this interval includes a sharp transition from gyttja to overlying inorganic mud at ~1660 AD, which marks the first time since the Pleistocene deglaciation that the North Goat Outlet Glacier (NGO) of the HIF overtopped the drainage divide to spill meltwater into Goat Lake. One 14C age of ~1470 AD from a subfossil log buried by till in the NGO valley requires ~145 yr for the outlet glacier to have thickened 150 m to the elevation of the drainage divide where it remained until ~1890 AD. Since ~1890, the NGO has thinned 150 m and retreated 1.4 km, back to where it was in 1470 AD.
https://nau.edu/uploadedFiles/Academic/CEFNS/NatSci/SESES/Forms/Daigle_2006.pdf
Current glacier positions last seen in 1470. Yep unprecedented.
See also – Calkin Wiles 1992
A recent study on some glaciers around Mt baker came up with the following graph (similar pattern for all glaciers in the region)
https://wattsupwiththat.files.wordpress.com/2015/09/clip_image004.png
We can see exactly why the climate fraudsters want to start their trends in around 1979. 😉
darrylb,
It depends on your time frame. Overall the temperatures of the Holocene are cooling with some ups and downs along the way.
It ‘warmed up’ to modern temperatures in the decade around 1850 but it is still cooler than most of the Holocene.
GREENLAND ICECORE
http://i.snag.gy/BztF1.jpg
SARGASSO ( middle of the North Atlantic Ocean)
http://www.john-daly.com/hockey/sargasso.gif
Arctic culture that thrived 1000 years before the Vikings;
From the Eskimo Times Monday, Mar. 17, 1941
The Academy of science report of the same year regarding the Ipiutak culture described above
http://www.pubmedcentral.nih.gov/articlerender.fcgi?artid=1078291
Another paper:
Temperature and precipitation history of the Arctic
We no longer accept satellite data and there also has been a big reduction of actual weather stations in remote areas. Kind of makes it easy for alarmists to create their own “reality” with their red and brown crayons in hand. Thus nothing they say is the least bit credible.
Also, billions spent climate “research” but we can’t spend a few dollars to maintain good temperature records? We do spend millions to send up satellites, but then ignore them as well, when their readings depart from their agenda? What does all this tell you?
FIRE THE SOBs!
Gail, since you might be the only one interested here, read my note from above.
Also, I will have to state my own little bit of irony here. Today is my birthday, also today marks the anniversary of the Mayflower beginning its voyage under the command of Miles Standish. Also, I am a decendent of Miles Standish (as are probably millions of other people–several of them, including three presidents important. some of us not)
The Mayflower? You mean the 107th ship that came to North America (Virginia had 2000 settlers by then, Santa Fe New Mexico was settled, and Albany NY was already 6 years old by then and full of Dutch fur traders.).
My birthday is in a couple weeks. My Mom’s sister traced us back to Alexander Hamilton at which point my Mom and her brother had lots of fun pointing out he was illegitimate.
Comeon Morgan, don’t steal my thunder!!!
I have to have something to feel important 🙂
I know why leftist media twits are nuts but I really never have understood why Artsy types so often are already off the deep end. http://newsbusters.org/blogs/nb/scott-whitlock/2015/09/16/james-cameron-climate-denialists-right-wont-face-globes-biggest
https://stevengoddard.wordpress.com/2015/09/15/us-summers-were-much-hotter-and-drier-prior-to-1960/#comment-541025
Steven, please rebut this one form Science Daily. “Arctic sea ice summertime minimum is fourth lowest on record”, if you haven’t already done so. http://www.sciencedaily.com/releases/2015/09/150915211529.htm
And apart from the 1997-2001 events, there has been NO WARMING IN THE WHOLE SATELLITE DATA
That absolutely no CO2 warming signature in 36 or so years.
This ANTI-CO2 hysteria has to stop.
Reblogged this on Climate Collections.
Reblogged this on Climatism.