Yesterday I showed how NASA has doubled their own reported global warming since 1999
1999 Figure 1: Global annual-mean surface air temperature change based on the meteorological station network.
2015 Version: traditional analysis using only meteorological station data
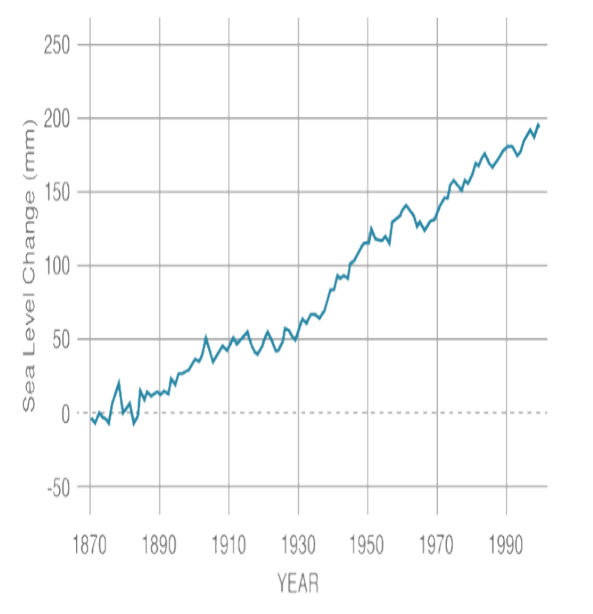
That is pretty spectacular fraud, and they have done exactly the same thing with their sea level data since 1982. NASA currently shows 16 cm of sea level rise from 1880 to 1980, and no change in rates over time
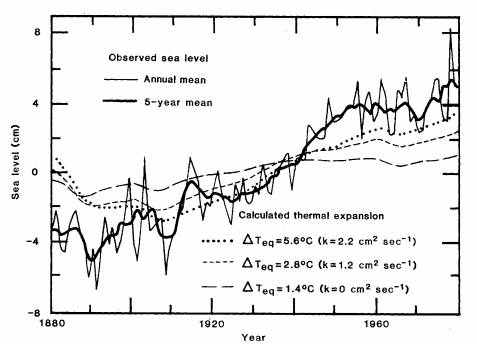
But in 1982, NASA only showed 8 cm of sea level rise from 1880 to 1980, and a sharp flattening to almost zero after 1950.
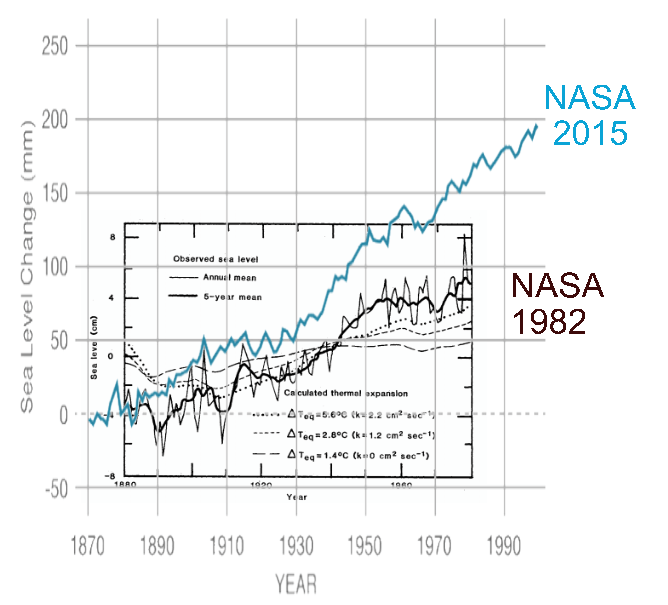
The next graph is an overlay of the two above, normalized to 1880.
NASA’s current graph looks nothing like their 1982 graph, doubling sea level rise. Exactly the same thing they have done with temperature rise.


They have to do clever but unnecessary meta-analyses in order to contrive an acceleration in sea level rise. We already have tide gauges that have been operating for over a century, and they show no acceleration. You don’t need to look any further than that.
Global cooling requires ever increasing warm biased adjustments.
Apparently Scientists 30 years ago couldn’t read a thermometer. Seriously how is it possible that the data was that far off.
The homogenization of temperature was absolutely far fetched. But, how in the world is it even possible to modify sea level data?
I know there is a 10% add-on, due to a perceived rebound of land, but not like this!
Amazing.
Tony if the temperature rises the sea level must rise by a commensurate amount. If you are going to lie at least cover all your bases.
Global temperatures were declining in the 1970s. Yet their graph shows an upward spike in sea level during the 70s.
That was about NASA.
It is just that they did not know how to measure things in the old days. Like the old days of 2005-2013.
Reblogged this on Roald j. Larsen.
consistancy is more important than accuracy, see here http://ceres.larc.nasa.gov/documents/STM/2015-05/34_Intro_to_Invited_Presentations.pdf
Have they altered the individual tide gages?
Are those tide gage time series’ “modeled” or adjusted?
They do say they are normalized something or other.
Have they used this normalization process to change them as in the above examples?
Is it worse than we thought?
The tide gauge record at the Permanent Service forMean Sea Level has not been altered. I check it every now and then against data that I retrieved from there in 2009.
But you asked if they [NASA] altered individual tide gauges. Wow, that would really be some in your face fraud if they did.
BUT if you are interested in sea level data that has been changed, look no further than Colorado University’s Sea Level Research Group. Every time they publish a new release they change the data. Over the last ten years they’ve bumped the rate of sea level rise up around 0.9 mm/yr.
This one works better http://s1039.photobucket.com/user/Knownuthing/media/Solar%20cycles2_zps1va5vqbt.png.html
There is a terrible correlation between NASA and NAZI propaganda & it’s more than just being a four letter acronym (a) If you tell a lie big enough and keep repeating it, people will eventually come to believe it. (b) Power tends to corrupt, and absolute power corrupts absolutely.
Go to the beach, and you can see that it’s exactly the same as it was decades ago.
Go outside, and you can feel that it’s the same as it was decades ago.
The whole
global warming“climate change” scam is a joke.Everything has to match up or you’ll be found out. Can’t have the thermosteric rise in sea level not matching the temperature, can we?
You would think they would start deleting those old papers off their website.
NASA has a great deal at stake, namely their reputation as the government space agency that misrepresented Earth’s heat source to the public over the entire existence of NASA.
See data and observations NASA ignored in “Solar energy” (17 March 2015) https://dl.dropboxusercontent.com/u/10640850/Solar_Energy.pdf