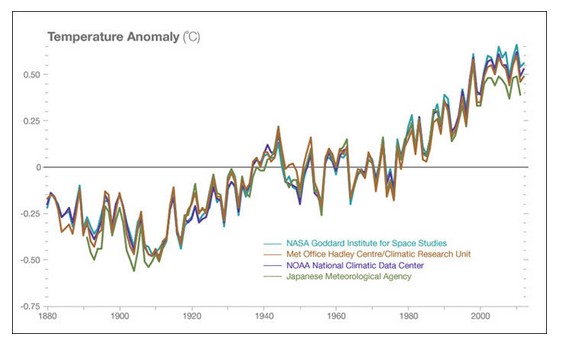
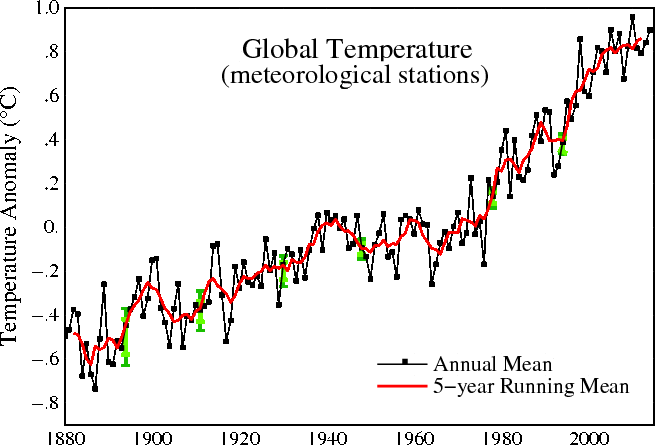
NASA uses this graph to “prove” that global warming is real. It shows the close agreement between NASA, NOAA, CRU and the Japan Space Agency.
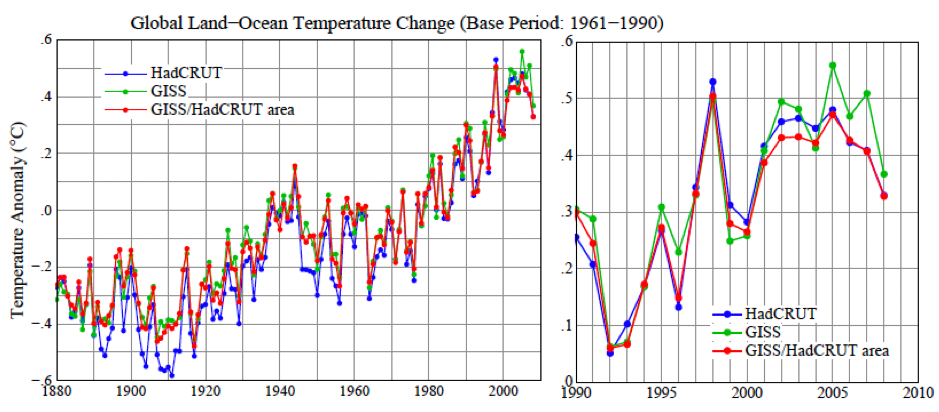
But six years ago, James Hansen was upset that they didn’t agree, and that there was no warming after the hottest year of 1998. Trenberth was also upset about the lack of warming. He called it a travesty.
If It’s That Warm, How Come It’s So Damned Cold?
by James Hansen, Reto Ruedy, Makiko Sato, and Ken LoFigure 4. Global surface temperature anomalies relative to 1961?1990 base period
So what did these government criminals do? They all changed their data in unison, and simultaneously made the post 1998 hiatus disappear.
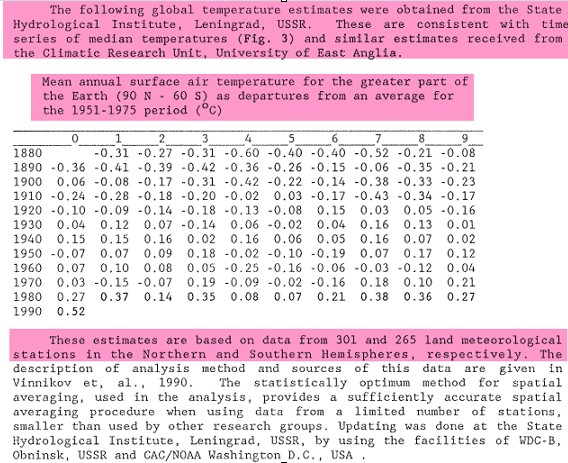
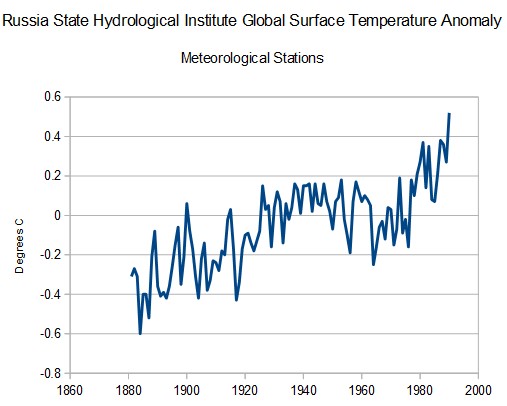
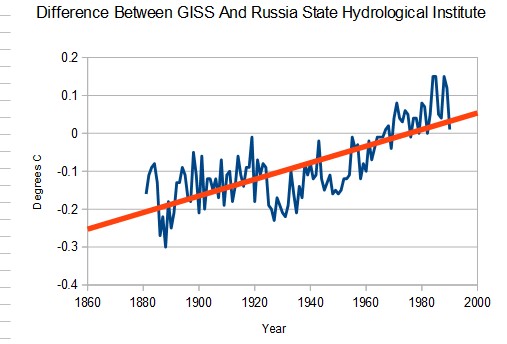
In 1990, NOAA published these global temperature numbers from the Russia State Hydrological Institute, and said they were consistent with CRU.
The numbers showed about 0.6°C warming from 1880 to 1980, and 0.2°C cooling from 1940 to 1970.
NASA now shows about 0.9°C warning from 1880 to 1980, and no cooling after 1940.
The graph below shows the difference between the NASA data and the Russian data.
These government agencies are blatantly colluding and data tampering in unison, and then claiming to be independent after they do their dirty deeds.




“Nog nooit eerder is zo vroeg in het jaar al zo’n lage maximumtemperatuur gemeten als woensdag in Maastricht.”
(Never before so early in the year such a low maximum temperature has been measured as Wednesday in Maastricht.)
http://www.telegraaf.nl/teleweer/24614794/__Niet_eerder_zo_koud_op_14_oktober__.html
Today it will not rise above 2ºC in Maastricht.
Every idoit knows that todays cold is not our grandfather’s cold. His cold was real cold. Cold that was created by cold. Leading climate scientists all say that today’s cold is different, results from jetstream disruption, which is obviously a result of Mann-made global warming.
Only a huge carbon tax, plus an extensive crap and trade flim flam scheme will ever allow cold to be real cold again. Isn’t that what you want for your children and grandchildren?
Fraud and collusion between government agencies are probably implemented in the annual review of their budgets for Congress by the National Academy of Sciences.
NSF, DOE, NASA, EPA, NOAA, etc., have collectively destroyed the integrity of Climatology, Cosmology, Nuclear, Particle, Planetary, Solar and Theoretical
Physics.
That’s a good thought, Steve… I doubt the change was simultaneous. If one could find the historical sequence of when each agency updated their previous charts, it could indicate a sequence / timeline of collusion. I find it striking that each agency correlates so well also. I don’t think anyone has any illusions that the agencies are independent or use independent data, but it seems to me they are entirely dependent on the same data and processing. In other words, they are all making the same mistakes. I find it unbelieveable that any scientists would independently make the same assumptions / data treatment, and result in such replicable results, even using the same data. If they were even remotely independent, there is zero chance of that good a match. I’m thinking GISS sends the results to everyone, and each adds some random noise and pubishes the results as independent.
This gun went off: Free Speech canceled in France: http://www.telegraph.co.uk/news/worldnews/europe/france/11931645/Frances-top-weatherman-sparks-storm-over-book-questioning-climate-change.html
Tony, some person called Leftwithrightbrain is going around on blogs saying you had to write letters of apology to NASA, GISS and NOAA for criticizing their data and admitting you were wrong to avoid libel suit. I called him a bald-face liar since you slam their data, daily. He also claimed to be a published climate scientist.
It surreal to hear people like O, I can’t even write his name, say the weather is the biggest threat to the world. Why these fools aren’t laughed into oblivion sure beats me and how they can hold a summit and discuss this with a straight face is downright frightening.
“Leftwithrightbrain”? Who would take a person with a screen name like that seriously?
“Ih8denier5” does.
should rename himself, “leftiewithnobrain”
I checked using WFTs, and both the GISS and HASDCRUT data shown on the left in http://realclimatescience.com/wp-content/uploads/2015/10/Hansen09_fig4.jpg , the 1990-2009 close up, is the same, in regards to the trend. The GISS has been slightly raised, but all of it is higher. there seems to be no change of the relative values. Can somebody check this?
That should have been “on the right hand side”.
Oh well. Sometimes the facts just don’t matter.