
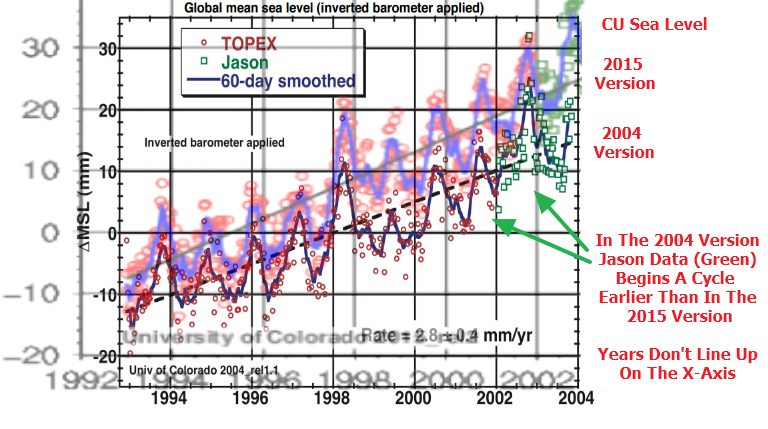
2004 version: sl_cu2004_rel1.2.pdf 2015 version: 2015_rel2
Based on comments yesterday, I am not sure that everyone recognized the gravity of this CU sea level disaster. Not only don’t the years line up on the X-Axis between the two versions, but in the 2004 version the Jason data begins an annual cycle earlier than in the 2015 version.
I have tried to figure out what sort of error could lead to this type of mess, and can’t fathom how it could have happened. It looks like they are just making data up.

The courage of government scientists to lie or make up data has increased over time.
1. Lies were beyond comprehension in 1969 when the Apollo Mission to the Moon returned with lunar dirt in which solar-wind-implanted light mass xenon isotopes were systematically enriched by 3.5% per mass unit over twelve mass units, from 124 amu to 136 amu.
2. That finding and others allowed us in SEPT 1983 to confidently state the interior of the Sun is mostly iron and to predict the Galileo Mission would find “strange xenon” in Jupiter. The Galileo probe entered Jupiter’s atmosphere in DEC 1995, observed evidence of “strange xenon,” and hid the data from the public until publicly confronted while being video-recorded by CSPAN News in 1998.
3. In MAR 2001 at the Lunar Science Conference we explained how NEUTRON REPULSION in the Sun’s pulsar core explained solar energy and solved the “Solar neutrino puzzle.” Within three months, one hundred and seventy-eight (178) “scientists” at the Sudbury Neutrino Observatory reported in Phys Rev Letters that they had just discovered solar neutrinos magically oscillate away before reaching neutrino detectors here on Earth!
Unfortunately, experimental data from government scientists are no longer trustworthy.
That has nothing to do with this topic. I am going to start blocking spam.
The corruption of science that you have documented so well in climatology, Steven (aka Tony), is simply one of many confirmations that post-modern science is used to deceive – rather than to inform – the public. That is what George Orwell predicted in the book he started writing in 1946: “Nineteen Eighty-Four”
I think manipulating data by “scientists” is totally the topic of this thread. You should say, “Sorry”.
Thank you, Virginia, for sage advice. “Sorry!
Thanks, Omanuel, but it was Goddard’s remark I thought was out of line.
Virginia, you may want to ask yourself these questions:
1. Which of Steven Goddard’s climate science posts is not about manipulating data by “scientists”?
2. Why do all of Steven Goddard’s inkblots look to Oliver like iron core Sun?
3. Is it spam to post the same comment every time a post on a new subject appears here?
Peter Ellis put out a thesis with far-reaching consequences for the understanding of published climate science.
The graphs of climate scientists are inconsequential images and should not be trusted. It’s reasonable to treat them as display errors and not attribute any meaning to them. If I understand Peter right, the scientists are to be considered mere data collectors and their interpretations and conclusions are worthless.
Everybody has to download their text files and work out the results himself. I just hope Peter contacted the scientists to make sure they know they are also not qualified to screw with the original data since they don’t seem to understand it much.