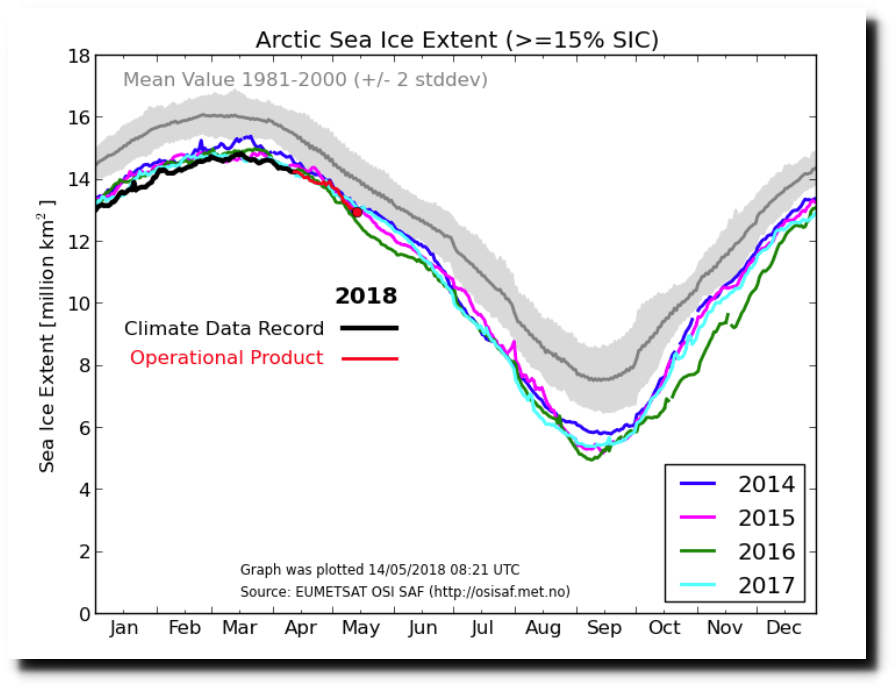
DMI continues to show Arctic sea ice extent dropping rapidly and down 10% since May 1.
Ocean and Ice Services | Danmarks Meteorologiske Institut
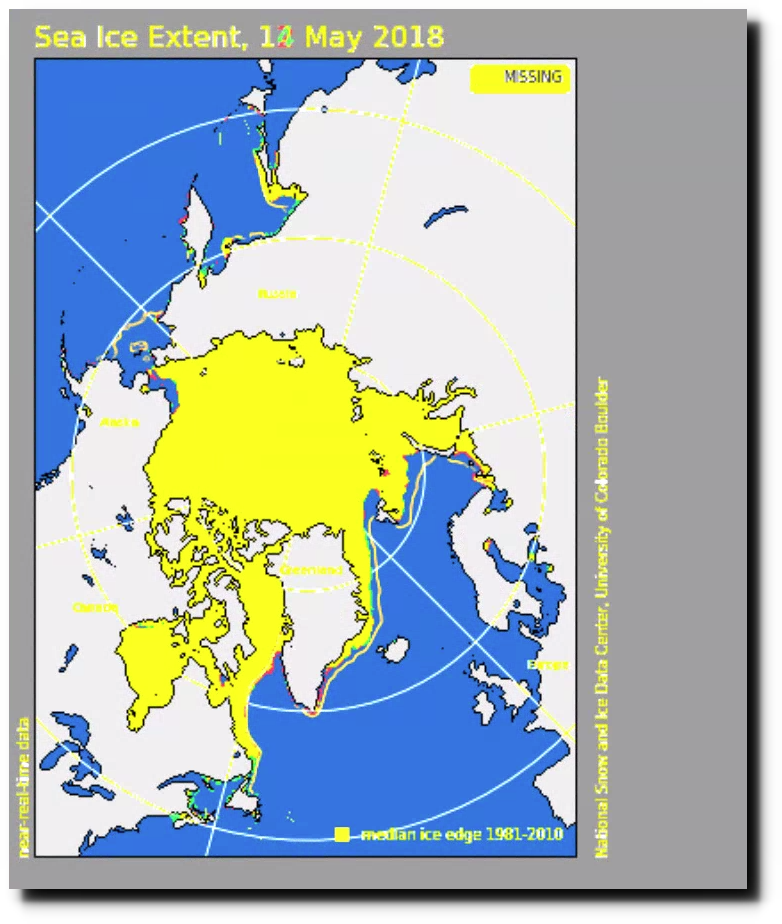
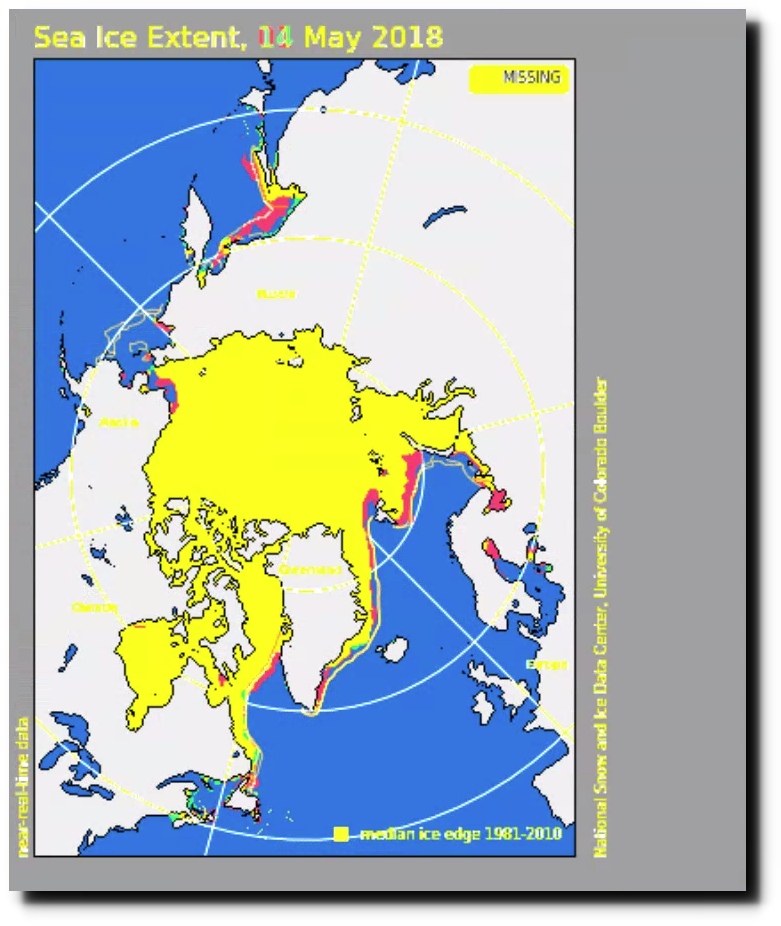
There has been no change in extent over the past two days. Red shows ice loss since May 12, green shows ice gain.
The total ice extent loss in May has been 4%, almost all of which occurred during the first few days of the month.
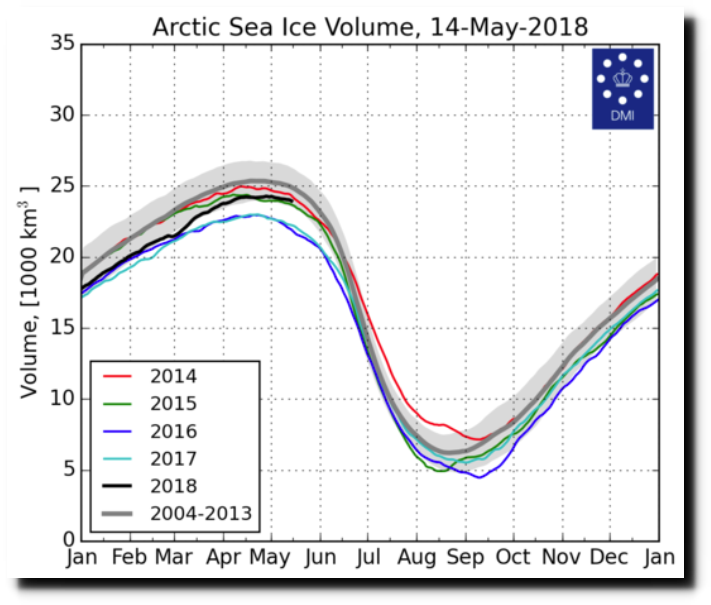
The DMI ice volume graph is more credible than their extent graph. It correctly shows that there is almost no melting occurring in the Arctic.
comparing apples and pears again…
Are you quite sure the 2 sets of data are on the same basis?
I should think there’s enough difference just in the relative timings to throw you out…
http://nsidc.org/arcticseaicenews/
Says:
Sea ice data updated daily, with one-day lag
and has a link
Learn about update delays and other problems which occasionally occur in near-real-time data.
On this it says:
‘sea ice plotted at
http://ocean.dmi.dk/arctic/icecover.uk.php
and you need to look up the supporting data/validation pages too to see its basis.
why on earth are you posting this stuff?
Your hair splitting is only exceeded by your bias. See the big picture.
Hair splitting? Is Ms Griff suffering from a headache?
I post “stuff like this” hopefully to educate even the most hopeless true believer in the junk climate religion.
Hi Tony,
I know you are busy, but maybe a page on this blog for “beginners” would be worthwhile? Nothing elaborate, just 5 or 10 links to articles and videos like: Lindzen, “Climate science designed to answer questions”, the Forbes piece “in their own words”, the WSJ video about “government twisting Climate Statistics”, Willie Soon videoon censorship, etc. I seem to reference these articles a lot and they are in pretty obscure places and having them all on a one page primer would have helped me out a lot in the beginning. I feel I am pretty up to speed on this stuff, but I bet there are many more out there. Possibly the commenters here have seen them and know where they are. Anyway, just an idea… as playing wacka-mole with types like Griff and Scott Koontz is trying and a newbie coming here for the first time can get lost in the minutia and idiocy. Anyway, just an idea…
Willie Soon was, I believe, caught red handed offering to deliver the research results his sponsors wanted…?
/ I believe & ? /
We can hear from Willie Soon himself about those charges:
The Big Bad Forces of Censorship and Intimidation in Climate Science. Willie Soon, PhD: Harvard-Smithsonian Center for Astrophysics – Harvard University
https://www.youtube.com/watch?v=aYAy871w9t8
You be the judge.
You believe?
I know your sort of belief.
Willie Soon is honorable and a real stickler for the truth. His papers are so well written that they often do a better job of explaining the ideas of people who disagree with him than his opponants can As they disagree. Apparently clarity of mind
is easier when you are honest.
It may be true that Willie Soon did require a sponcer to fund his research, but it was all done on the level. His good name was besmirched by the foul crew who are threatened by honesty, and who seem to marginalize and discredit any who threaten their corrupt gravy train with Truth. Fortunately Willie is tough and withstood the smear campaign.
The fact you bring up this failed smear campaign does far more to discredit the name “Griff” than anyone else. But I suppose honor means nothing to you.
Ms Griff, you are an insufferable lying harpy and you know it.
What a fool believes…
In what? In invalid data comparisons?
your methodology gives an apparent difference between two completely different data sets and frankly the resolution on the map is such that you are almost bound to lose pixels.
and from this bodged comparison you escalate to some allegation of fraud?
In any year the ice declines in May at about the rate I see in the current charts… what world spanning conspiracy do you think you’ve uncovered in a 2% discrepancy based on invalid data and invalid technique??
Poor griff, too blind to let himself see.
And PANICKING anyway.
As the song says, Griffy hears what he wants to hear and disregards the rest. There is plenty of contrary evidence out there that he selectively tunes out. If you want to shoot fish in a barrel, we can always talk about how much summers in the US have cooled since the 1930’s. I’m sure Griffy can even find alarmist lies to even refute something as obvious as that, but actual data taken at actual stations with actual thermometers say that it has cooled a lot.
Like an entire week in Saginaw, MI in July 1936, where the average high temperature was 106.4 degrees, with a peak of 111 degrees. If Griffy and his alarmist buddies can start their charts during a record cold year (1979), we should be able to start ours in 1936. If we did the summer temperatures in much of the US would show a huge drop! Of course, Griffy will say that huge cooling is entirely consistent with huge warming. Yes, Griffy. Anything you say Griffy!
It took me 3 days to hitch hike to Saginaw…
…and only one second to be the first post again
/why on earth are you posting this stuff?/
Probably because your sources are dishonest and unethical Griff:
How Government Twists Climate Statistics
Former (Obama) Energy Department Undersecretary Steven Koonin on how bureaucrats spin scientific data.
https://www.wsj.com/video/opinion-journal-how-government-twists-climate-statistics/80027CBC-2C36-4930-AB0B-9C3344B6E199.html
That said, when I began to question AGW, one of the things that made my task much easier was comment sections like this. Someone like Griff would spout off the usual MSM talking points and another poster would come in with a post that would take me to something I really needed to see.
Here is another one:
Four Questions on Climate Change
Garth W. Paltridge DSc FAA – an atmospheric physicist and was a chief research scientist with the CSIRO Division of Atmospheric Research before his appointment in 1990 to the University of Tasmania as Director of the Institute of Antarctic and Southern Ocean Studies and (in 1992) as CEO of the Antarctic Cooperative Research Centre. He is currently Emeritus Professor at the University of Tasmania and a Visiting Fellow at the Australian National University. He is best known internationally for his work on atmospheric radiation and the theoretical basis of climate. He is a fellow of the Australian Academy of Science and a member of the Academic Advisory Council of the GWPF.
https://www.thegwpf.org/content/uploads/2018/05/Paltridge2018.pdf
Griff is actually correct for once and has turned me around.
Yesterday , I though the graph was correct, or maybe the map.
Today (thanks Griff) I think the map is correct….or maybe the graph
By using my hynoptic powers I will then convince you the graph is right…
In fact they are BOTH right.
But different data sets.
You have obviously hypnotised yourself into a state of brain-numbed idiocy, that you can never wake up from.
I’m not sure what his gripe is, because in the end there will be pretty accurate monthly comparisons. Watching days is stupid.
Tony would certainly be touting the cherry-picked results if the specific days showed what he wanted them to show, but what is missing is the facts that Arctic sea ice is melting. This causes a lot of people who want it to increase some serious angst.
The people who want to have more ice can’t be Canadian or from Norway or Sweden.
Even some shipping routes would become much shorter saving a lot of fuel and time making it a lot cheaper.
“but what is missing is the facts that Arctic sea ice is melting”
Always does coming into summer.
DMI shows ZERO TREND in volume over that last 10 years, just as a normal person would expect from the phase of the AMO.
“This causes a lot of people who want it to increase some serious angst.”
Why would ANYONE want it to increase ????
Its already way above “normal” for the last 10,000 years, only a fraction down from the EXTREME highs of the Little Ice Age Anomaly. Still in the top 10% of Holocene extents.
Less sea ice would be an absolute blessing to all those who live up there. Fishing, travel commerce etc etc would be come viable for more than a tiny short period each year.
The issue is the MORONS that what to use the natural decline of Arctic sea ice to more reasonable levels, as some sort of crutch to support their failing AGW religion… while at the same time DENYING the fact that sea ice level are currently still very high. way above those of the MWP, RWP and the first 9000 years of the current interglacial.
Russians are also active in the Arctic.
Weekly: http://www.aari.ru/odata/_d0015.php?lang=1&mod=0
OT but the sun is once again quiet.
http://sidc.oma.be/
I’m glad I’m around to witness and observe during a time like this. Cycle 24 was the weakest in nearly 100 years. So I suspect nobody posting here has ever witnessed old Sol taking break.
Let the Sunshine In
https://youtu.be/fhNrqc6yvTU
Some more fairy-tale nonsense on this page. CO2 is the main drive on the climate and those guys are braindead believing it.
The rest of the climate joke.
And as a result energy prices will skyrocket.
https://www.telegraaf.nl/financieel/2043617/prijs-elektriciteit-en-gas-loopt-fors-op
“De elektriciteits- en gasrekening kan fors gaan oplopen. De stijgende prijzen voor olie, kolen en CO2-uitstoot zorgen voor sterk stijgende tarieven voor elektriciteit en gas op de termijnmarkt.”
We dont pay enough do we? Why dont they tax kilauea?
With so much ice supposedly gone except from the nothernmost reaches, one would expect regular cargo vessels on the northwest passage, yet we do not see that. I wonder why.
But being far from the pole doesn’t ensure you won’t get trapped in ice.
https://www.shipwrecklog.com/log/2018/04/21/
” On April 20, the 132 meter long, 4700 dwt tanker Inzhener Nazarov became stuck in the ice on the Volga River in the Saratov Reservoir, Russia.” “it became stuck in heavy ice.”
https://www.shipwrecklog.com/log/2018/04/kaye-e-barker-2/
“The 767 foot long, 25345 dwt self-unloading bulk carrier Kaye E. Barker became stranded in ice on Lake Superior near Picnic Rocks. ” “became stuck in thick ice”
And opposite everything the alarmists predicted, Great Lakes water levels are on the rise.
http://www.boatnerd.com/news/news14.htm
There doesn’t seem to be the commercial demand for it.
There is increasing traffic on the Northern Sea route: not only is this open longer but the ice that does remain/the ice in winter is thinner, allowing the use of icebreakers and the new LNG carriers (they have propellers which chew through ice) to operate longer and further north.
since the shipping demand is out of china and to/from russian gas/oil operations, there is a greater commercial demand along the NSR.
“the ice in winter is thinner”
RUBBISH !!
It now takes massive ice breakers, and huge specially built ice munching LPG ice-breaker class transports.
Viking had no problem back in the MWP though.
Imagine the huge cost savings if the Arctic sea ice dropped back down to pre-LIA levels, and those ice-breakers and specially designed transports were not needed
Why do you HATE the people living up there SO MUCH that you think they should live in a perpetual Little Ice Age ???
yes, we’d save a whole bunch on shipping costs. The Russians and Chinese already are in fact. It is up to you whether that’s sufficient offset for other, bad, climate impacts.
the point is it now takes LESS ice breaker effort and the season is longer and the routes more direct because there is less ice.
the whole Russian and Chinese govt strategy is based around declining ice levels…
” other, bad, climate impacts.”
What fantasy would that be, griff?
The benefits of a more “normal” Arctic sea ice level would be a HUGE plus to all people living up there.
So, the strategy of building bigger, more powerful ice breakers and huge ice-breaking transport ships is “based around declining ice levels…”
your cognitive dissonance is quite bizarre !!
“because there is less ice. “
BS again
There is more ice than there was a decade ago.
Current volume is ABOVE that of 2016, 2017, 2012, 2011, 2015, and 2013.
You are LYING again, griff.
“the point is it now takes LESS ice breaker effort and the season is longer and the routes more direct because there is less ice.
the whole Russian and Chinese govt strategy is based around declining ice levels”
Griff, Russia has just launched two twin reactor-electric (60MW-81,000hp) ice breakers measuring close to 370ft capable of crushing through ten feet of ice. There is currently a third being built.
Now if there is declining ice and it now takes LESS ice breaker effort, why on earth are planning to build a bigger one! They are now laying down plans for a 110MW ice-breaker capable of breaking through fifteen feet of ice!
Because Bruce the ice allows those icebreakers to cut through further north, reducing distance (great circle routing) and for longer into the winter.
In the past the ice was that much thicker that even the icebreakers wouldn’t make progress enough for commercial shipping.
“In the past the ice was that much thicker that even ”
Yes griff the extent an volume WERE anomalously HIGH in the late 1970’s and the recovery since then
Unfortunately that recovery to more normal levels seems to have paused for the last 10 or so years.
Or by saying ” in the past, are you referring to the MWP when Vikings used to row their wooden hulled vessels around the place and there was no need for huge nuclear powered ice-breakers.?
Griff had earlier written “NW passage open every year for last decade, so YES, it will be open again this year. and to any size of ship, without icebreaker assistance.” https://realclimatescience.com/2017/02/arctic-screaming-to-scientists-shut-up/#comment-41792
Yet we do not see cargo vessels going through. And the Russians are adding to their icebreaker fleet including some nuclear ice-breakers. If the ice was going away, why would they bother to do such?
Griff claims there is lack of commercial demand.
I would say it is not lack of commercial demand, but lack of assurance that cargo ships can actually make it through the northwest passage. A cruise ship gets paid whether or not they make it through. A cargo vessel not so much.
No ship has sailed the Larson route through Prince of Wales Strait since 1944 when the St Roch, a small underpowered wooden boat made two passages
Its been impassable.
St. Roch was made primarily of thick Douglas-fir, with very hard Australian “ironbark” eucalyptus on the outside, and an interior hull reinforced with heavy beams to withstand ice pressure during her Arctic duties…
Here’s a detailed account of the St Roch’s navigations… her multi year, gunpowder assisted struggle is nothing like the conditions in the last decade where even cruise liners can sail thru clear open water in a single season
https://www.skepticalscience.com/StRoch.html
And you are going to compare a little wooden boat to a huge steel ocean liner with satellite assistance and very powerful motors.
Really griff. ???????
Your mental capacity really is severely limited..
… especially if you have to rely on SKS for assistance. !!
@Tony,
Declining ice cover shouldn’t have to rule out constant ice volume, I would think.
Their definition of ice cover is: “The ice extent values are calculated from the ice type data from the Ocean and Sea Ice, Satellite Application Facility (OSISAF), where areas with ice concentration higher than 15% are classified as ice.”
If the original area with ice > 15% is just getting blown together and the area getting smaller, together with no melt occuring, then ice volume just stays the same.
Could this be the reason?
Both use the lable ‘extent’
There is definitely a problem here, but, as you suggest, its probably a presentational issue. But if they cant present their data properly, they should not be in the business
CO2 just isn’t up to the task:
http://www.carlineconomics.com/archives/4369
“As discussed last week, several reports have shown in the last year or two that carbon dioxide (CO2) does not significantly affect global temperatures, contrary to endless repetitions to the contrary by climate alarmists and the mainstream press. Today some of the same authors of the reports discussed last week have released a new report that among other things makes a similar point using a different data set, making a total of 15 such data sets between the earlier reports and this new report. This is like doing 15 experiments using different observations of the same phenomenon and reaching the same conclusion each time. As explained last week, I believe this “no significant effect” finding is the most important finding of climate research in the last few years.”
Christy et al paper is definitely worth a read for those here still erroneously believing that Mann-Made CO2 somehow magically controls earth’s climate.
It’s 2018. Arctic in not now ice-free. It will most probably not be ice-free in September. Ice-free Arctic is long overdue. CO2 is up; ice is fine.
Ice is at record low levels for winter maximums, there is less old thick ice, the current extent is 2nd lowest for the time of year, etc, etc, etc
It just needs one melt season with ideal melt conditions like 2007 or 2012 acting on the much weakened and reduced ice to set a new low and ultimately an ice free arctic at minimum in September.
More BS from griff.
Levels are still in the top 10% of the last 10,000 years
There is MORE thick ice than there was 10 ears ago
You are a LIAR and CLIMATE HISTORY DENIER.
“As averaged over the Arctic Ocean domain (Figure 4d), the multiyear ice cover has declined from 61 percent in 1984 to 34 percent in 2018. In addition, only 2 percent of the ice age cover is categorized as five-plus years, the least amount recorded during the winter period. While the proportion of first-year versus multiyear ice will largely depend on how much ice melted during summer, how much ice is exported out of Fram Strait each winter also plays a role. First-year ice grows to about 1.5 to 2 meters (5 to 6.5 feet) thick over a winter season, while older ice is often 3 to 4 meters (9.8 to 13.1 feet) thick.”
http://nsidc.org/arcticseaicenews/
Sort of like holding Pravda, no?
Poor brain-hosed griff.
Again , looking only at the drop down from the EXTREME HIGH of the late 1970s
Totally IGNORANT that the late 1970s was the anomaly.
Totally and wilfully ignoring the FACT that Arctic sea ice is STILL ANOMALOUSLY HIGH. !
It takes an incredible SMALL mind to remain so DELIBERATELY IGNORANT.
Ah, no. There is over 2,000,000,000,000 more cubic meters of ice this year than in 2016 and 2017 as shown on this chart:
http://ocean.dmi.dk/arctic/icethickness/images/FullSize_CICE_combine_thick_SM_EN_20180515.png
Observe how the above chart differs from this one which is where DMI gets its sea ice extent chart from (DMI website states, “The ice extent values are calculated from the ice type data from the Ocean and Sea Ice, Satellite Application Facility (OSISAF), where areas with ice concentration higher than 15% are classified as ice.”):
http://osisaf.met.no/p/osisaf_hlprod_qlook.php?year=2018&month=05&day=15&prod=Ice-Type&area=NH&size=100%25
How can the first graph show ice extended completely along the eastern shore of Greenland all the way down to the tip with some of it as much as 1.5 meters thick, while the second one shows NO ice from the tip to a point some 500 miles north of the tip along the eastern shore????
Griff,
There’s plenty of ice in the Arctic.
Will the Arctic be ice-free this September? If not, when?
The probability is that 2018 will see a September low in the bottom 5 for the satellite record and even a new record low…
There are plenty of charts out there showing the estimated dates for an ‘ice free’ arctic ocean within the next few decades.
” in the bottom 5 for the satellite record” SO What???
It still WAY higher than most of the first 9000 years of the current interglacial.
Why do you continue to DENY that fact, griff.
It makes you look INCREDIBLY STUPID. !!
And charts showing Arctic ice free in the near future are about as rekliable at forecast as Wadham
They appear to be TOTALLY IGNORANT of the cyclic nature of Arctic sea ice.
Even more IGNORANT that you are.. if that is humanly possible. !
At least you KNOW the facts, even if you have to LIE TO YOURSELF about them.
In other words, more ice than there was 2,000 and 5,000 years ago (many many summers when there as NO arctic ice) when CO2 was much lower? Can you please explain the mechanism that caused the ice to increase from those periods to the present while CO2 has INCREASED???http://research.bpcrc.osu.edu/geo/publications/mckay_etal_CJES_08.pdf
David, at the point where the arctic ice was much lower, the Earth’s orbit was such that the N hemisphere was aligned for maximum solar input during summer. That additional energy input resulted in lower ice cover.
That situation does not now apply -yet ice is again declining. The current climate driver is warming due to human CO2
“…the Earth’s orbit was such that the N hemisphere was aligned for maximum solar input during summer.”
Have you seen the computations of how much difference that SCARY MAXIMUM INPUT is from now?? The arctic circles are at an incident angle that allows more reflection than lower latititudes. I would also add that ice is an insulator that keep more of the heat in the ocean than when it is not present. There is no significant positive feedback for the mythological tipping point or we would already be ice free as predicted by Al “loserman” Gore and others as recently as 2016.
It still drives me nuts that DMI continues to use the same 1981-2000 reference period (at 2SD) for their “normal” range for their extent graph. That is a 21 year period (“Climate is 30 years”) and it ends 18 years ago. In what way is that “normal”?
It isn’t normal, but it is their sneaky way to make every year look like it is less ice than in those prior years. I suppose if you ask, you will get a song and dance and something like, “it is what we have always done, so we can’t change it now or …. “
When you look at the AMO, you can see why using the 1981-2000 period is such a deceitful exercise. Its only just after the coldest period since the start of the 1900s.
Andy,
Below is the most boring gif I have ever made. It illustrates summer temperature fluctuations above 80 deg north.
with the gif, sorry
Every year for a decade now we’ve heard “experts” claim the Arctic will be ice free in the coming summer. And every year they’re wrong. Griff would not only buy the Brooklyn bridge from a guy in a dark alley; She would search out more dark alleys for more guys that would sell it to her hoping one actually had the real title.
given a melting season like 2007 or 2012, we would certainly see a new record low.
Every year we have “the hottest year evah” according to the “experts” and still there is as much ice volume in the Arctic as there was in years ago. And every year we see you having the same wet dream, hoping the Arctic will be ice free. The saying that “You can’t make this stuff up.” Became obsolete when referencing so called “climate science” years ago. And you still don’t see that.
OT but has anyone else noticed that we’re at near record lows for tornadoes this year? Another climate science fiction claim falsified.