Earth has cooled 0.54C since the year Donald Trump got elected. That is the fastest 24 month cooling since 1916.
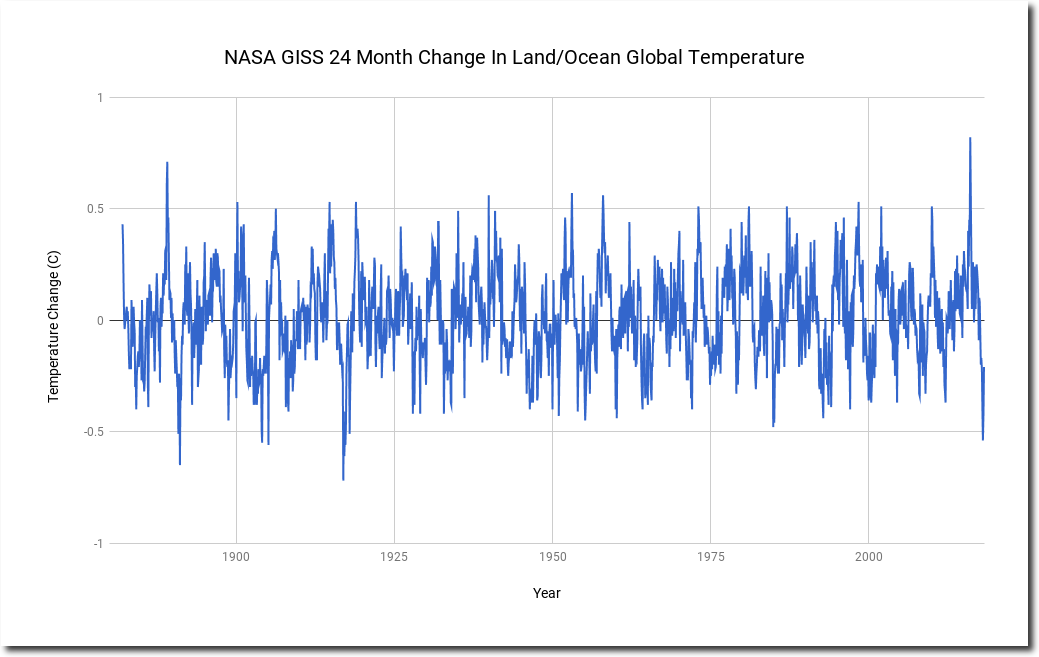
www.woodfortrees.org/data/gistemp Spreadsheet
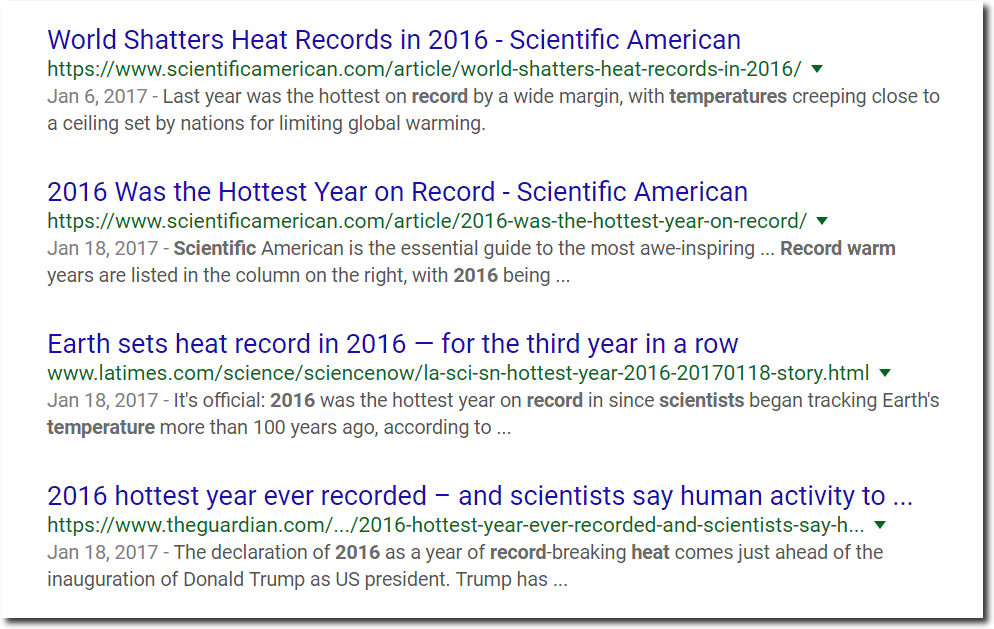
Last year, scientists said Earth was record hot and it was Donald Trump’s fault. But they had it backwards. The prior warming was Obama’s fault, as Trump wasn’t in office yet. The cooling since 2016 is under Trump’s watch.
Tony,
Check out this bunch of crapola brought to you by USA Today. https://www.msn.com/en-us/news/other/earth-just-had-its-400th-straight-warmer-than-average-month-thanks-to-global-warming/ar-AAxqwtl?li=BBnbcA1
I just had my 500th straight month being taller than average height . I must be getting really tall! And that is without data tampering.
Hahaha! Good one, Tony! It’s true, you can read statistics many different ways and many are of them are going to be right.
Yet doesn’t support the AGW conjecture at all.
It fails the Per Decade warming rate prediction/projection made by the IPCC reports.
No “hot spot” shows up.
Once CAGW alarmists set the “average”, it’s like Joe Stalin counting votes.
You know that something is rotten in Danmark
when reality Trumps science and a ‘crazy’ guy is closer to the truth than a thousand experts by saying the opposite of what they say.
Hi Tony,
Curious about you excel graph. The data link you provide has negative number for most dates prior to 1977. After 1977 all most all of the data is positive with there being several values over 1. How did you arrive at your graph from the data link you provided? Thanks.
I put a link to the spreadsheet in the blog post
Converting data to information. Its always been a problem and it always will be.
Isn’t it obvious? During Obama’s term, everyone was like “He’ll take care of it for us” and did nothing, but now that Trump’s in office, and outright doesn’t believe in CAGW, much less care about it, everyone’s decided to take matters into their own hands, planting trees, and in some cases, making machines that remove CO2 from the atmosphere.
Atmospheric CO2 continues to increase exponentially.
https://www.esrl.noaa.gov/gmd/ccgg/trends/full.html
Even so, it doesn’t look like the amount went up as significantly between 2017-18 as it did in the years prior.
How is it possible that there were 7 landfalling hurricanes between North Carolina and New England during the years 1953-1955, with CO2 below 320?
It is possible because there has been no legitimate science has demonstrated a link between Hurricane incidence, strength, or landfalls and CO2 concentration.
What has happened before will happen again. It’s mother nature and doesn’t have a damned thing to do with burning coal or oil.
BTW the pattern indicates that the MDR in the Atlantic will not be where the land falling storms will come from for at least the first half of the season. They’re going to develop closer to home. Next week there is a chance for the first TS of the year to form in the Caribbean and head north from there.
I see Climate Depot has a link to this blog post.
Yeah!
They link to most of Tony’s posts it seems.