Doom Arrives For Arctic Alarmists

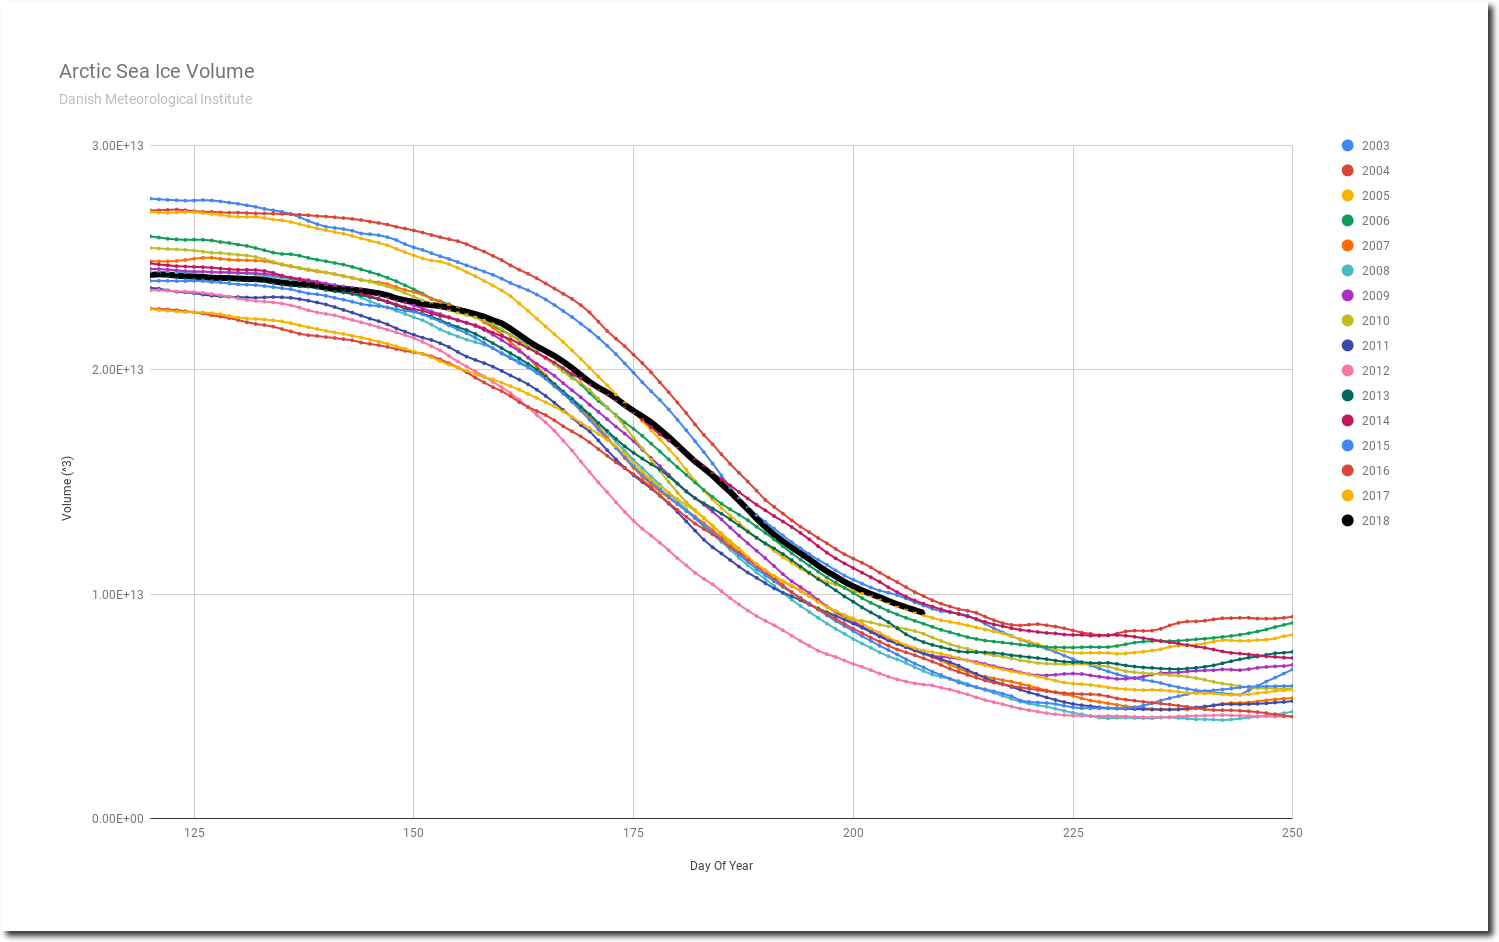
Arctic sea ice volume melt rates have started to slow, with ice volume 4th highest since 2003.

Spreadsheet    Data

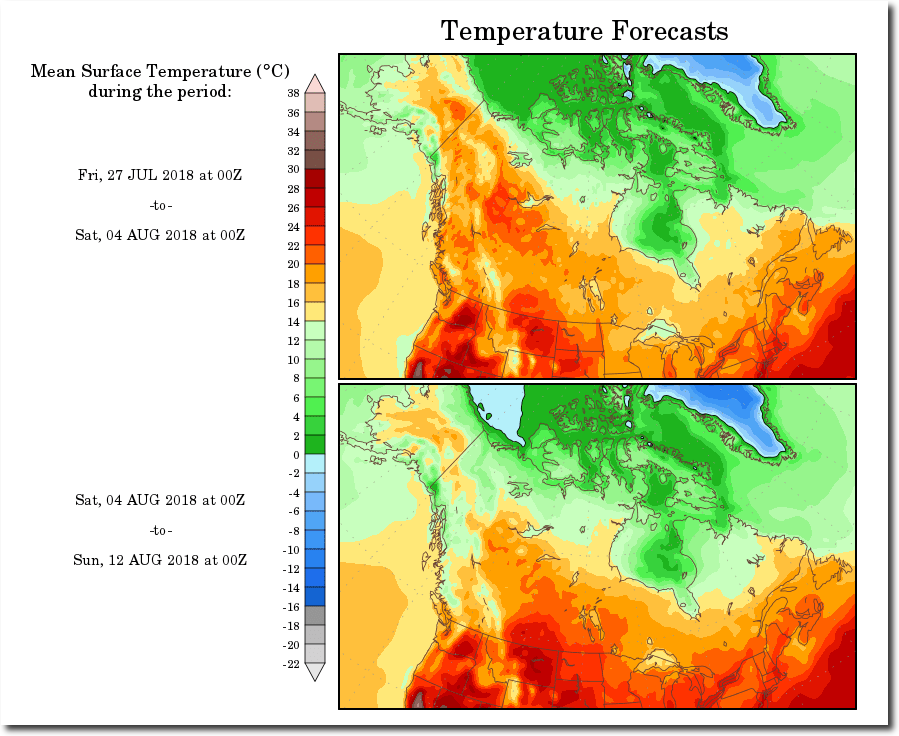
Temperatures near the pole have been below normal almost every day this summer.

Ocean and Ice Services | Danmarks Meteorologiske Institut

Time is running out for the Democrats’ prophet, who predicted ice-free no later than 2018.

The Argus-Press – Google News Archive Search

He has a lot of work to do in the next couple of weeks, including melting the thick ice blocking the Northern Sea Route and Northwest Passages.

FullSize_CICE_combine_thick_SM_EN_20180711.png (1337×1113)

The Northwest Passage was open in 1903, but perhaps not this year.

TimesMachine: March 9, 1907 

According to NASA, 1904 was the coldest year on record. In the world of climate science, ice melts when it is cold and freezes when it is hot.

graph.png (1130×600)

Meanwhile, climate scientists and the press continue their usual barrage of lies.

This entry was posted in Uncategorized. Bookmark the permalink.

31 Responses to Doom Arrives For Arctic Alarmists

  1. Griff says:

    and compared to before 2003?

    The ice decline has in no way stopped.

    • Gator says:

      And compared to the average of the past 9000 years, there is currently more ice.

      Why do you hate poor brown people Ms Griff?

    • spike55 says:

      Arctic sea is STILL in the top 10% of the last 10,000 years

      But that isn’t what you wanted to know, was it griff.

      Arctic sea ice recovery since the extreme high of the late 1970s, has indeed STOPPED.

      What hasn’t stopped is your idiotic LIES.

      Why are you DENYING REALITY yet again, griff?

      Why do you DENY Climate change??

    • sunsettommy says:

      The “decline” has stopped since 2007.

    • Disillusioned says:

      “The ice decline has in no way stopped.”

      No Griff, the decline indeed stopped. To ignore recovery from its lows over the past decade doesn’t change the fact it is growth and is *not* a decline. And using the century high as the bar for your propagandist scaremongering is transparent. People aren’t falling for it like they used to. The boy who cried wolf finally no longer was believed.

    • Andy DC says:

      Griff, will you at least admit that there has been a 10-15 year pause in the decline of sea ice? Will you admit that the 1979 starting date for the decline of Arctic Sea ice is an obvious cherry pick? That if the charts started in 1969 or 1949 that you would clearly have a different picture, of a cycle rather than a decline?

  2. Louis Hooffstetter says:

    From Wikipedia:

    “Arctic sea ice decline is the sea ice loss observed in recent decades in the Arctic Ocean. The Intergovernmental Panel on Climate Change (IPCC) Fourth Assessment Report states that greenhouse gas forcing is largely, but not wholly, responsible for the decline in Arctic sea ice extent. A study from 2011 suggested that internal variability enhanced the greenhouse gas forced sea ice decline over the last decades.[1] A study from 2007 found the decline to be “faster than forecasted” by model simulations.[2] The IPCC Fifth Assessment Report concluded with high confidence that sea ice continues to decrease in extent, and that there is robust evidence for the downward trend in Arctic summer sea ice extent since 1979.[3] It has been established that the region is at its warmest for at least 40,000 years and the Arctic-wide melt season has lengthened at a rate of 5 days per decade (from 1979 to 2013), dominated by a later autumn freezeup.[4] Sea ice changes have been identified as a mechanism for polar amplification.[5]”

    [1] Wrong, [2] wrong, [3] wrong, [4] wrong, and [5] wrong.
    The IPCC and the climate witch doctors are batting 1000!

    • Gerald Machnee says:

      Remember that wickedpedia is the last place to look if you want info on weather and climate. Certain people control the data.

  3. Psalmon says:

    Live view as Canada and US authorities struggle to manage Arctic marine traffic…

  4. Steven Fraser says:

    And some numbers to go along with the commentary:

    DMI Sea Ice volume daily decline rate has decreased each day from its high of -410 of July 8 to -300 yesterday.

    2018 decline rate was narrowed the gap with 2003 (#3) by 6 cukm, and is now 257.

    2018 has risen to 111.05% of the 16-year average, and is 113.21% of the DMI-graphed 10-year 2004-2013 values.

    When compared with the 16-year values, this puts 2018 just below the 1-sigma line, the upper boundary of the 1st std deviation. When compared with the 10-year graphed period, 2018 is above the 1-sigma line, in the 2nd std deviation.

    Interesting!

    Stay tuned.

  5. Johansen says:

    Hansen the prophet: Now just an old man desperate to stay relevant, getting arrested with Hollywood celebrities, doing his best “humble-sanctimonious” pose for the cameras.

  6. Mr GrimNasty says:

    NSIDC Antarctic sea ice chart is relentlessly approaching the 1981-2010 median, having been ~1MKmSq below the median at the start of May.

  7. Brian D says:

    For the rest of July, don’t look for any big changes in the weather pattern across the Arctic. Low pressure will continue to dominate, and snows across Greenland will keep SMB fairly stable.

  8. lance says:

    Just wait until the Goracle busts Reggie “blow torch” out of jail!!! Ice will hit the ‘fan’….

  9. misanthropicMarc says:

    Tony:

    I think we should set up a real estate agency within the polar circle and start selling “escape plots” to concerned climate believers. You in?

    -Marc

Leave a Reply to Griff Cancel reply

Your email address will not be published. Required fields are marked *