Disrupting the Borg is expensive and time consuming!
Google Search
-
Recent Posts
- Turn Out The Lights, The Party Is Over
- Michael Mann Again
- Over The Target
- Michael Mann’s Latest Research
- “an amazing documentary dismantling the climate change theory”
- The World’s Greatest Climate Scientist Speaks Out
- Startling New Revelation
- Just An Illusion
- Climate Conditioning
- Fact Checking Reuters
- No Correlation
- I Offended Their Religion
- The High Priest Has Forbidden Questioning His Religion
- Hiding And Rewriting History
- Fact-Free Economist
- Academic Tipping Points
- Desperate Academics
- Climate Misinformation
- Unreliable And Toxic
- Unreliable And Toxic
- Fossil Fuels To End Risotto
- HG Wells “CHANGES IN THE WORLD’S CLIMATE” 1920
- SCIENCE : THE ICE AGE COMETH?
- Climate Misinformation
- “Goodbye New York. Goodbye Washington”
Recent Comments
- Richard E Fritz on Turn Out The Lights, The Party Is Over
- Peter on “an amazing documentary dismantling the climate change theory”
- arn on Turn Out The Lights, The Party Is Over
- Mike Haseler (Scottish Sceptic) on Michael Mann Again
- Jimmy Haigh on Michael Mann’s Latest Research
- jb on Michael Mann Again
- Bill Odom on Michael Mann Again
- Richard E Fritz on Michael Mann Again
- Francis Barnett on Michael Mann’s Latest Research
- Disillusioned on Michael Mann Again
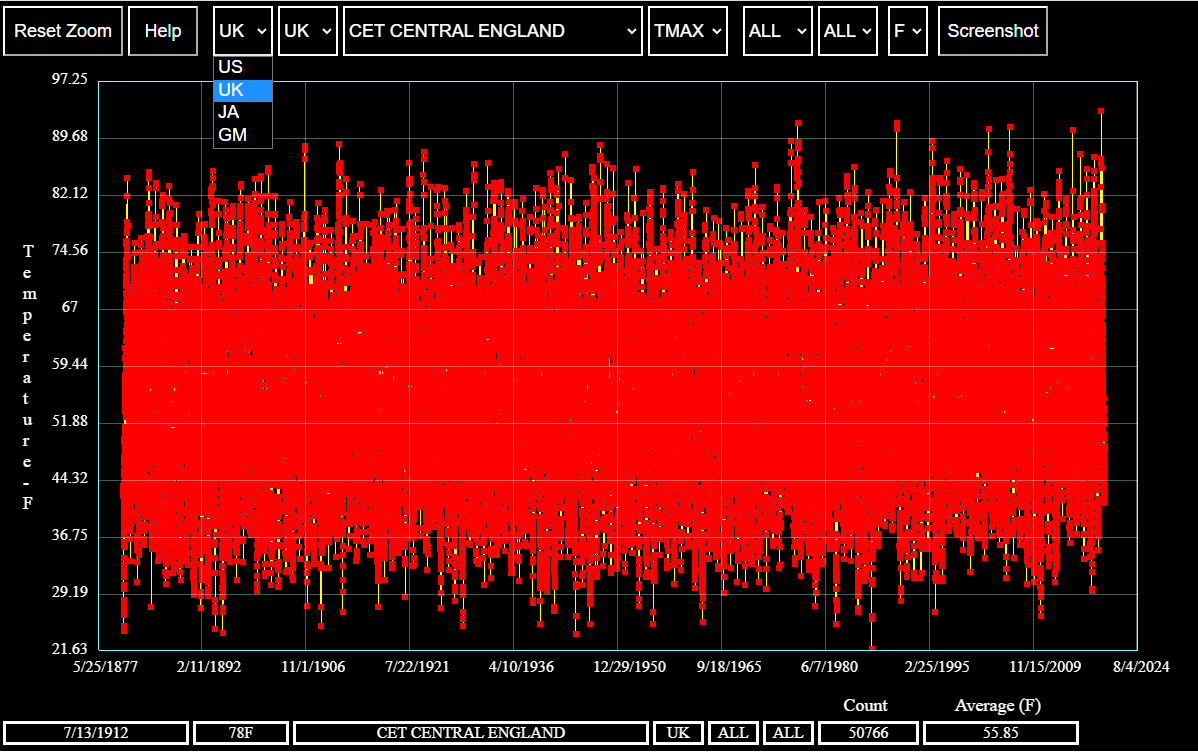
Climate Graphing Tool Now Supports Other Countries
This entry was posted in Uncategorized. Bookmark the permalink.


