
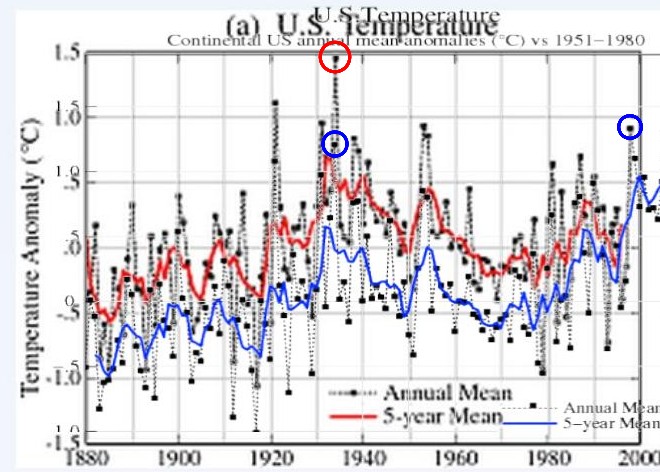
In order to hide America’s hot past, NASA has knocked 0.7ºC off 1934 temperatures relative to 1998. Graph shows their 1998 version in red, and current version in blue – normalized to 1998.
In order to hide America’s hot past, NASA has knocked 0.7ºC off 1934 temperatures relative to 1998. Graph shows their 1998 version in red, and current version in blue – normalized to 1998.

Does NOAA ever offer any rational explanation for the data manipulation? If so, what is it? Or is it just blantant cheating?
More like blatant fraud.
just like they hid the truth about the phony moon landings.
Reblogged this on Power To The People and commented:
Climate Change Scam Piggies get your noses out of public trough Egyptian capital sees snowfall 1st first time in 112 YRS. http://wp.me/p7y4l-pNw
Climategate was but the tip of a giant iceberg of government deception, started in 1945 with the noble goal of saving the world from possible nuclear annihilation.
I am convinced of these conclusions: “Homo Sapiens will hang together, and share information honestly, or risk sudden – but unexpected – death from natural causes. We have fortunately survived the last sixty-eight (2013 – 1945 = 68 yrs) years, . . .”
https://dl.dropboxusercontent.com/u/10640850/Chapter_2.pdf
Yes… Alter the data and NOBODY will ever know!!! Blah ha ha ha… Who ain’t gonna believe NASA?? … We are getting relagated to conspiratorialists thanks to this bold outright revisionist lie…
Yes, Phil. That tactic has worked for the past sixty-eight years, since leaders of the scientific community joined forces with world leaders in 1945 to
1. Form the United Nations on 24 October 1945
2. Hide neutron-repulsion in cores of atoms & stars
Chapter 1 of my autobiography described the start of my 53 year trek to the core of the Sun on meeting Professor Kuroda in May 1960.
https://dl.dropboxusercontent.com/u/10640850/Chapter_1.pdf
Chapter 2 used precise experimental data to provide clear and unequivocal evidence:
a.) Neutron-repulsion is the source of energy in cores of heavy atoms and stars
b.) The Sun made our elements, birthed the solar system and sustains our lives
c.) Iron-56 is the most abundant and most stable atom in the Sun and the Earth
Chapter 2 compares solar and nuclear science before and after the Second World War:
1. Astronomers and astrophysicists believed the interior of the Sun was mostly iron (Fe) before the end of the Second World War, but after the Second World War ended they unanimously changed their opinions without discussion or debate in 1946 to conclude the Sun’s interior is mostly hydrogen (H)
2. Scientific textbooks used F. W. Aston’s rigorously valid “nuclear packing fraction” to indicate nuclear stability before the end of the Second World War, but after the Second World War ended most textbooks replaced Aston’s “nuclear packing fraction” with C. F. von Weizsäcker’s deceptively convincing “nuclear binding energy.” The latter obscures neutron-repulsion with high values for the binding energy of neutron-rich atoms and low values for the binding energy of proton-rich atoms.
https://dl.dropboxusercontent.com/u/10640850/Chapter_2.pdf
In case anyone is seriously interested in finding out what NASA says: http://www.c2es.org/science-impacts/basics/fact-sheets/nasa-us-temp
Which starts out: “A recent correction of a NASA data set of yearly average U.S. surface temperatures has been misconstrued in the media. NASA’s error applied only to U.S. land surface temperatures, not global temperatures. When discussing climate change, it is the global temperature that matters. The error did not change the fact that 1998 remains the warmest year on record globally. In fact, no annual global temperature rankings changed. Moreover, focusing on individual years has little relevance to climate change, as climate is defined by average conditions over several years.”
NASA’s published temperature record has nothing to do with reality
Steven, I had no idea how bad things were at NASA until the Galileo probe was released into Jupiter’s atmosphere 18 years ago, in December 1995.
Isotope measurements confirmed that Jupiter formed from elements unlike those in the Sun, as we had reported in 1975, 1977, 1979, 1983, etc.
NASA hid the data until the NASA administrator was confronted while being video recorded by CSPAN News in 1998. CSPAN recorded Dr. Daniel Goldin releasing the data that confirmed the SN birth of the solar system five billion years (5Ga) ago.
https://m.youtube.com/watch?v=m3VIFmZpFco&desktop_uri=%2Fwatch%3Fv%3Dm3VIFmZpFco
“Take this test yourself to see how bad a shape the global data base is. Look for yourself following these directions using the window into the NOAA GHCN data provided by NASA GISS here.
Point to any location on the world map. You will see a list of stations and approximate populations. Locations with less than 10,000 are assumed to be rural (even though Oke has shown that even a town of 1,000 can have an urban warming of 2.2C).
You will see that the stations have a highly variable range of years with data.
Try and find a few stations with data that extends to 2009. To=2 0see how complete the data set is for that station, click in the bottom left of the graph Download monthly data as text.
For many, many stations, you will see the data set in a monthly tabular form has many missing data months mostly after 1990 (designated by 999.9).
This required the data centers to estimate data for the grid box for that location with other stations nearby (homogenization). In the 2008 plot above only 1079 stations were used. NASA went to locations within 250 km (155 miles) to find data for the grid boxes. For grid boxes without stations within 250 km, they are left blank, thus the large gaps.
Most of the stations that dropped out were rural. More of the missing data points are having their missing months filled in with more urban data in the grid boxes.”
http://icecap.us/images/uploads/How_Bad_is_the_Global_Data.pdf
No need to adjust for UHI or station removal. I mean, weren’t all runways paved by the 1930’s? 😆