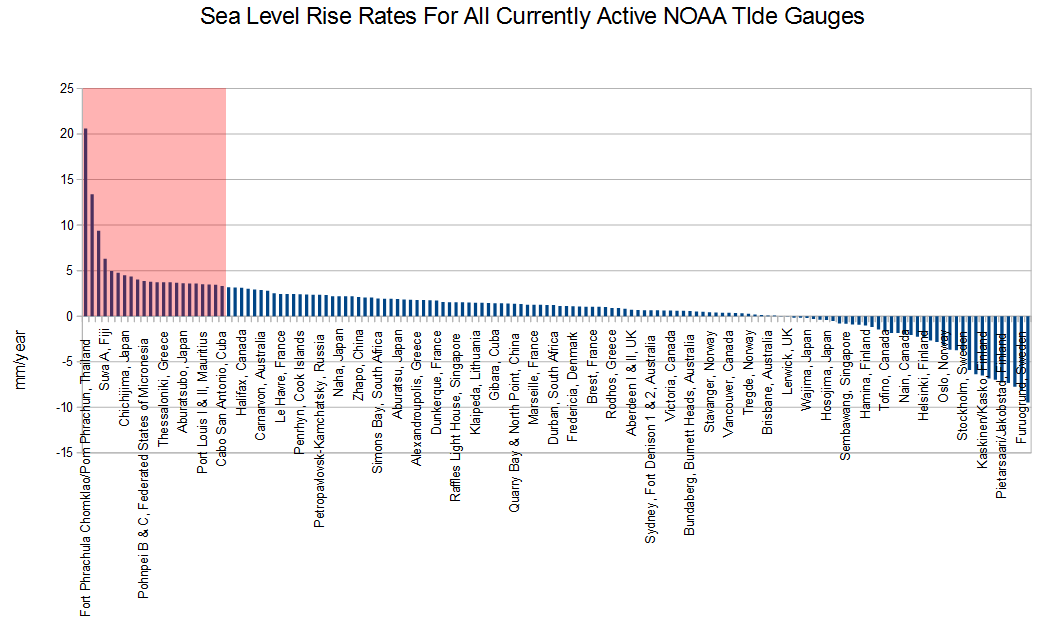
http://tidesandcurrents.noaa.gov/sltrends/MSL_global_trendtable.html …
Eighty-five percent NOAA’s currently active tide gauges report less than 3.2 mm/year, and most of the ones which are above 3.2 mm/year are in active tectonic zones – making their numbers meaningless.
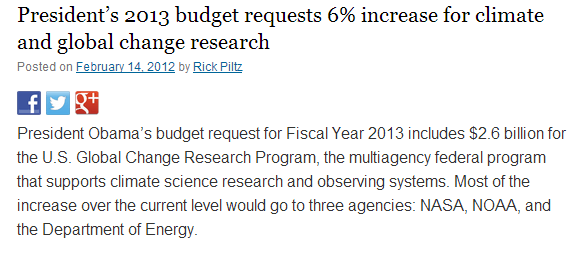
The official 3.2 mm/year is complete nonsense, like almost everything else coming from the $26 billion/decade climate scam.


85% faulty gauges…worse then Detroit 🙂
The magnetospheric compression during solar max (right now in SC-24) over the past 23 cycles shows us 15-30 months of indentation of 1.3% to 7.8% over 30% of that timeframe.
We’ve seen depression in a depressive mode of .02% to .08% for less than 6% of this SC-24.
We’ve also seen the results of this entire spunkless solar cycle in all levels, from the furthest extent of the magnetosphere right on down to the surface (actually subsurface)….
Throughout the defined spheres, the chemical reactive forces, pressures, temperatures and electromagnetic interactions have been in an idle state as compared to past cycles.
However, the science is settled, say the criminals receiving our $ in the form of scientific grants.
These neurotic thieves will give up on their hypothesis venture only when the next ice age advance becomes undisputable, but not until then…
Ask these demented and psychotic individuals if AGW will make this the everlasting inter-glacial period, and if so, please explain. Don’t forget to record their answers…
Globally Monckton puts the take at about one billion per day.
“These neurotic thieves will give up on their hypothesis venture only when the next ice age advance becomes undisputable…”
Not likely. Those who hold to some such idol (?) do so blindly, unthinkingly, and tenaciously. Search the Book of Revelation for the two words, “refused to repent,” and see how similar individuals react in the most extreme circumstances when challenged to change.
Reblogged this on wwlee4411 and commented:
Polar ice expansion. Global Warming. If you BELIEVE!
Reblogged this on CACA.
Even if the joke numbers from Bankok and Manila are included (and Univ of Colorado cautions that the Manila one is probably erroneous) the avaerage is just over 1mm/yr. If I leave Bankok, Manila, Suva and a couple of other dodgy* ones out, it goes just under 1mm/yr. If completely omit the negative values from Scandinavia, Canada etc. (which are probably to do with glacial rebound) I still only get 2mm/yr. So NOAA are getting another 1.2mm/yr from somewhere – could it be from the fabulous Geo-isostatic Adjustment?
* at least 1 of these data sets could have been heavily influenced by heavy strengthening works that were added to the rickety quay (with marine piles) on which the tide gage is mounted.