“…beginning on May 9, 1934, a strong two-day dust storm removed massive amounts of Great Plains topsoil in one of the worst such storms of the Dust Bowl. The dust clouds blew all the way to Chicago where dirt fell like snow.[citation needed] Two days later, the same storm reached cities in the east, such as Buffalo, Boston, Cleveland, New York City, and Washington, D.C. That winter (1934–1935), red snow fell on New England.”


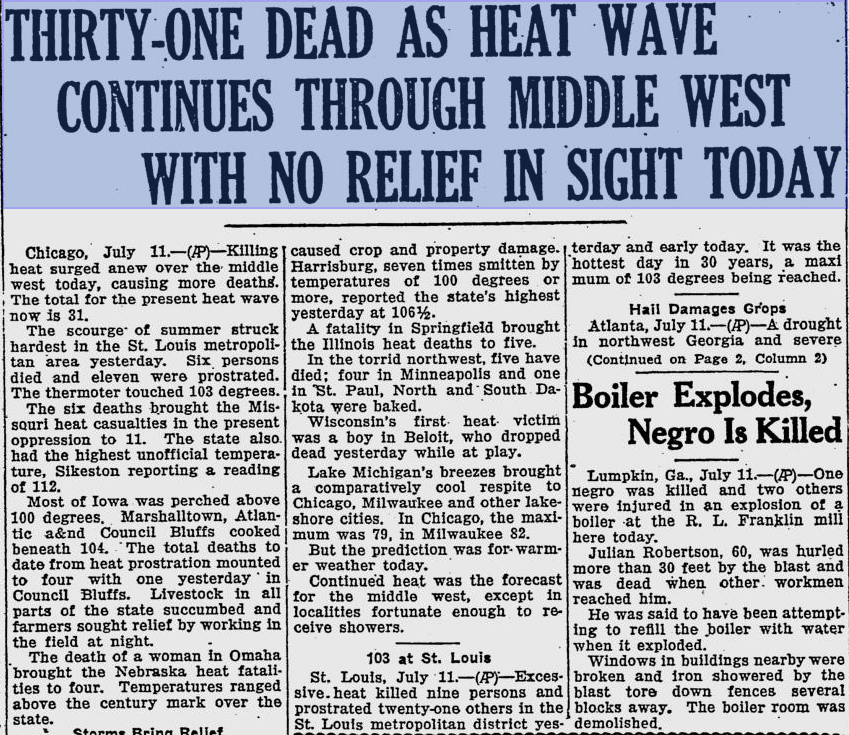
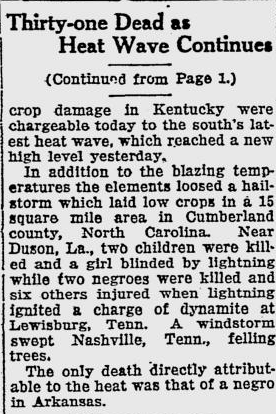


Washington, DC’s all time record high (106) was set in July 1930. That was the first of the bad Dust Bowl years.
Yes, but that was low CO2 heat.
“…beginning on May 9, 1934, a strong two-day dust storm removed massive amounts of Great Plains topsoil in one of the worst such storms of the Dust Bowl. The dust clouds blew all the way to Chicago where dirt fell like snow.[citation needed] Two days later, the same storm reached cities in the east, such as Buffalo, Boston, Cleveland, New York City, and Washington, D.C. That winter (1934–1935), red snow fell on New England.”
Imagine that today…