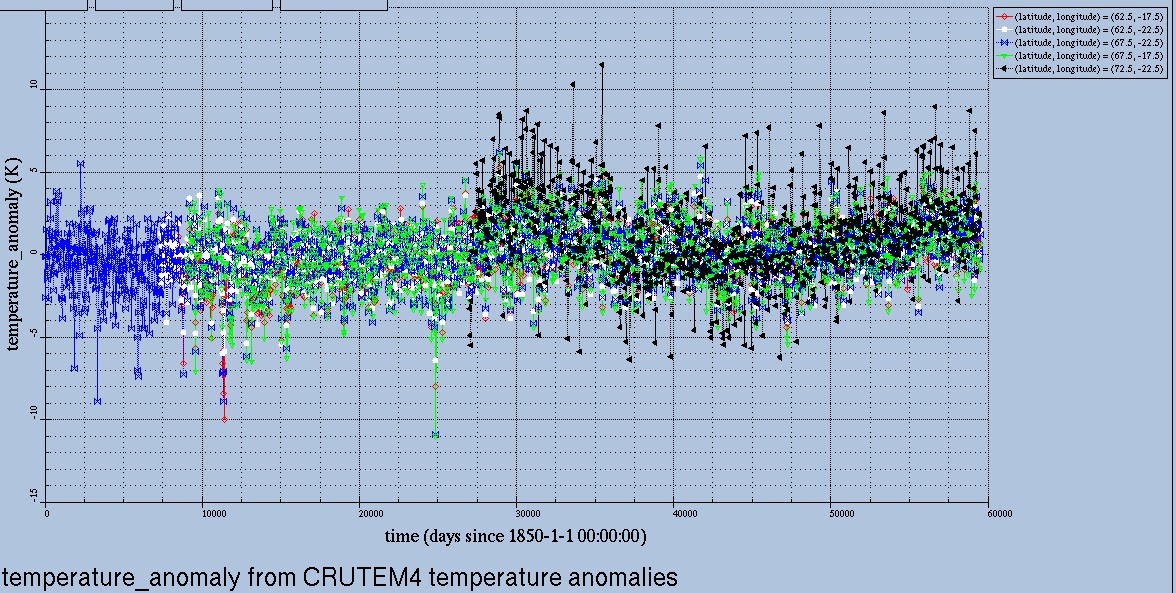
The graph below plots all of the CRUTEM4 records for Greenland. It was just as warm or warmer during the 1940s.
This was pointed out a long time ago in a paper by a couple of researchers at Los Alamos, although at that time (2006) they compared the late 90s early 2000s to the 1920s and 30s.
http://meteo.lcd.lu/globalwarming/Chylek/greenland_warming.html
Your email address will not be published. Required fields are marked *
Comment *
Name *
Email *
Website
Save my name, email, and website in this browser for the next time I comment.



This was pointed out a long time ago in a paper by a couple of researchers at Los Alamos, although at that time (2006) they compared the late 90s early 2000s to the 1920s and 30s.
http://meteo.lcd.lu/globalwarming/Chylek/greenland_warming.html