
Disrupting the Borg is expensive and time consuming!

Google Search
-
Recent Posts
- Vandalism At The Reflecting Pool
- Fifty Years Ago Today
- Truth Or Consequences
- US Climate Trend Maps
- Declining Spring Snow Cover In Northern New Mexico
- You Can’t Fool Mother Nature
- Cattle And The Climate
- One Atomic Bomb Per Hour
- New Video : Analyzing Oil And Gas
- Is Antarctica Melting?
- High Speed Analysis And Visualization
- El Nino To The Rescue?
- Fake News Update
- Growth Of Antarctic Sea Ice
- 65 Years Of Progress!
- El Nino To The Rescue?
- Worst March Drought On Record
- ChartGL Process Control Demo
- The Biggest Money Laundering Scam
- Drought In The Headwaters Of Lake Powell
- Unrealistic Expectations Of Water Availability
- Did Bill Gates Do This?
- Worst March Drought On Record In The US
- The Real Hockey Stick Graph
- Analyzing The Western Water Crisis
Recent Comments
- Chuck on Truth Or Consequences
- Gerald Machnee on Fifty Years Ago Today
- conrad ziefle on Fifty Years Ago Today
- Bob G on Truth Or Consequences
- Weylan McAnally on One Atomic Bomb Per Hour
- conrad ziefle on Declining Spring Snow Cover In Northern New Mexico
- Bob G on You Can’t Fool Mother Nature
- Ivan G Wainwright on You Can’t Fool Mother Nature
- conrad ziefle on You Can’t Fool Mother Nature
- Bob G on You Can’t Fool Mother Nature
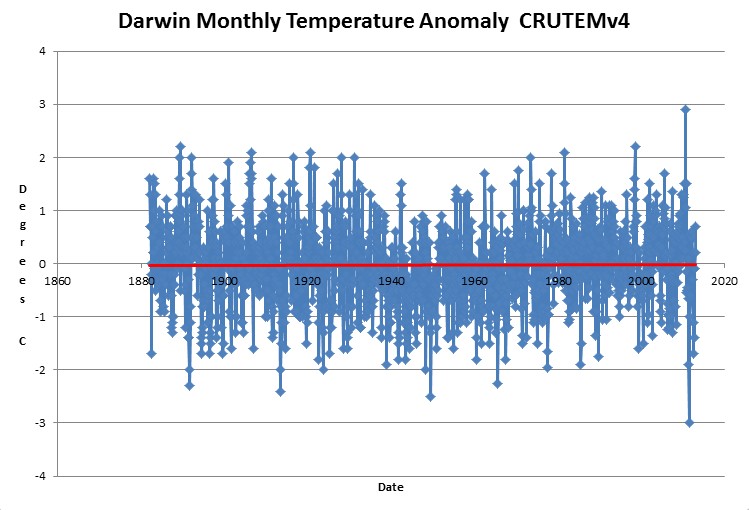
So much for the “hot spot”.
This is likely the same result for most equatorial locations affected by marine Trade Winds. I’d expect Caribbean, Northern Brazil, Eastern African, locations to show similar results!
The extra CO2 should mean a positive feedback in Darwin…surely? (: Evaporation should be running amok and wreaking havoc!
Bloody water vapour!
The extra CO2 causes a positive feedback, or a negative feedback, unless it causes no feedback, in which case it causes a negative positive backfeed. At other times, it makes no difference at all.
Steve does a great job bringing up these local temperature record graphs, and all the ones I have seen show no warming over a long time scale. I know it would be a huge exercise but if this could be collated for all temperature stations it would be a more accurate means of identififying if world overall temperatures were really changing. If all these graphs showed no, or negligible, change then how could anyone claim the world average was changing?
To be fair, Perth shows warming while Darwin and Sydney don’t. My opinion is that there is no long term warming other than that caused by UHI.
Isn’t that what the combined Crutem4 global anomaly is?
And HadCRUT4 when you include HadSST3.
Well, there are two ways of looking at it. I got this quote from a recent Michael Mann post:
“This is a long standing problem in climate science. Morgan & Keith (1995, Subjective judgements by climate experts. Environmental Science & Technology 29, 468-476) showed that for some basic questions a very careful way of determining the data constructs can lead to a bimodal evaluation distribution rather than just a unilateral view around a mode value. This then raises questions about the usefulness of a median evaluation construct.” -Michael Mann
In other words, there are two ways of looking at it. What an asshole.
Bringing up Darwin again? Lol.
You’re not going to find much warming in the tropics because there hasn’t been.