Global Warming Fraud Washes Away The Integrity Of Science

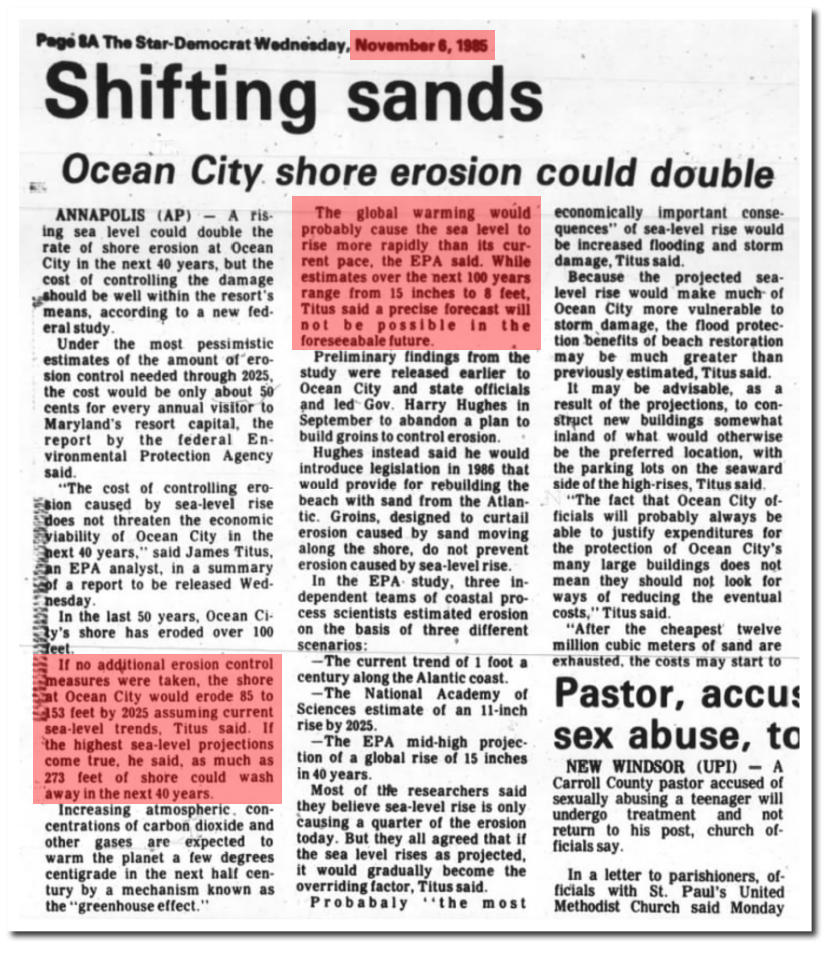
In 1985, the EPA said global warming would wipe out the beach at Ocean City, Maryland by 2025.

273 feet of shore could wash away in the next 40 years.

06 Nov 1985, Page 8 – The Star-Democrat at Newspapers.com

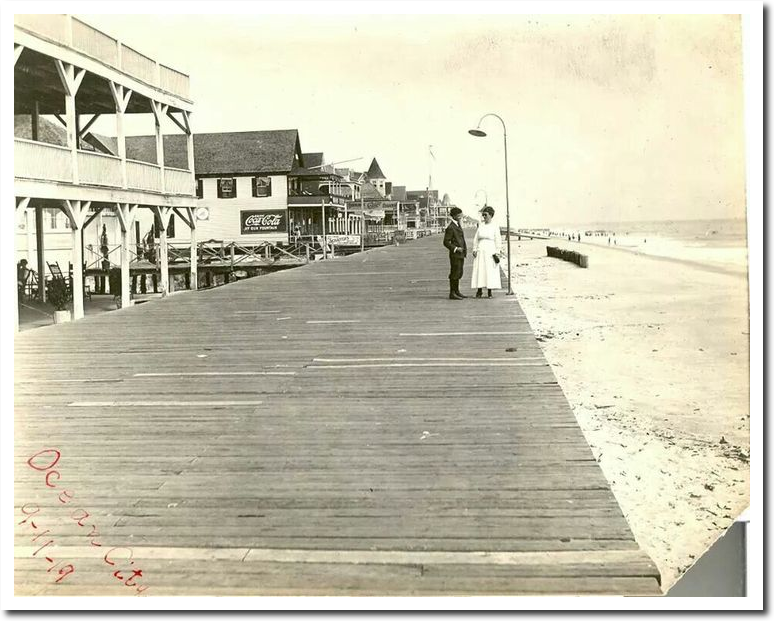
This was the Ocean City Beach in 1919

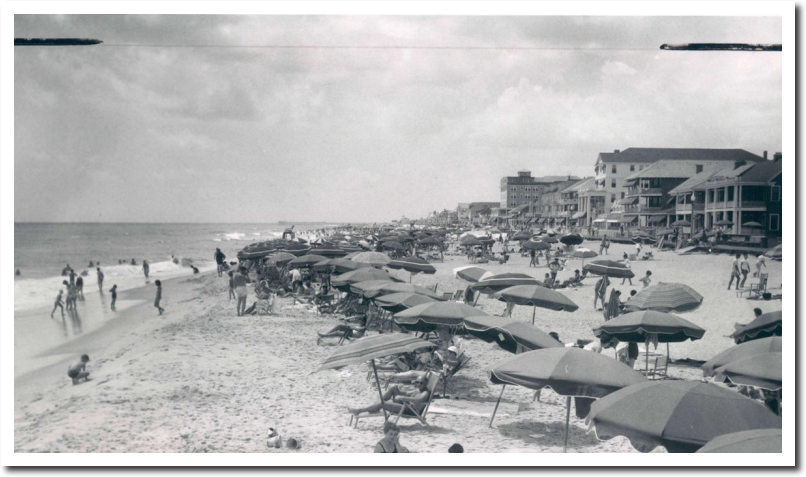
Exactly the same as 1959

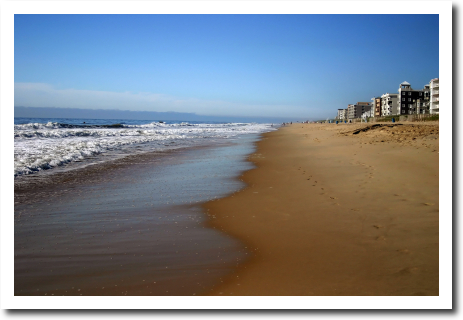
Exactly the same as now.

In climate science, it is all lies, all the time. It is about scaring people out of their money.

Posted in Uncategorized | Leave a comment

Keeping Your Lawn Green

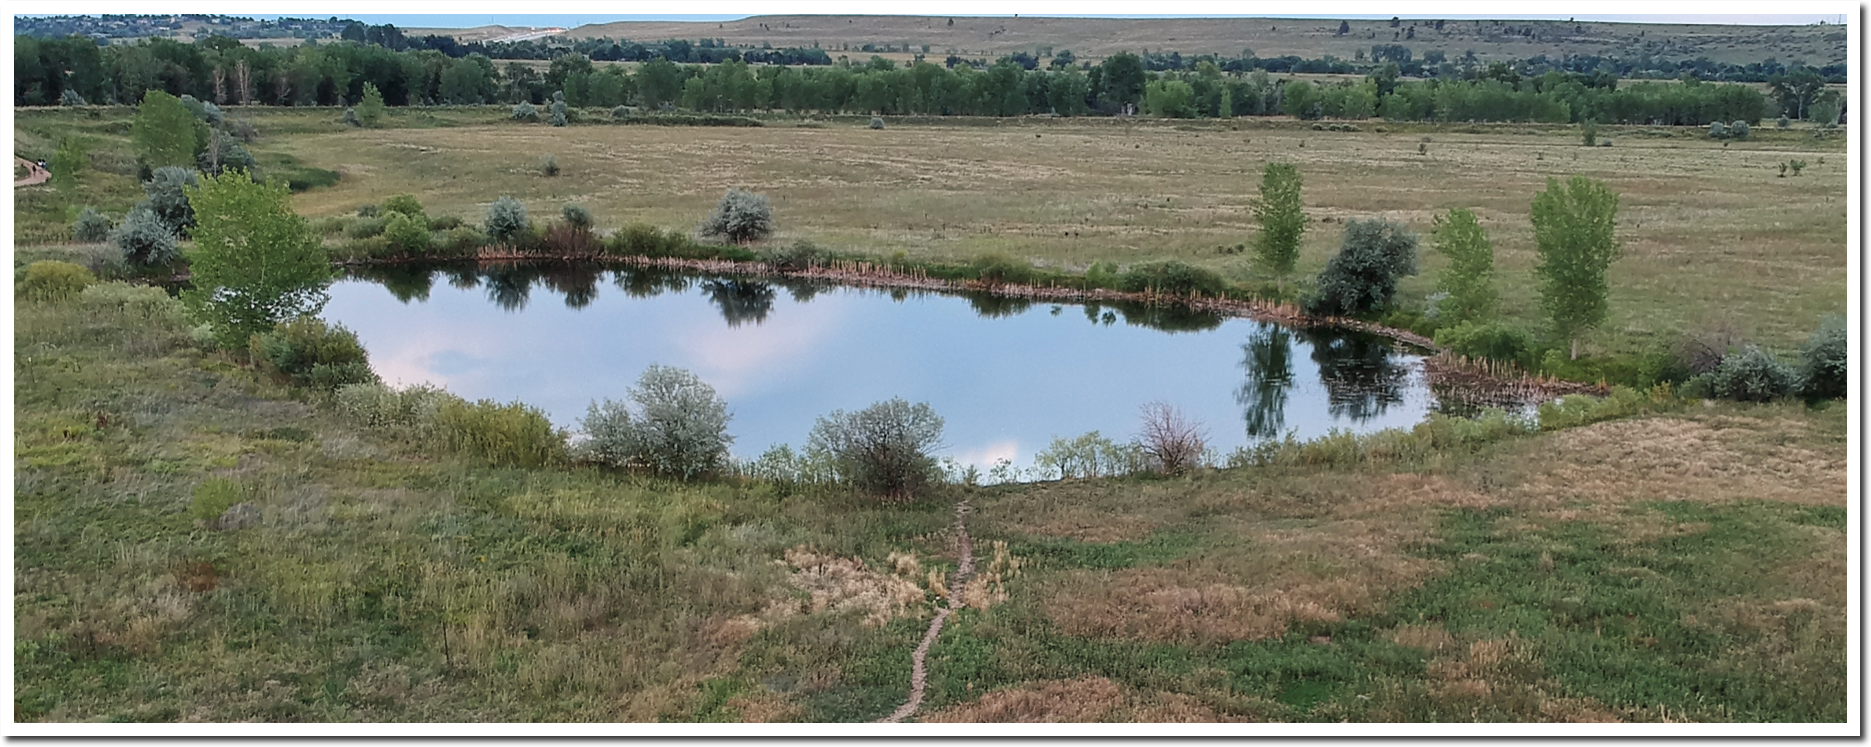
These two ponds are located a half mile apart. This pond is healthy.

This pond is downstream from thousands of people who put chemical fertilizers on their lawn. Algal blooms appeared last year and killed all the fish.

Posted in Uncategorized | Leave a comment

100% Of US Warming Is Fake

Zeke and Nick and all the other apologists for NOAA data tampering claim that adjustments to US temperature are due to Time Of Observation Bias or some other sciencey sounding reason, But the reality is that the data is simply fake.

In 1989, NOAA reported no US warming since 1895.
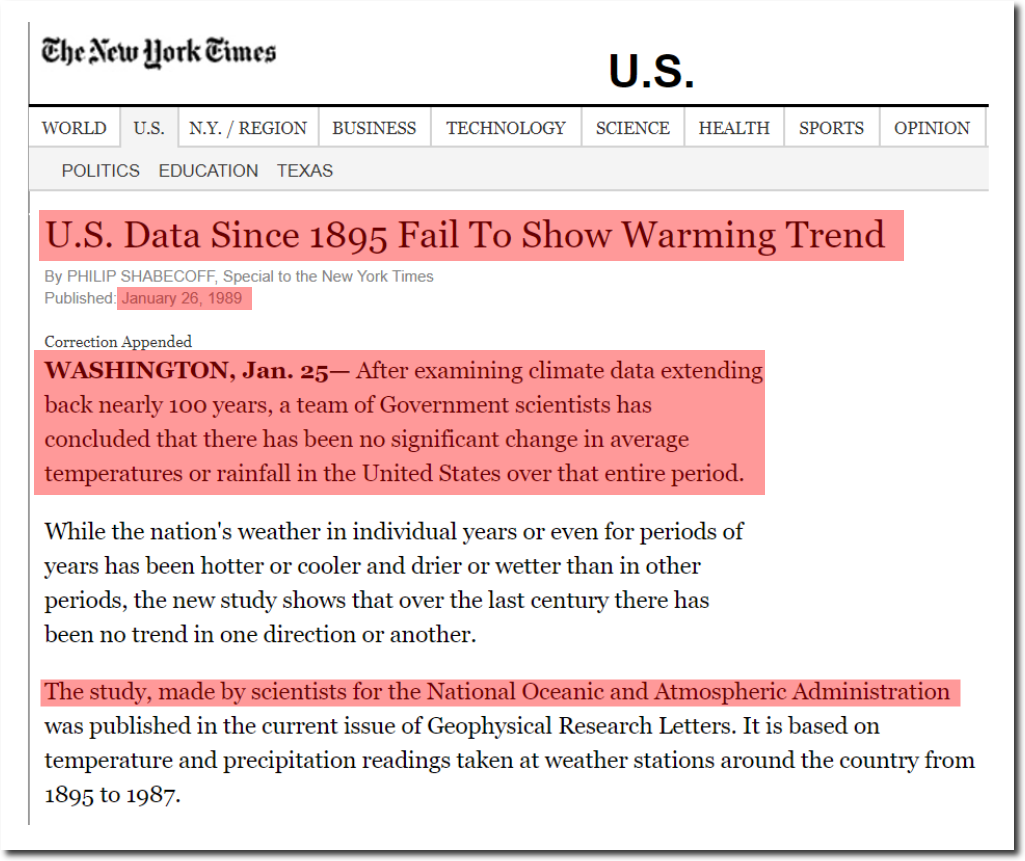
U.S. Data Since 1895 Fail To Show Warming Trend

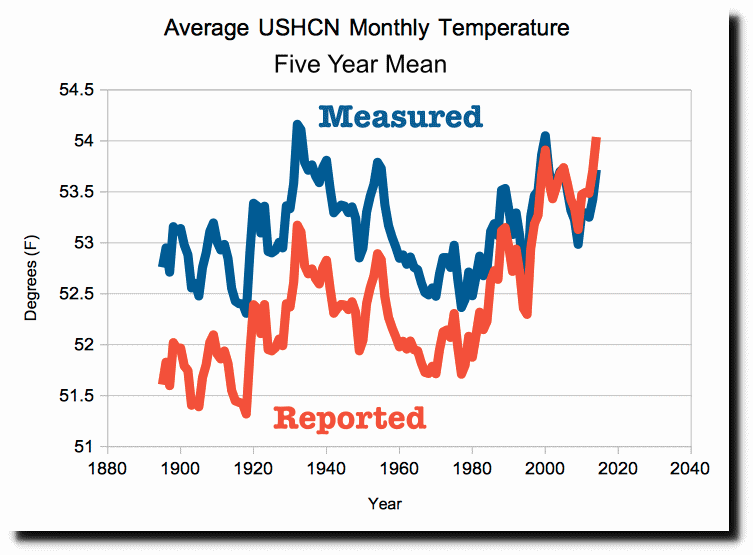
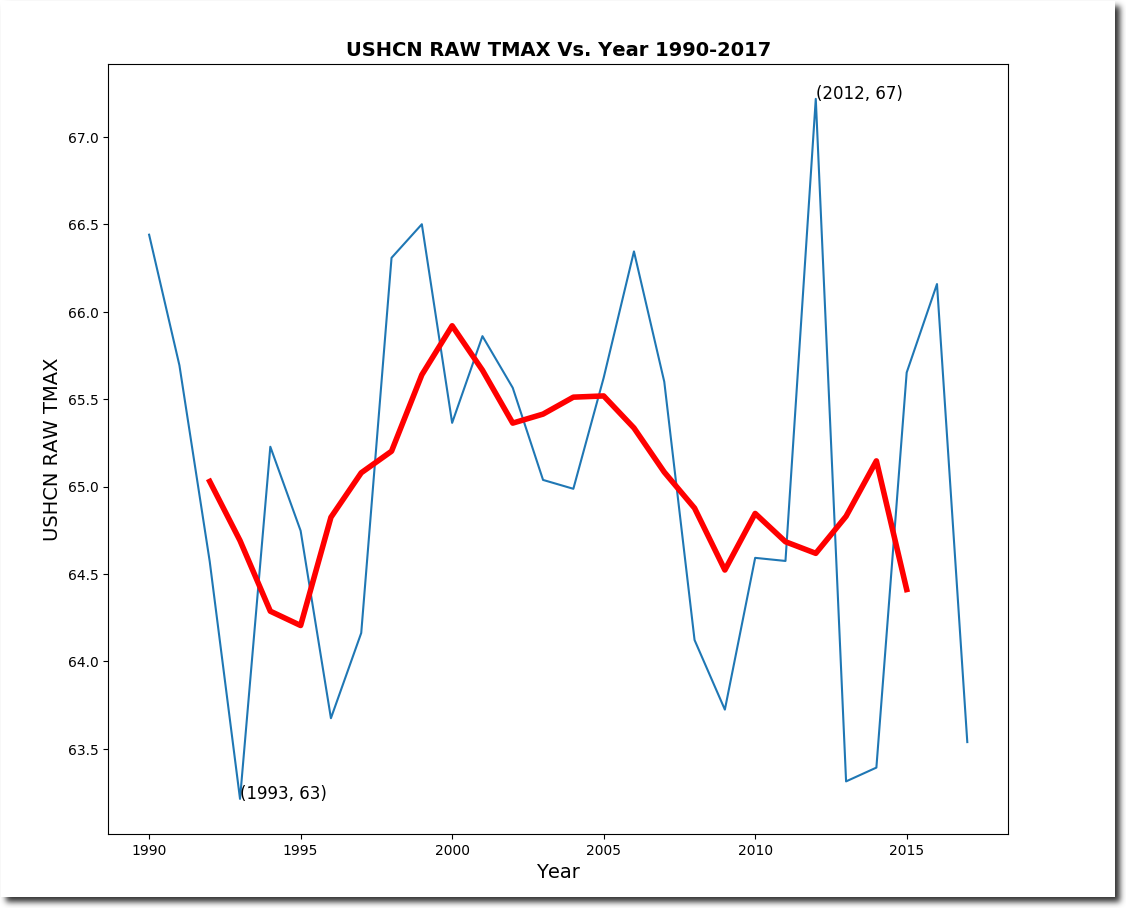
So what has been happening since 1990? The measured NOAA data shows no warming.
But the adjusted data shows a lot of warming.
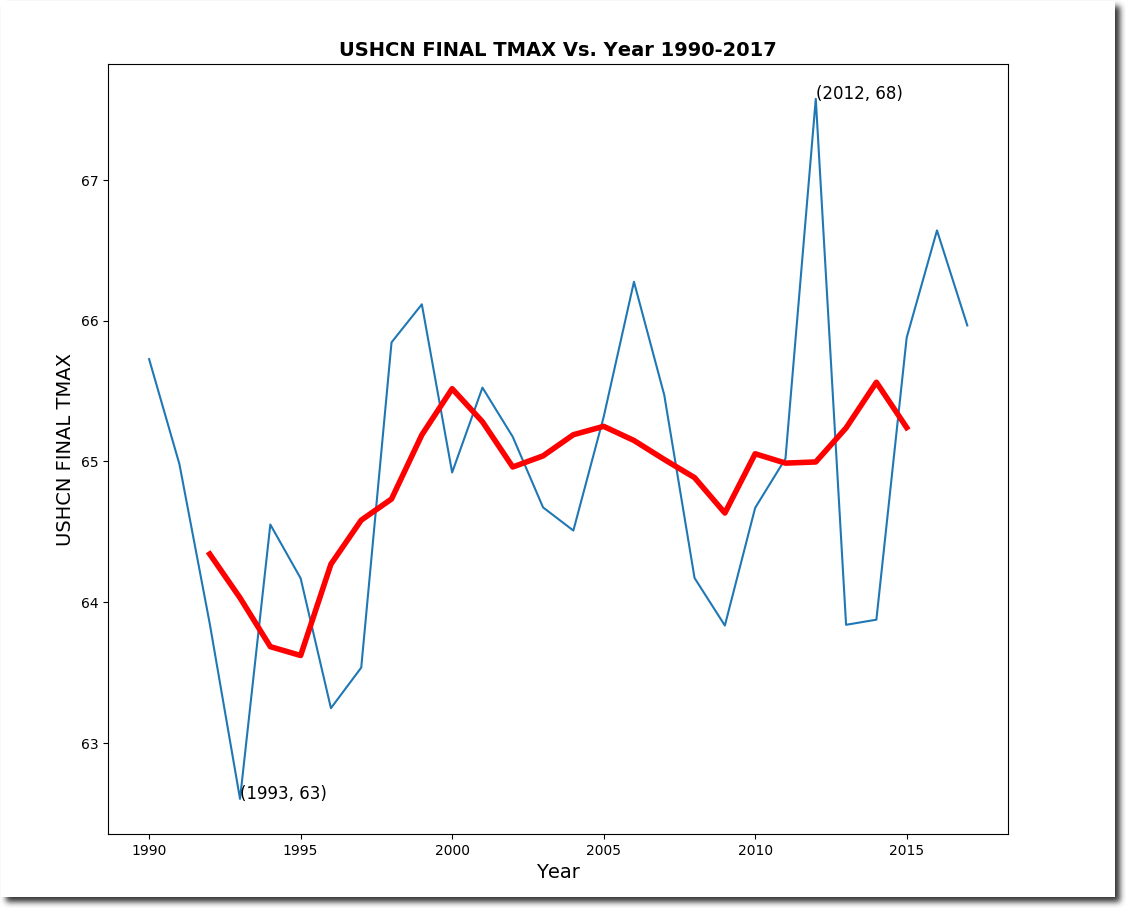
The adjustments form a familiar hockey stick of data tampering.
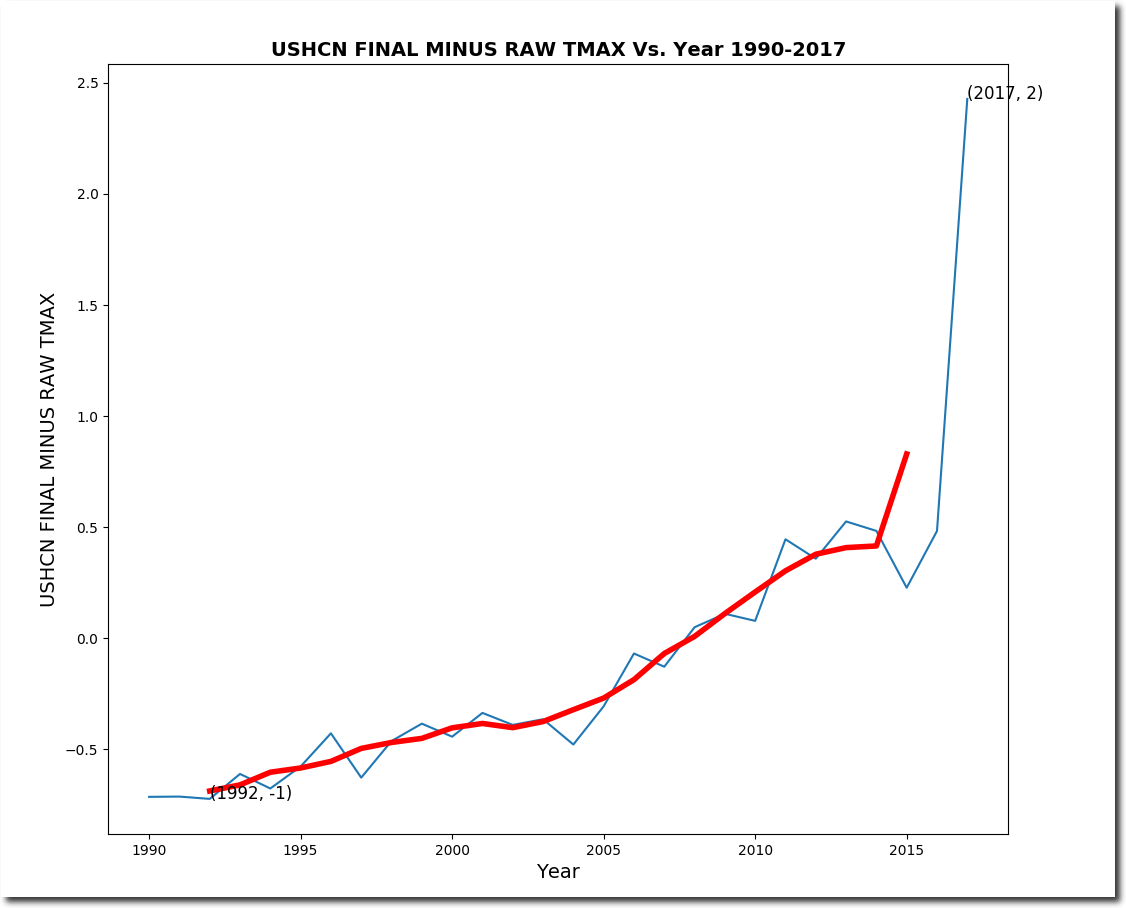
Let’s look at what NOAA is doing to make this happen. Since 1990, NOAA has been losing monthly temperature data at a phenomenal rate. When they don’t have real data, they simply make up fake data. Almost 50% of their “adjusted” data is now fake, but in 1991 it was only 16% fake.

I split up the NOAA adjusted (Final) data into two categories – “real” data has underlying thermometer data, and “fake” data has no underlying thermometer data. The “real” adjusted data shows very little warming.

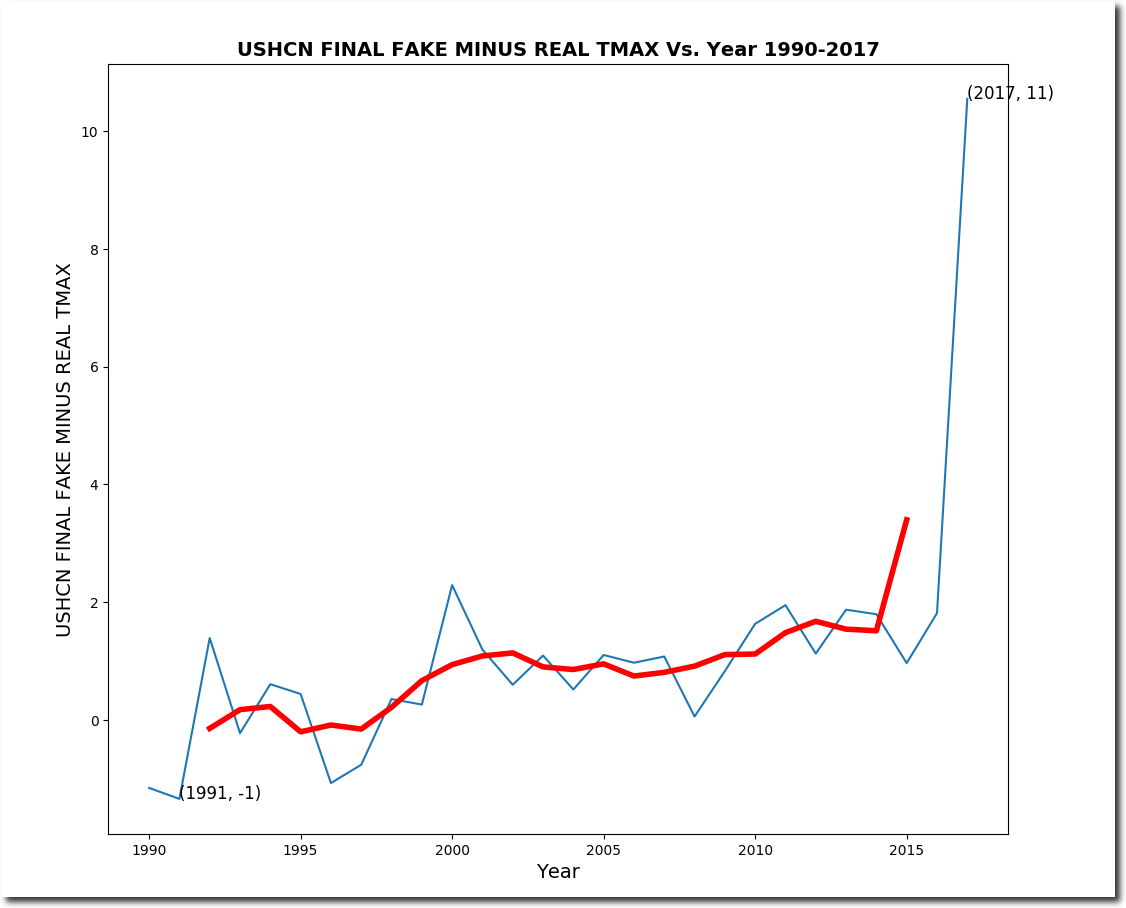
Bu the fake adjusted data shows lots of warming.

The infilling of fake adjusted data (no underlying thermometer data) corrupts the US temperature data in a spectacular hockey stick.
But it is much worse than it seems. The graph below plots the real adjusted (blue) and fake adjusted (red) trends for all 1200 USHCN stations. NOAA is consistently infilling missing cold temperatures with fake warm temperatures, across the board and across the country. How cynical can they get?
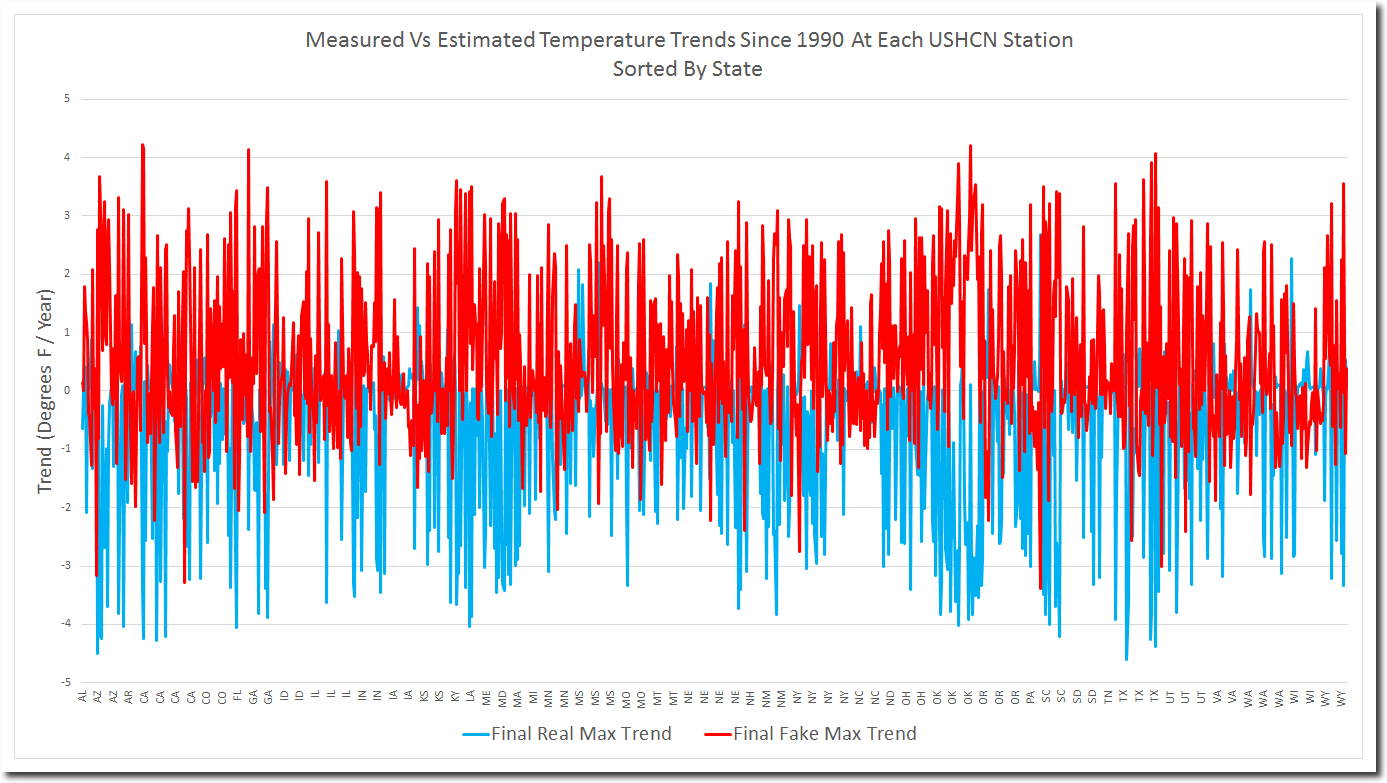
When confronted about their data tampering, they say “our algorithm works exactly as designed.”

In other words, the fraud is intentional. But I’m not done yet. The fraud is worse than it seems (if that is possible.)  Almost 50% of USHCN adjusted data is now fake, but they have only lost 25% of their data. So  they are throwing out a large percentage of their measured data.
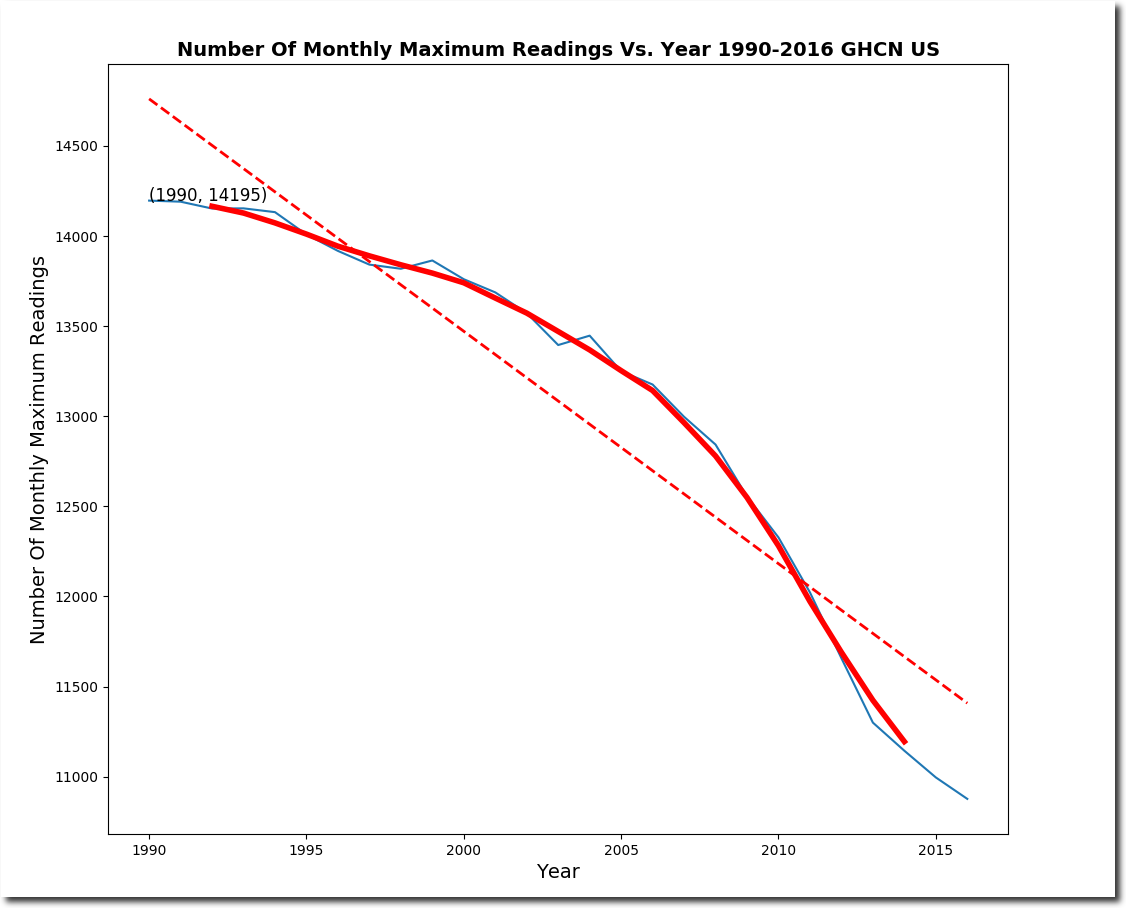
The next phase of my discovery process will be to find out what type of measured data they are throwing out and replacing with fake data. But it seems a safe bet that they are tossing measured cold data, and replacing it with fake hot data.

This is the biggest and most cynical scam in science history.

Posted in Uncategorized | Leave a comment

New UNHIDING THE DECLINE Release

Lots of new stuff, but the most noticeable is KML file generation for Google Earth

above_maximum_threshold_90.0_7141936.kml

Linux/Mac : python3 ghcn.py US.txt date=07141936

Windows : ghcn.exe US.txt date=07141936

Follow the directions here to get the latest.  First time Linux/Mac users will also have to  execute these lines from a terminal window.

python3 -m pip install matplotlib
python3 -m pip uninstall numpy
python3 -m pip install numpy==1.12.1

Posted in Uncategorized | Leave a comment

Arctic Fake News Update

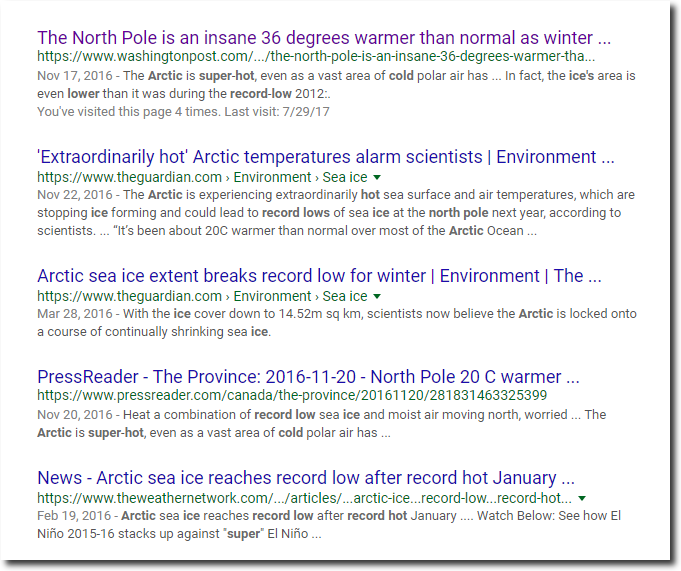
All year long, the criminals and useful idiots in the press have been telling us how hot the Arctic is, and ice extent is at a record low.

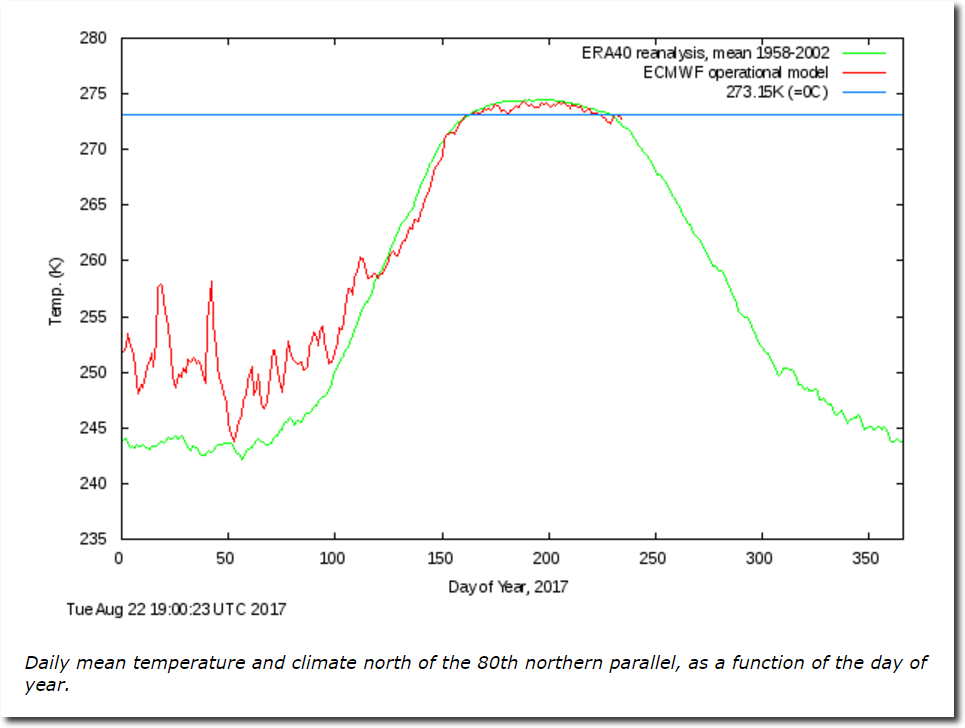
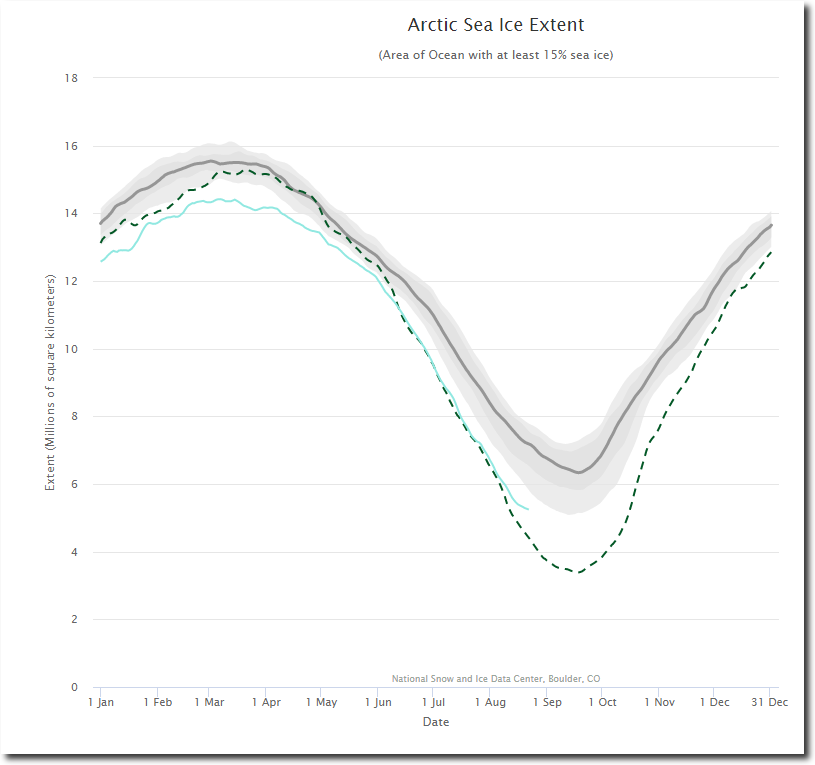
The actual North Pole was below normal temperature every single day during the melt season, and appears headed for the highest summer minimum extent in years.

Ocean and Ice Services | Danmarks Meteorologiske Institut

Charctic Interactive Sea Ice Graph | Arctic Sea Ice News and Analysis

The press will of course be silent about this information, because they are Orwellian fake news. 97% of all climate stories are 100% fake, and the other 3% are 97% fake.

Posted in Uncategorized | Leave a comment

Why They Need To Hide The 1940’s Blip

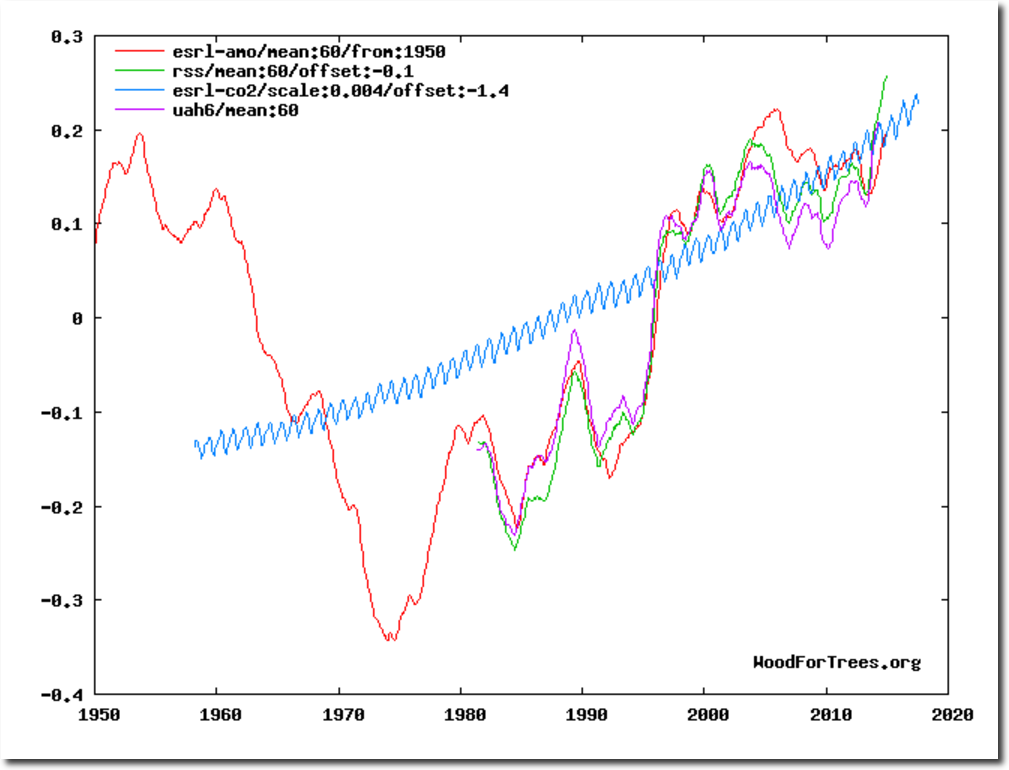
Troposphere temperatures show very close correlation with the Atlantic Multidecadal Oscillation (AMO) and essentially no correlation with CO2.

Wood for Trees: Interactive Graphs

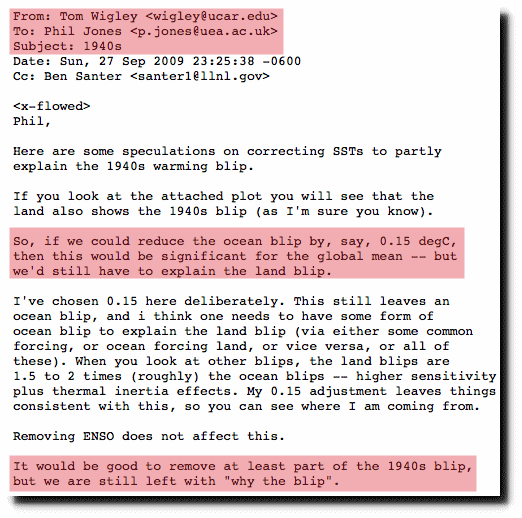
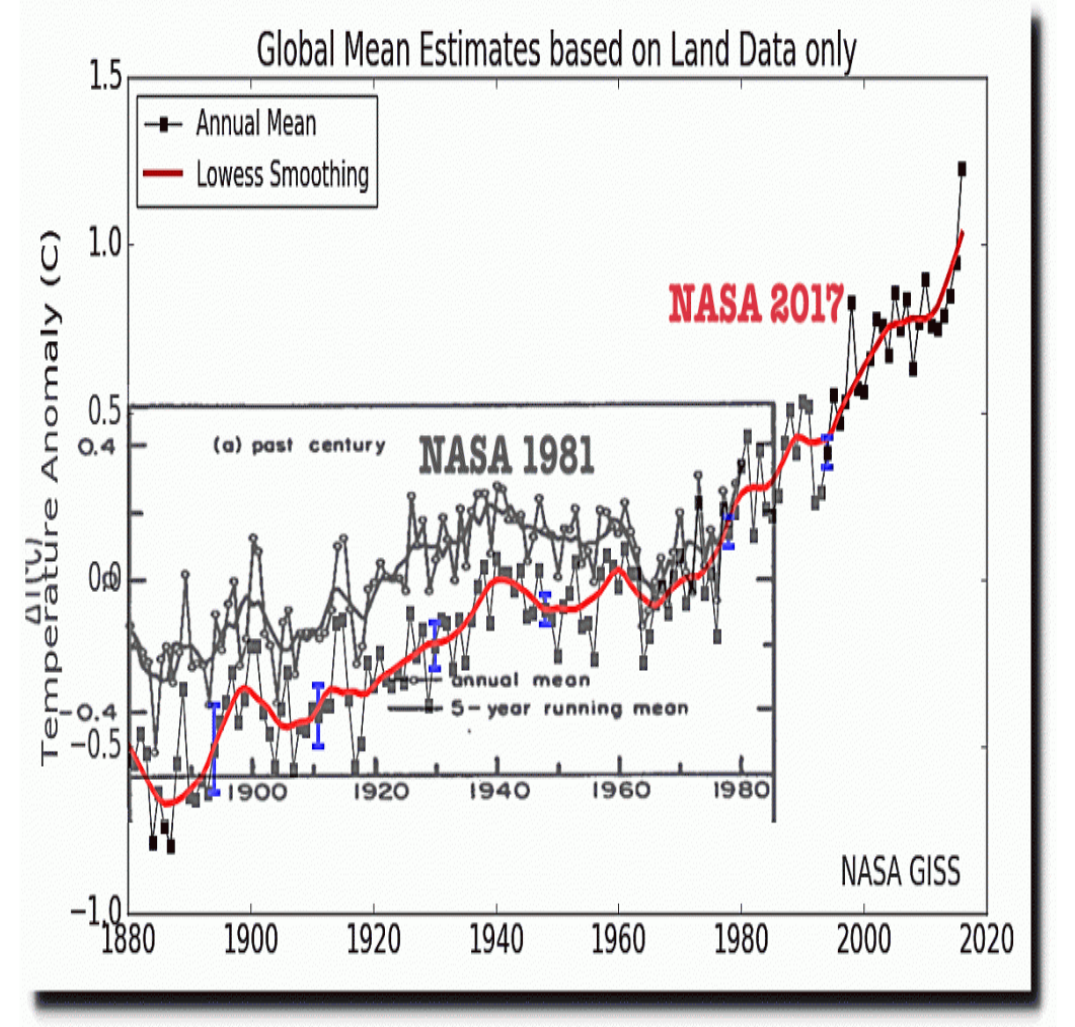
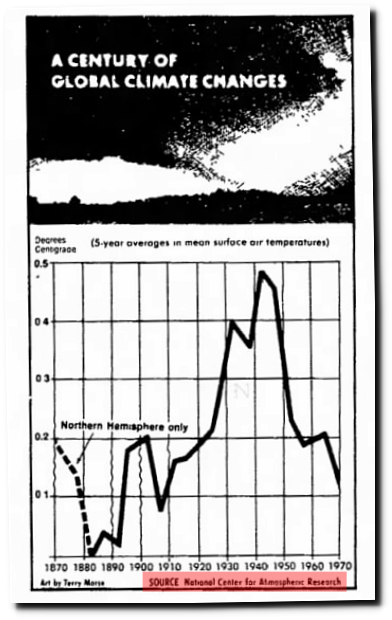
That is why government agencies have worked so hard to remove the 1940s blip.

di2.nu/foia/1254108338.txt

1981 version     2017 version

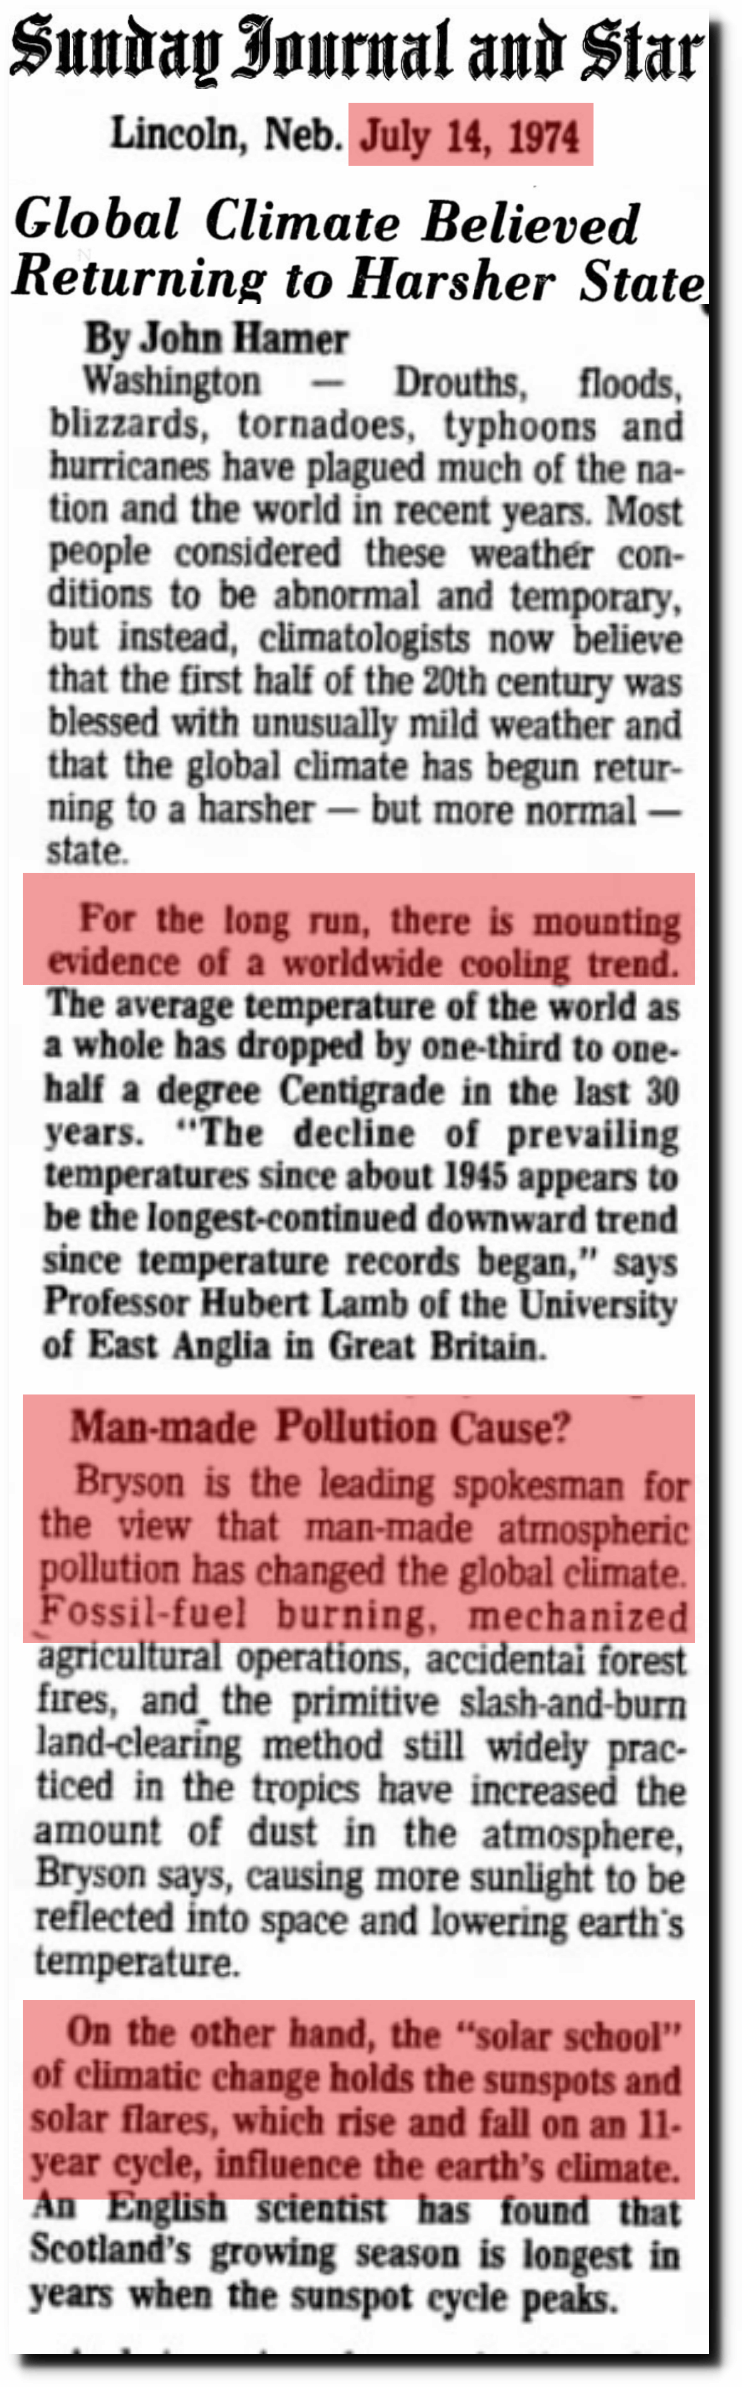
14 Jul 1974, Page 1 – Lincoln Evening Journal at Newspapers.com

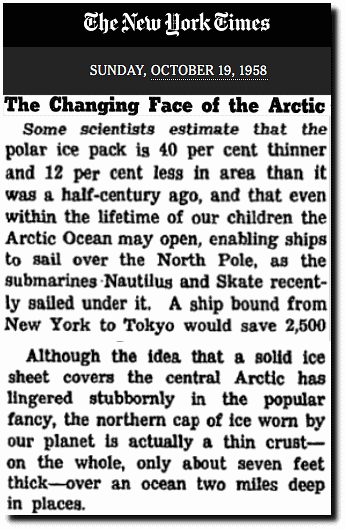
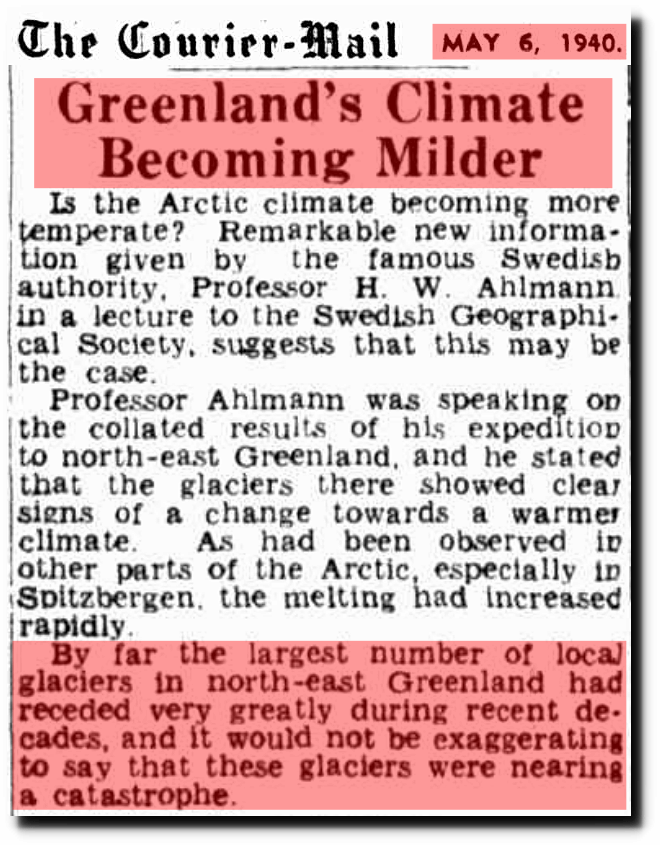
If they didn’t hide the blip, it would become obvious that Earth was probably warmer in the 1940’s than it is now, and that global temperatures have almost nothing to do with CO2.

The Changing Face of the Arctic; The Changing Face of the Arctic – The New York Times

06 May 1940 – Greenland’s Climate Becoming Milder 

Billions of dollars in climate scam funding depends on fake temperature graphs from NASA and NOAA.

Posted in Uncategorized | Leave a comment

Plummeting August 22 Temperatures In The US

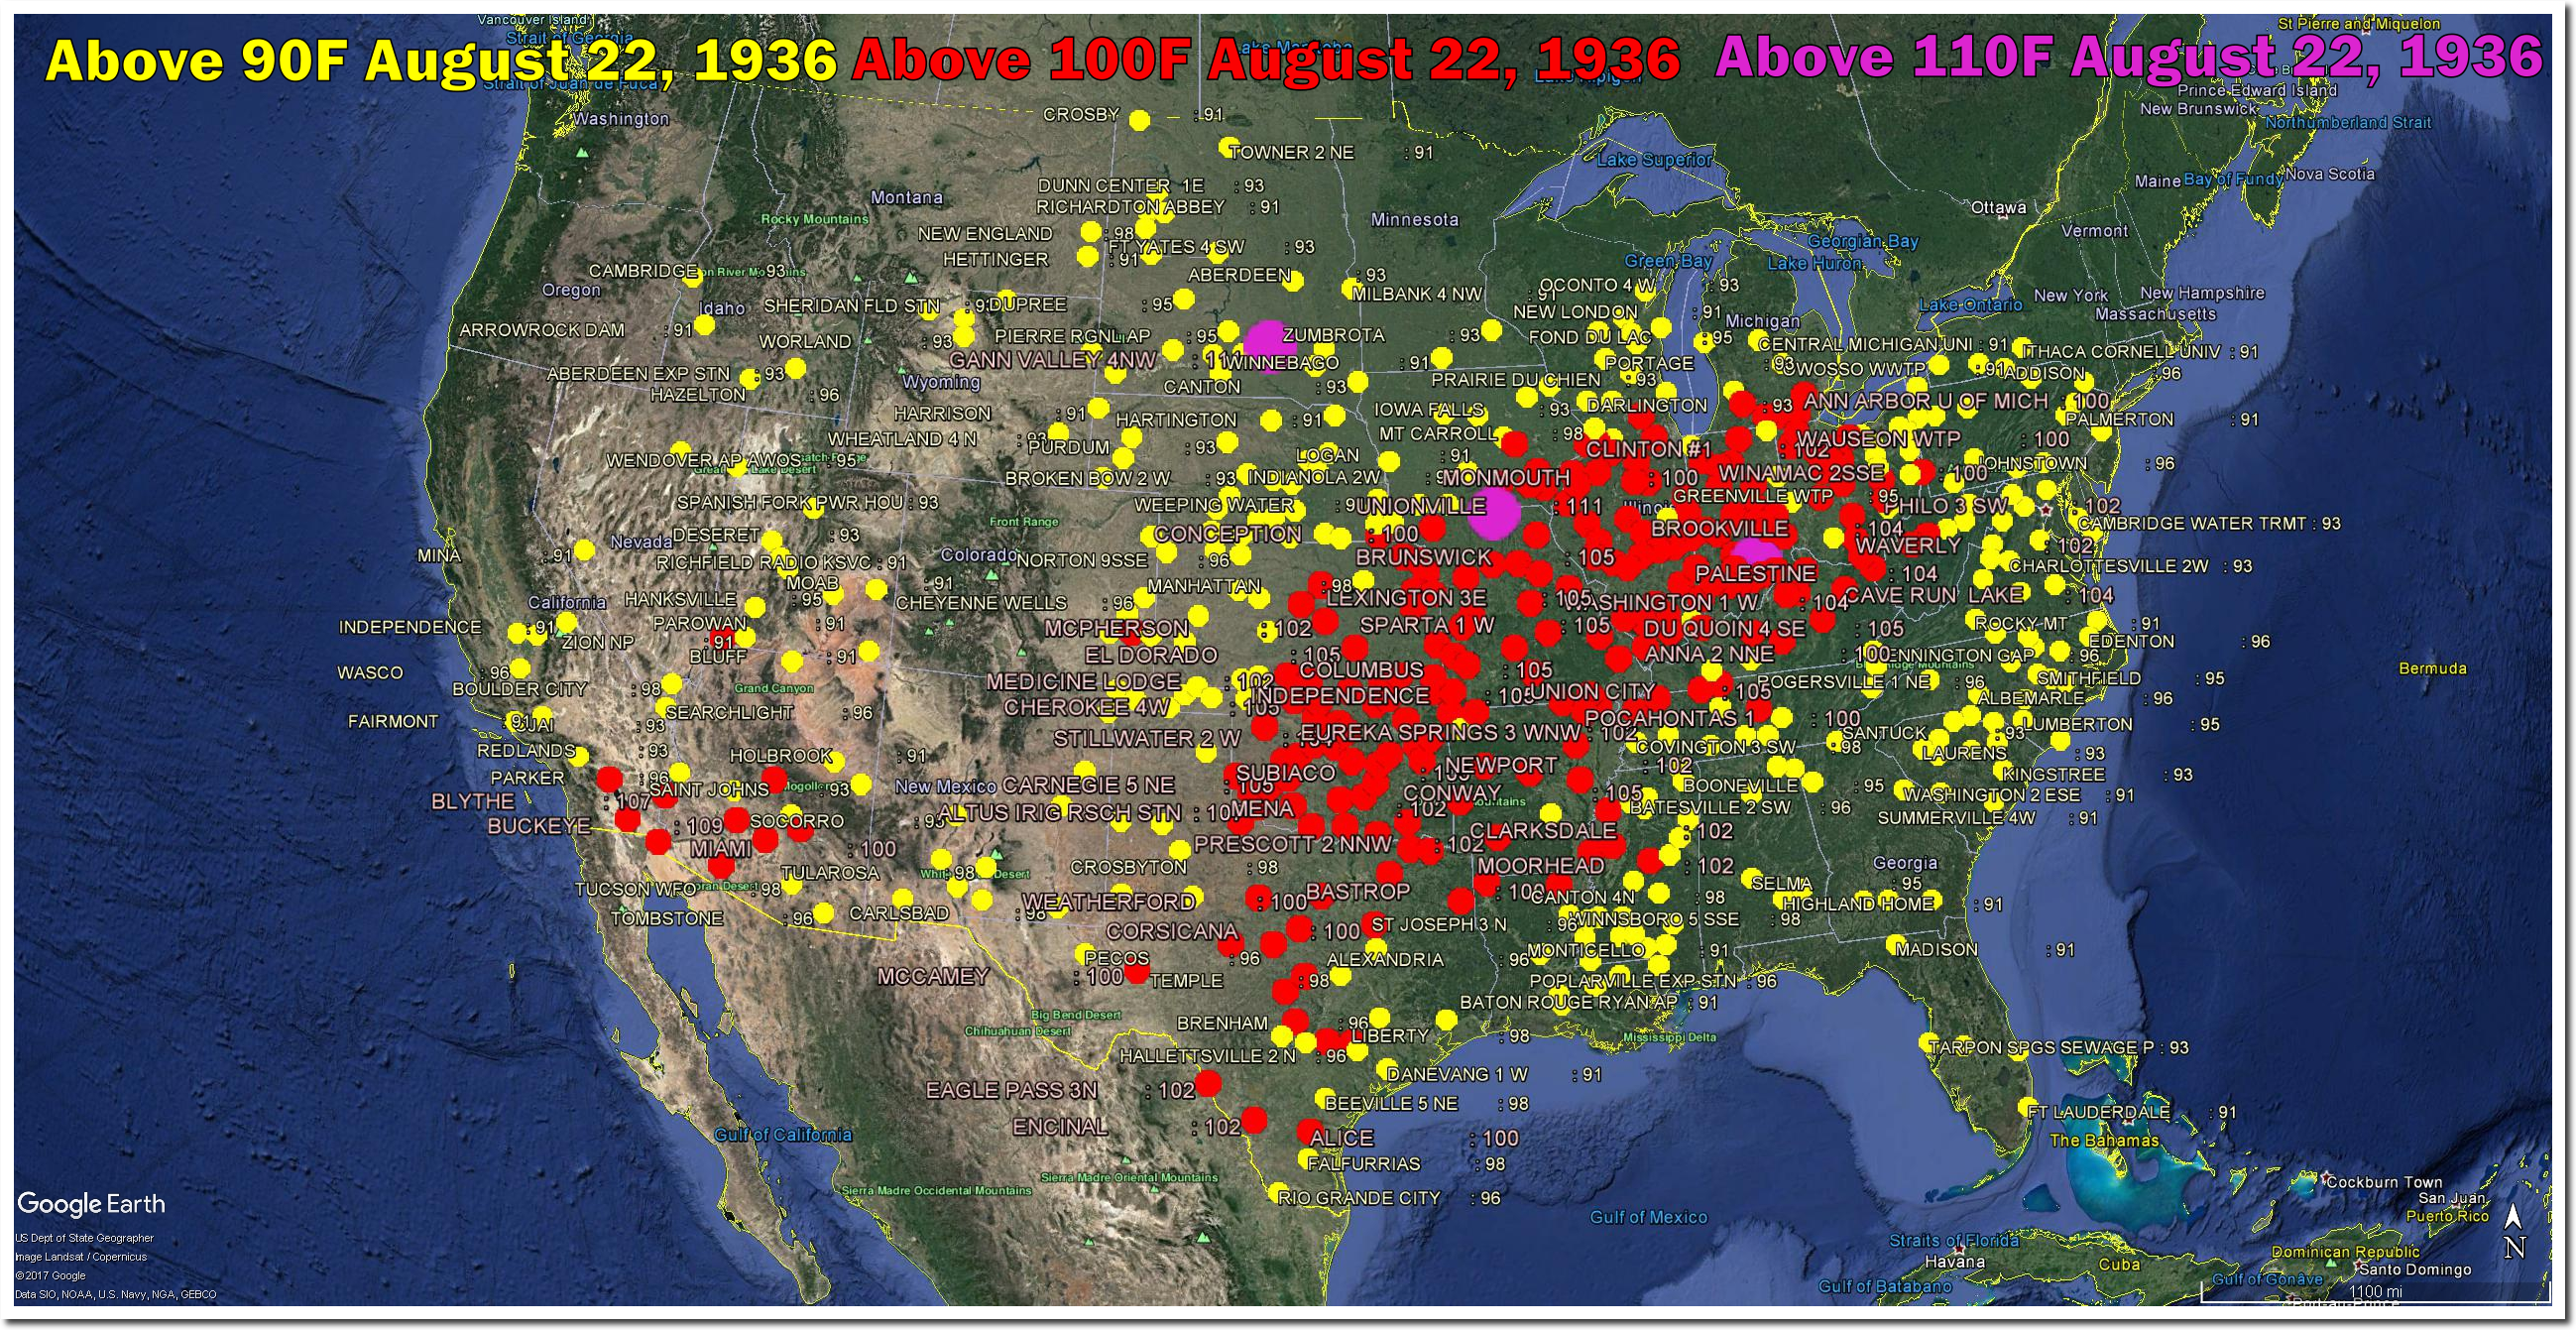
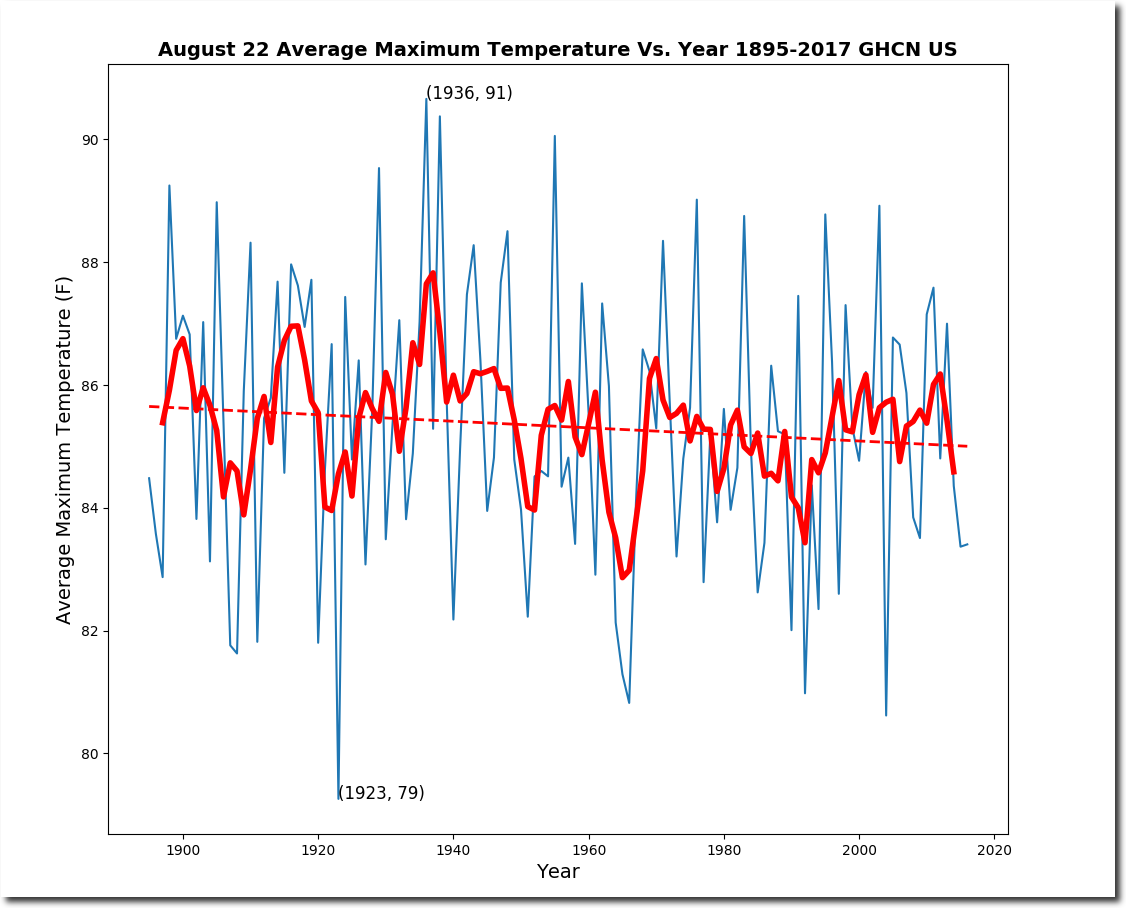
On this date in 1936, much of the US was over 100F. South Dakota, Missouri and Indiana were over 110F.

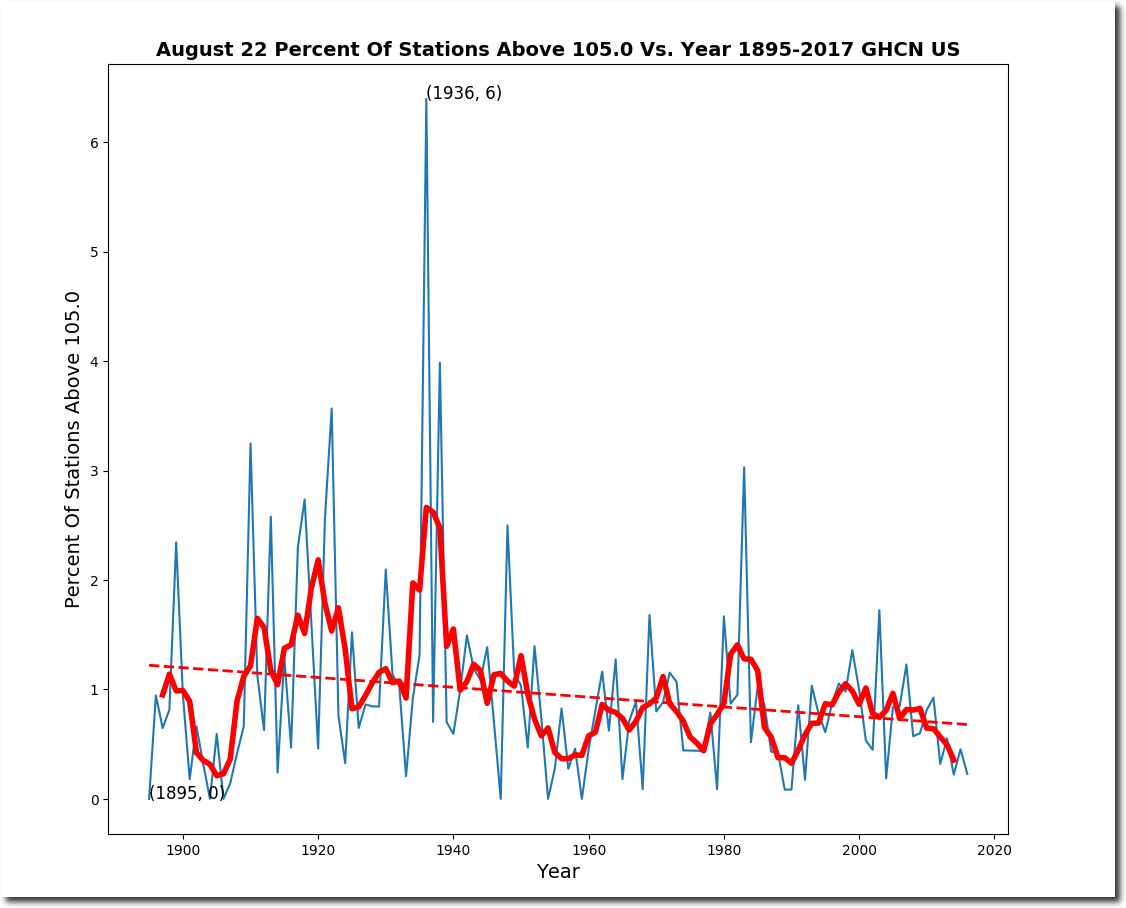
The US August 22 average maximum temperature has been dropping steadily since the 19th century, and the frequency of very hot readings has plummeted.

The last really hot August 22 in the US occurred over 30 years ago, in 1983.

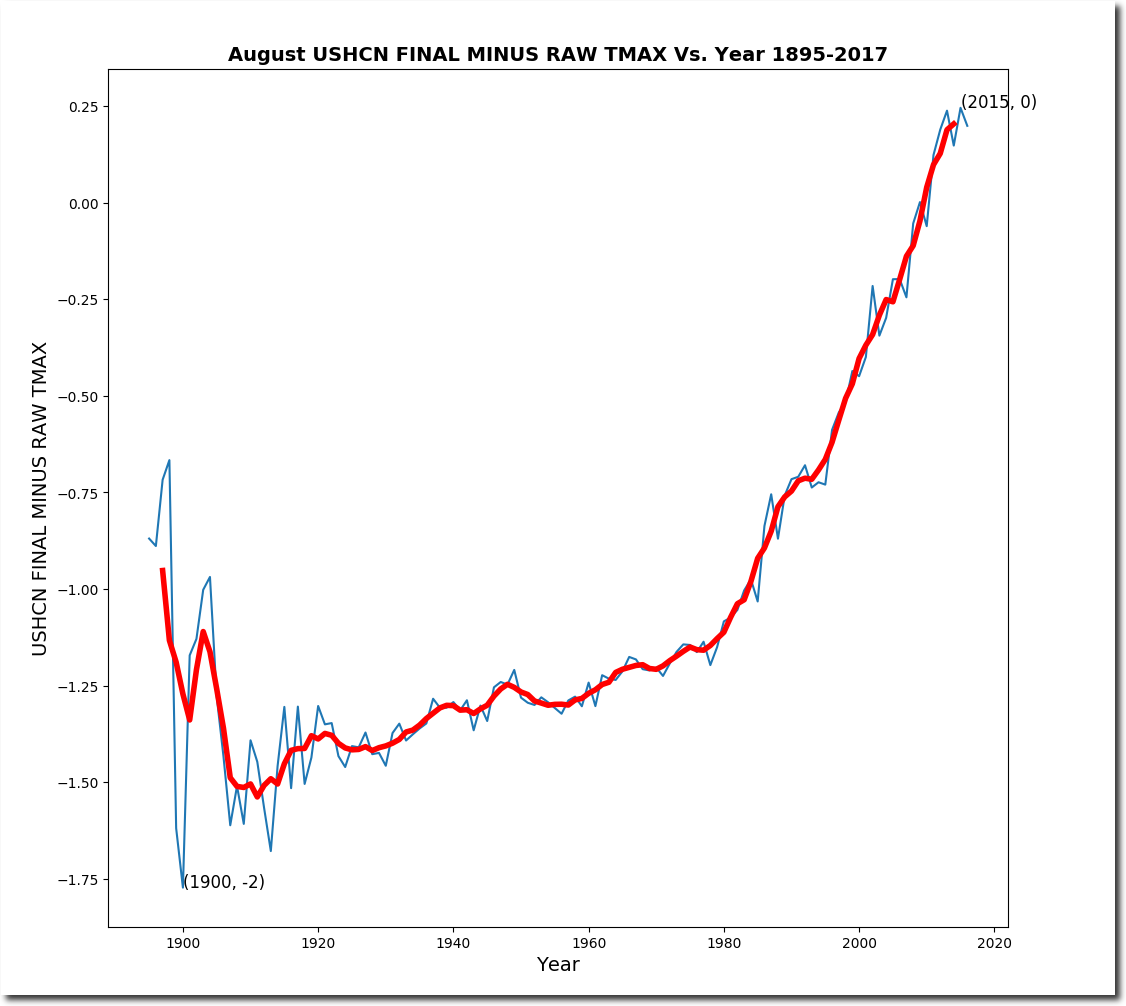
Government agencies pushing global warming propaganda certainly don’t want you to know this sort of information, so they massively tamper with the temperature data to cool the past and warm the present.

All of this information is directly from US government data. Even someone with extremely low skills like Mosher can reproduce it.

Posted in Uncategorized | Leave a comment

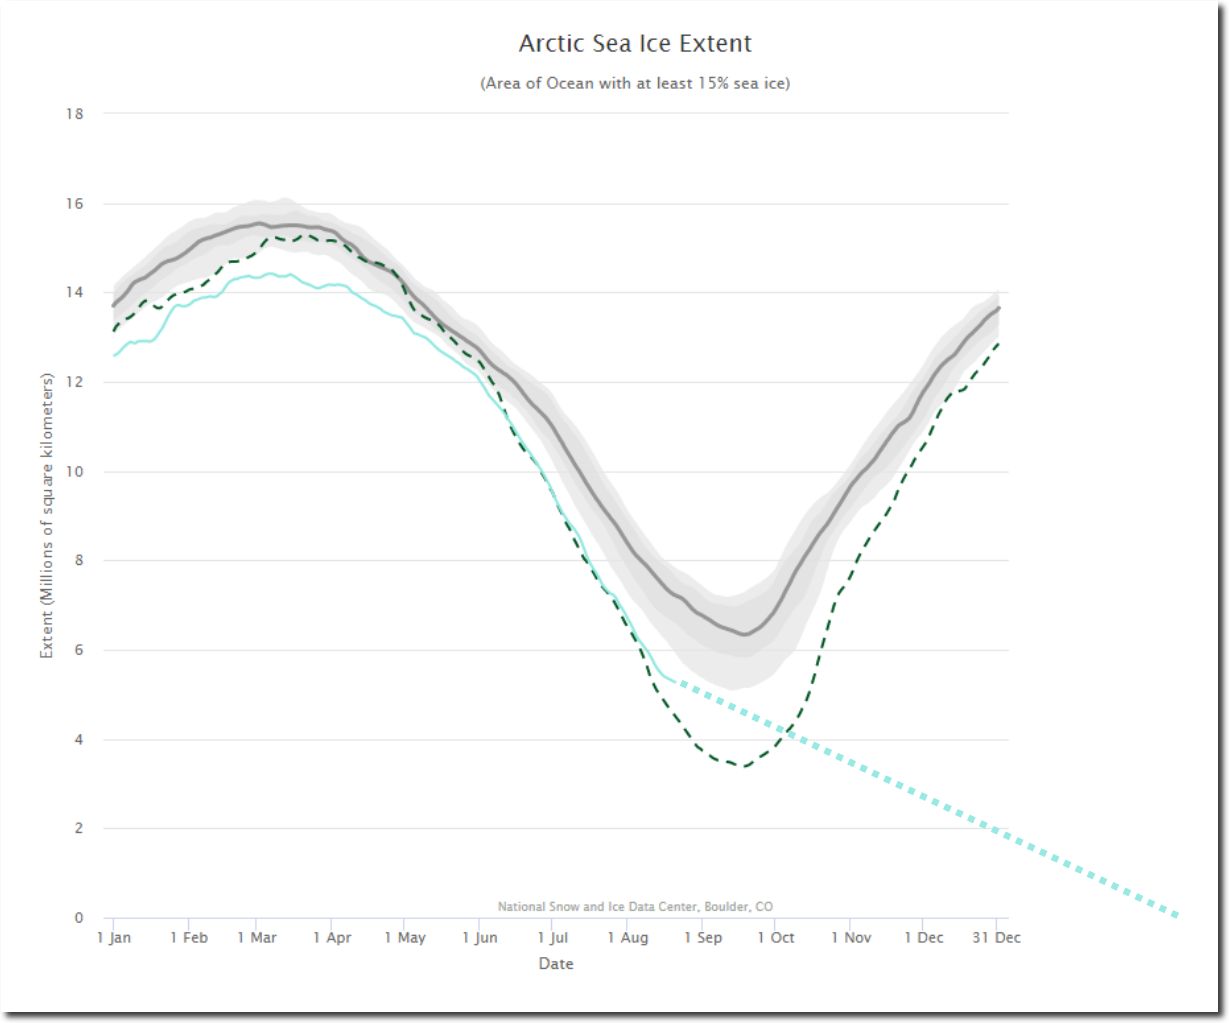
Improved Ice-Free Arctic Forecast

Settled science requires constant changes, and I have again updated my ice-free Arctic forecast. It now uprears the Arctic won’t be ice-free until springtime.

Charctic Interactive Sea Ice Graph | Arctic Sea Ice News and Analysis

Climate alarmists were placing their hopes that winter-like storms in August would break up the ice this year like they did the previous two years – thus saving them from total embarrassment. But as I have been pointing out that approach is not only deceptive – but bad science.

The last two summers, Arctic alarmists got very lucky when late summer winter-like storms broke up the ice in the Chukchi and Beaufort Seas. But the longer term impact of those storms is that they cooled the deeper waters of those two seas, making it harder to melt the ice this summer.

Posted in Uncategorized | Leave a comment

Erasing The Heat Of 1901

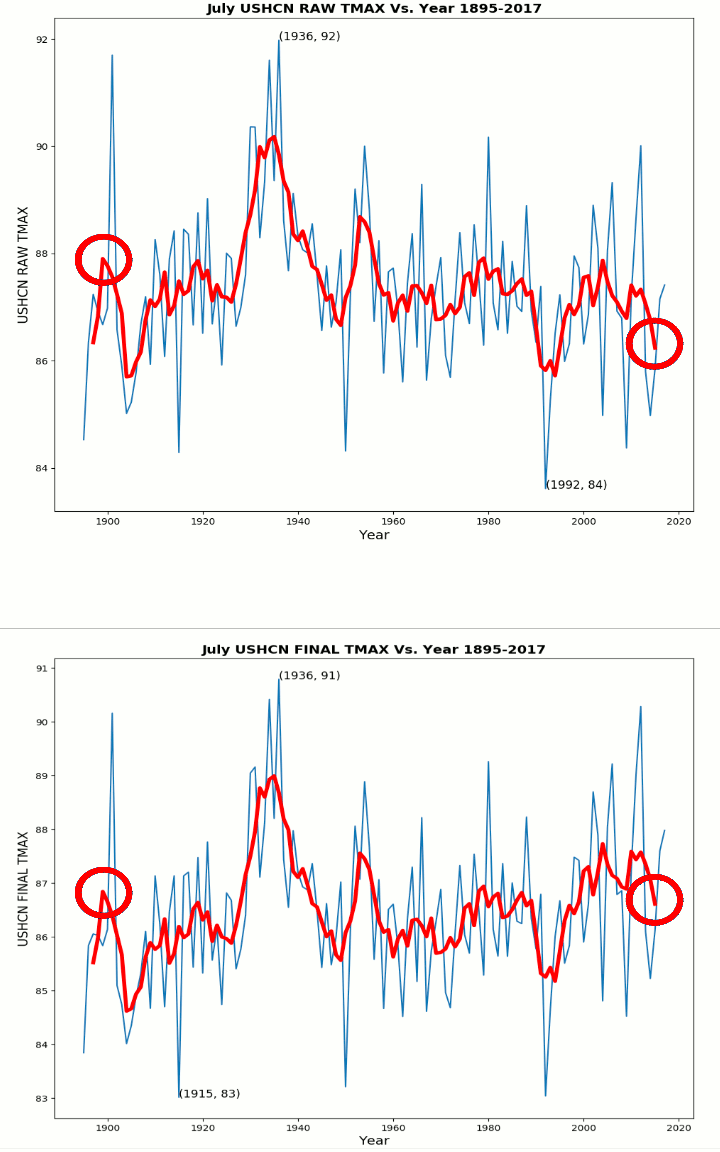
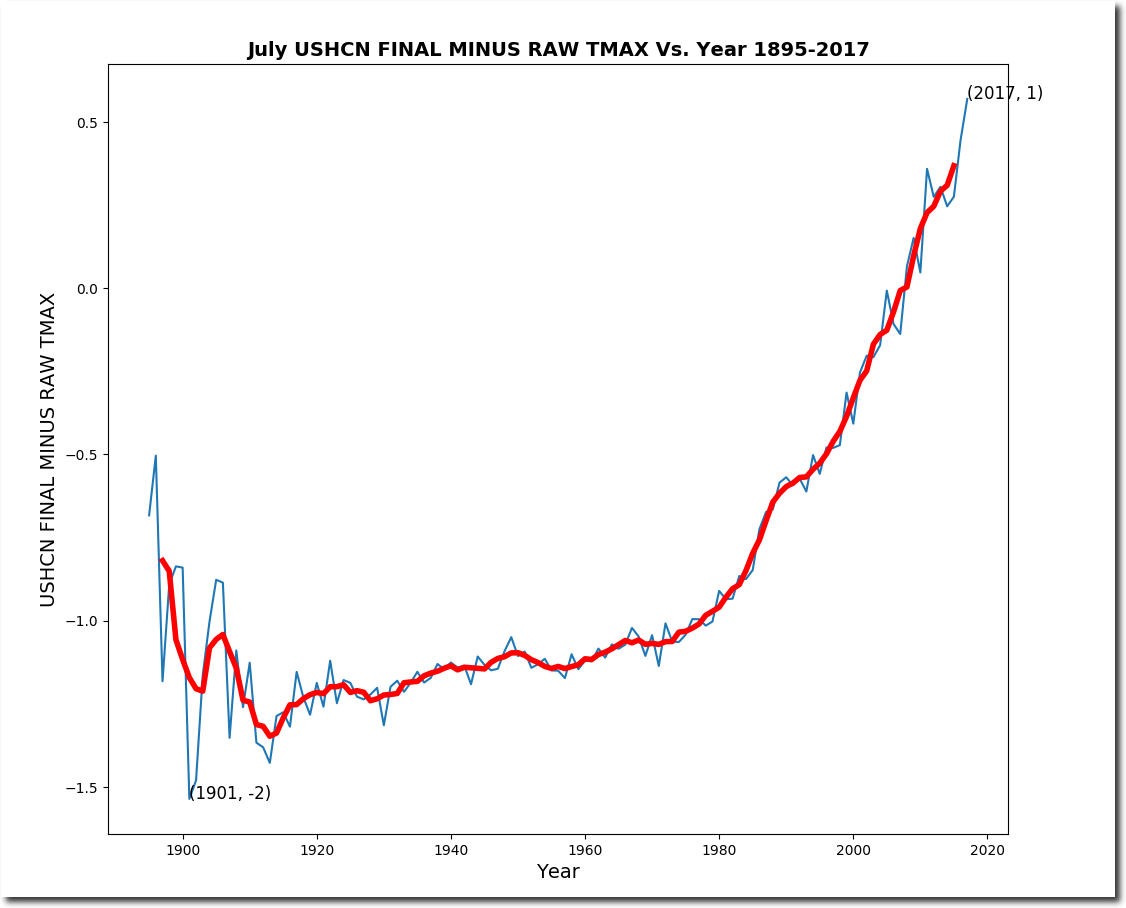
I frequently write about NOAA erasing the heat of the 1930s, but even more impressive is their data tampering from 1901. Prior to data tampering, July 1901 was the second hottest July on record in the US.

In order to hide the decline in July temperatures, NOAA cools July 1901 by 1.5 degrees, and warms July, 2017 by 0.6 degrees.

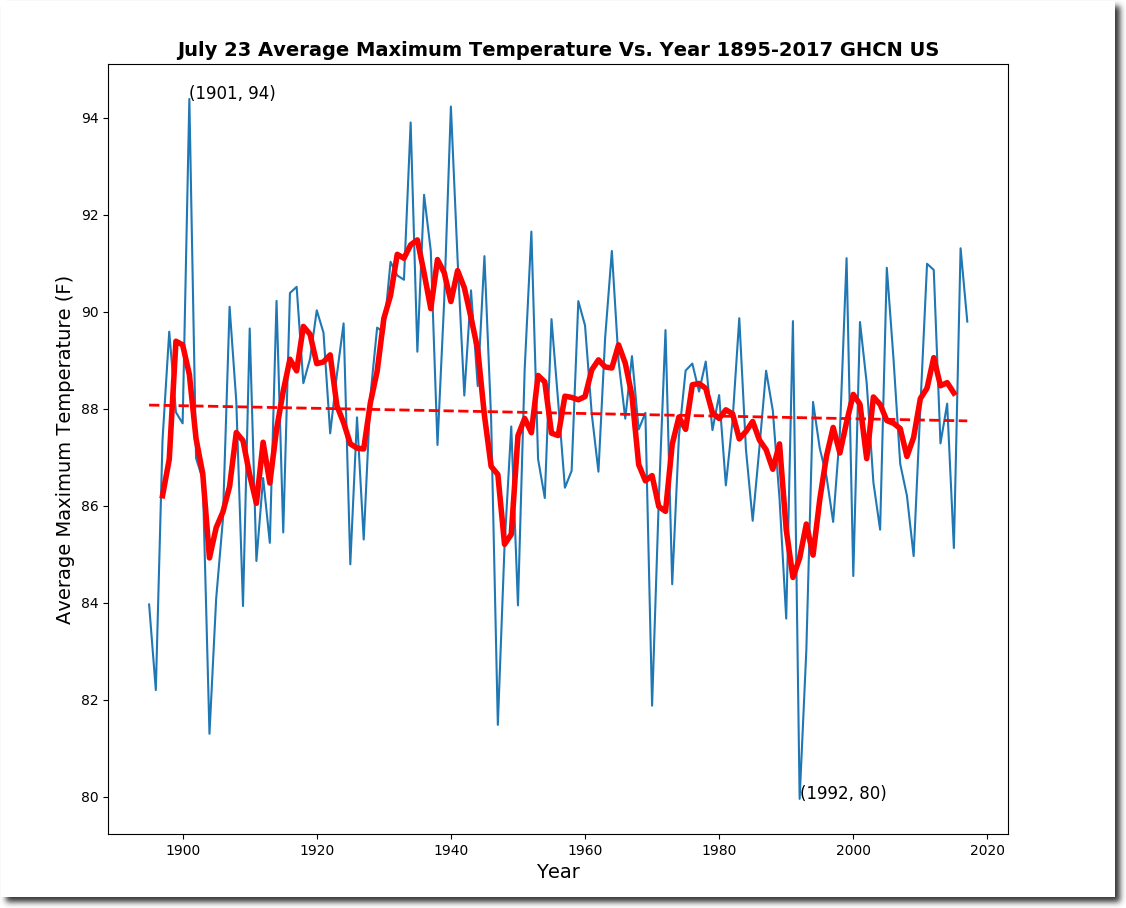
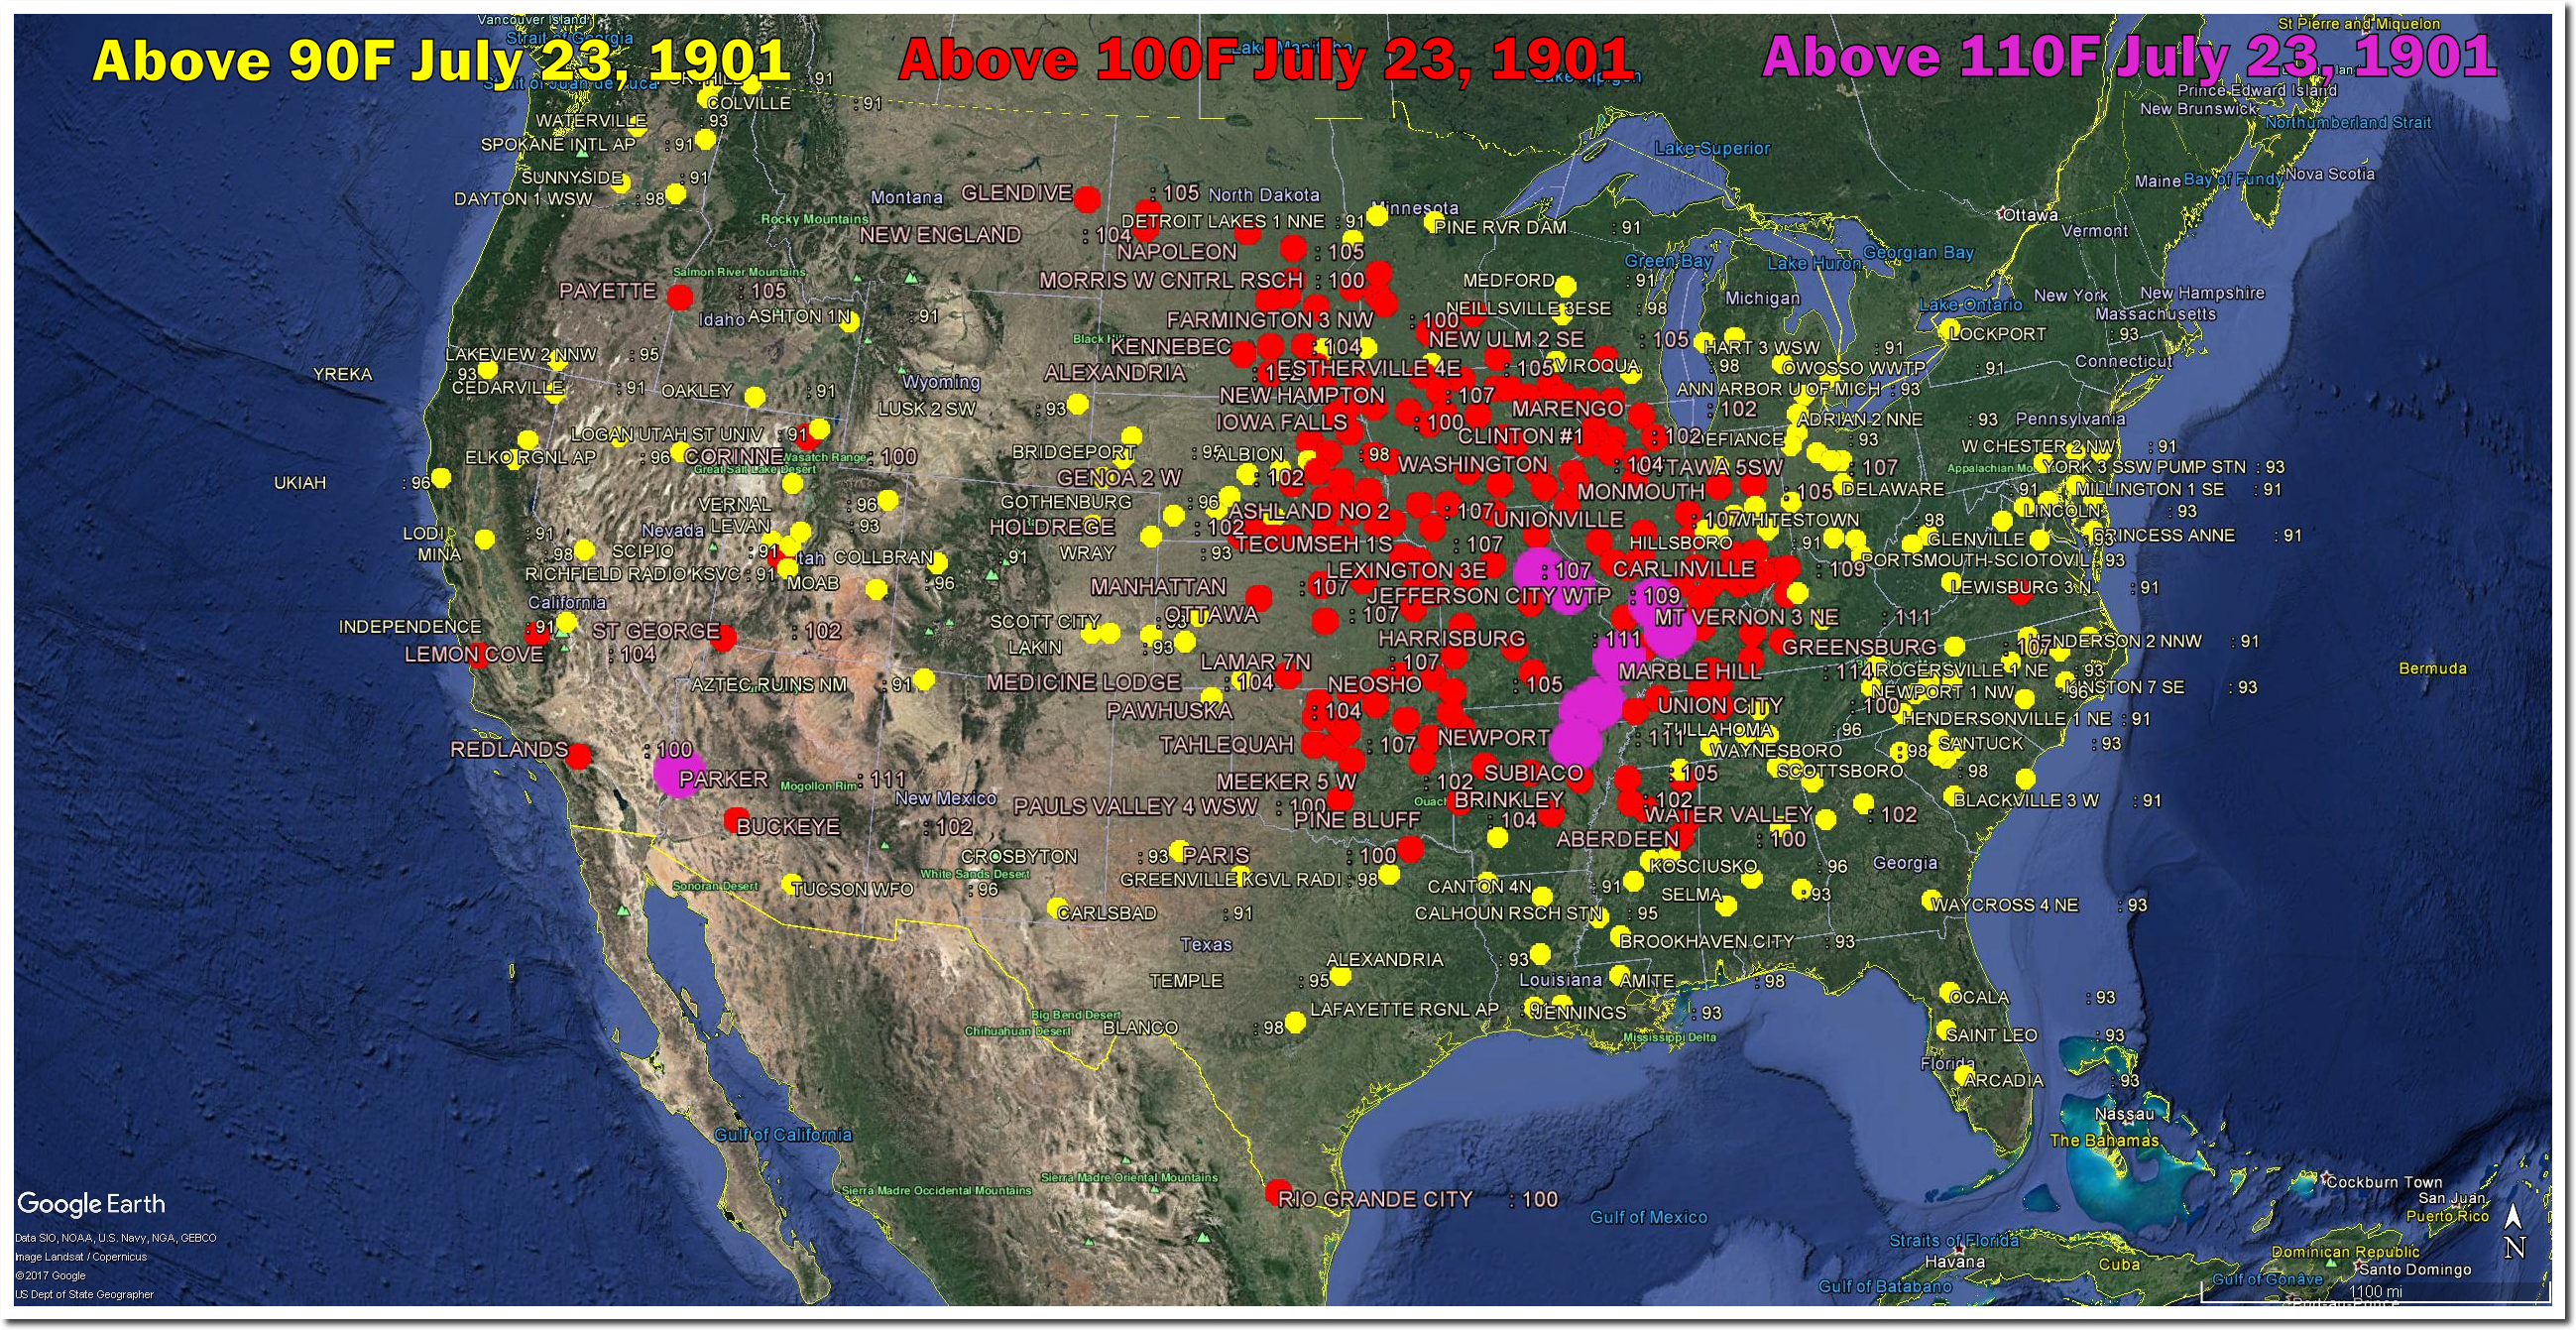
July 23, 1901 was one of the hottest days on record in the US – averaging 94 degrees across the country.
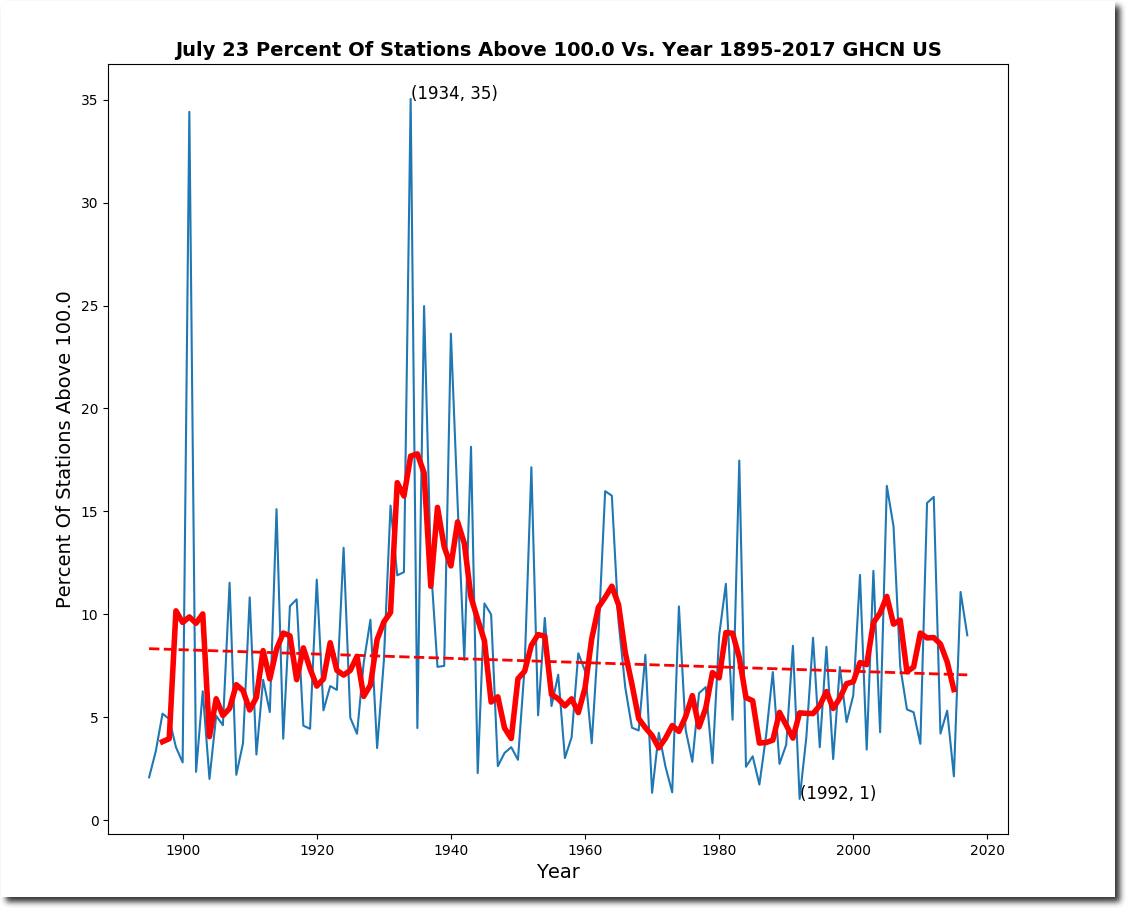
More than one third of the country was over 100F that day.
A large portion of the Midwest was over 110F on July 23, 1901

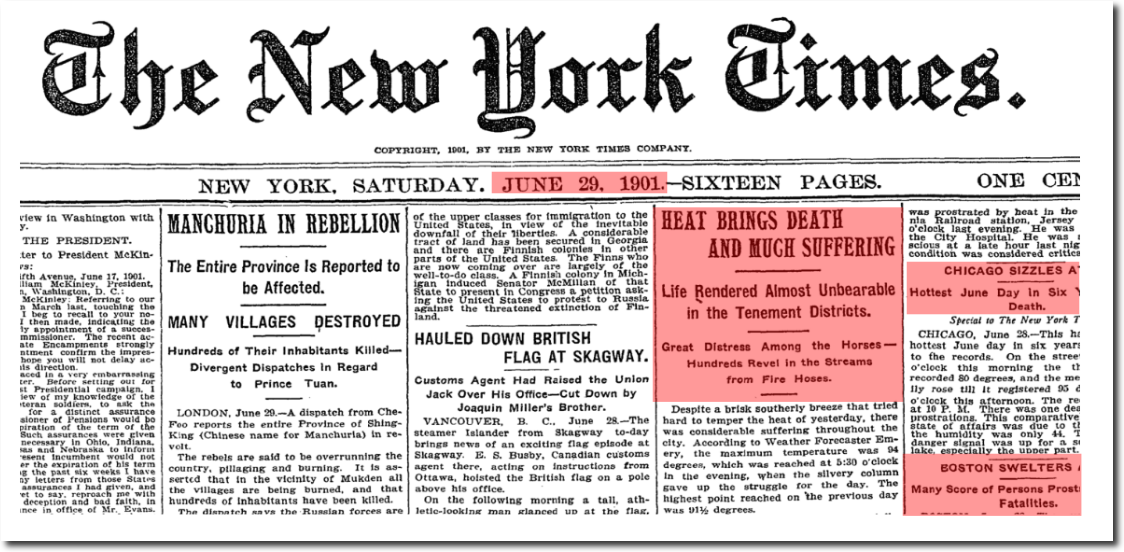
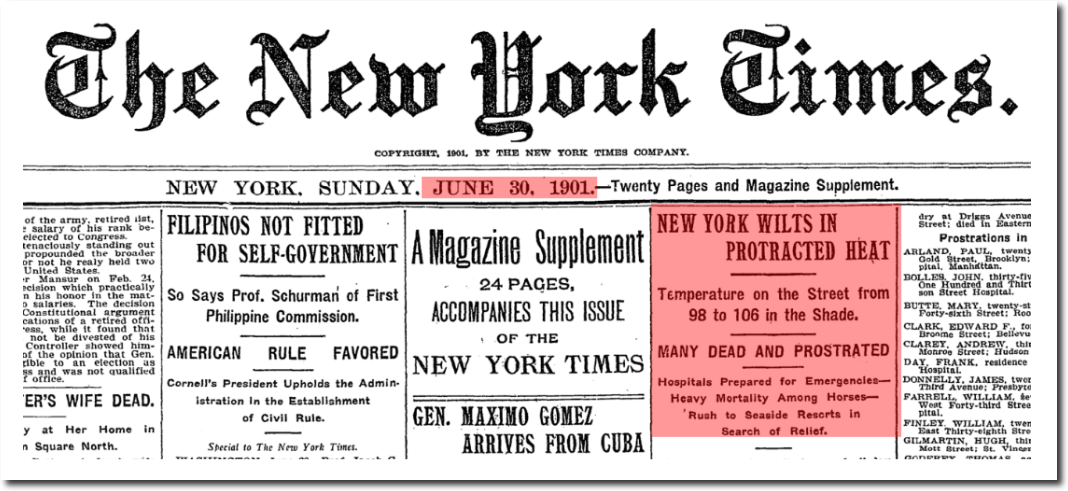
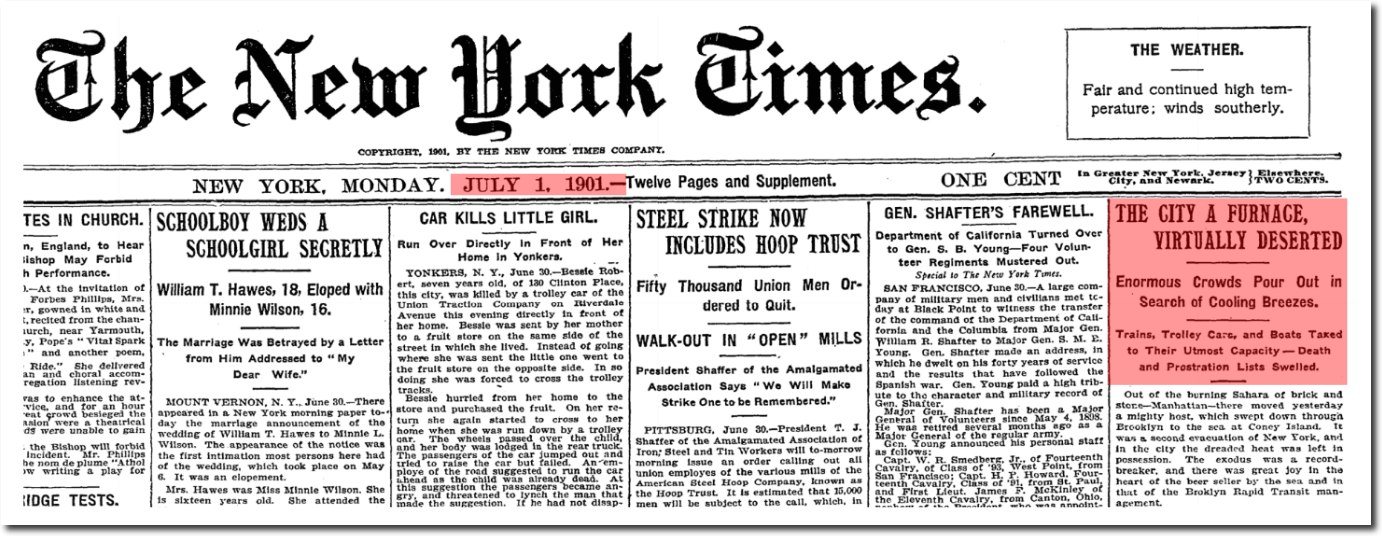
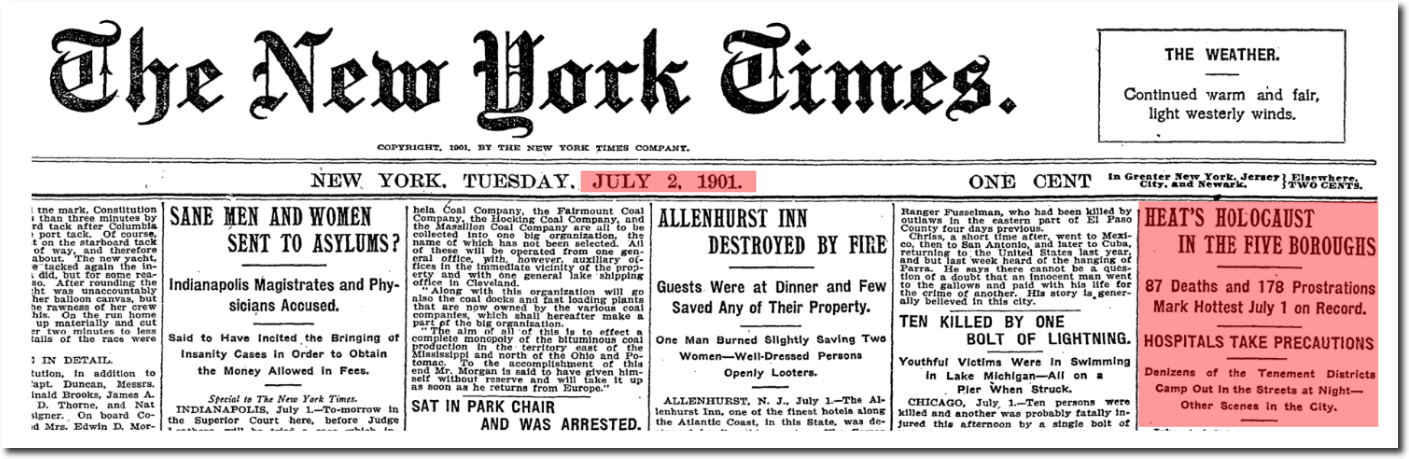
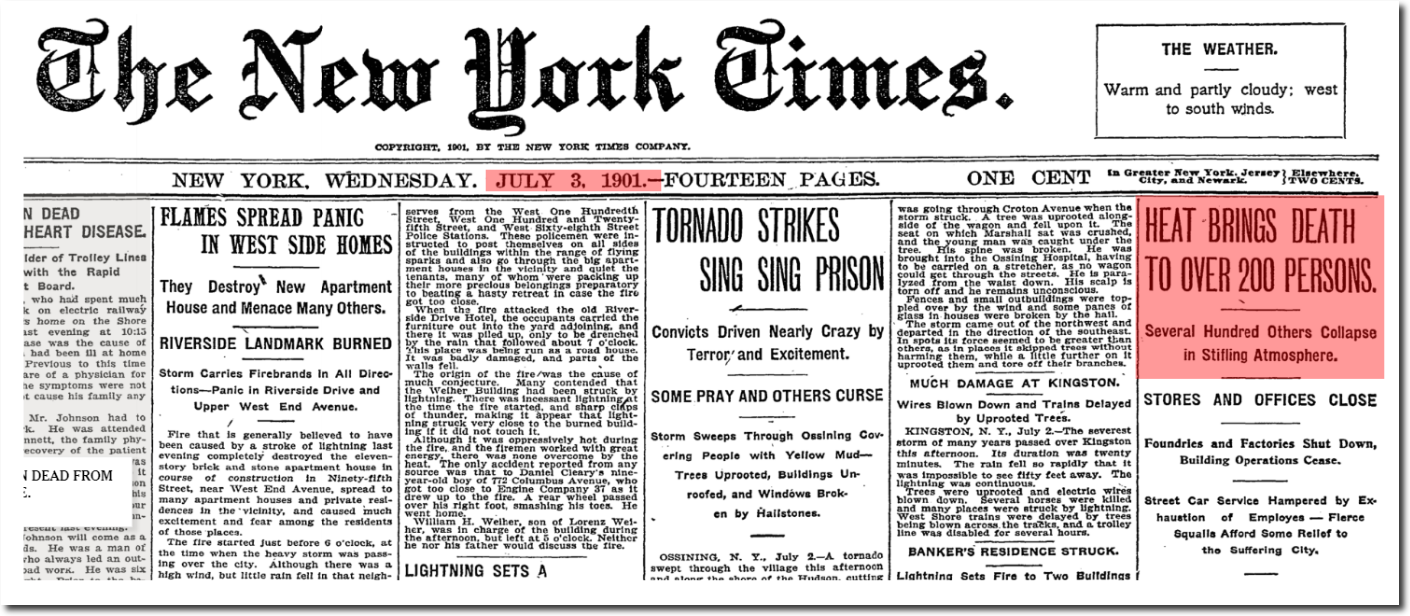
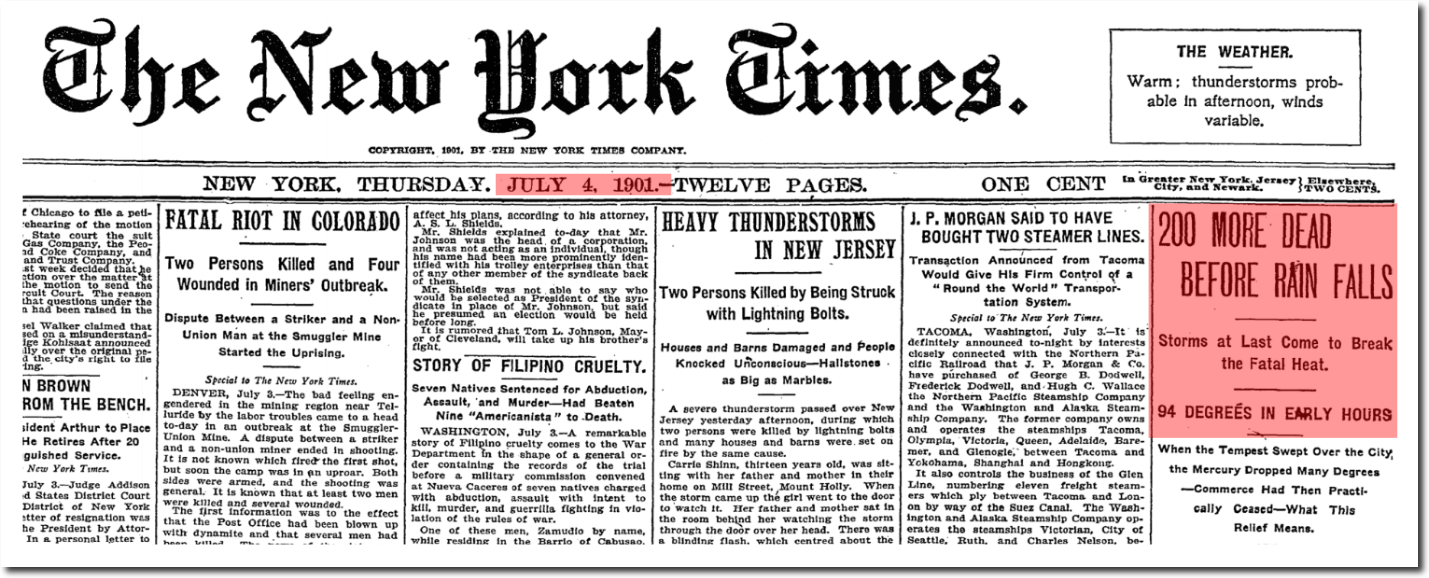
The New York Times headlines from the 1901 heatwave were quite remarkable.

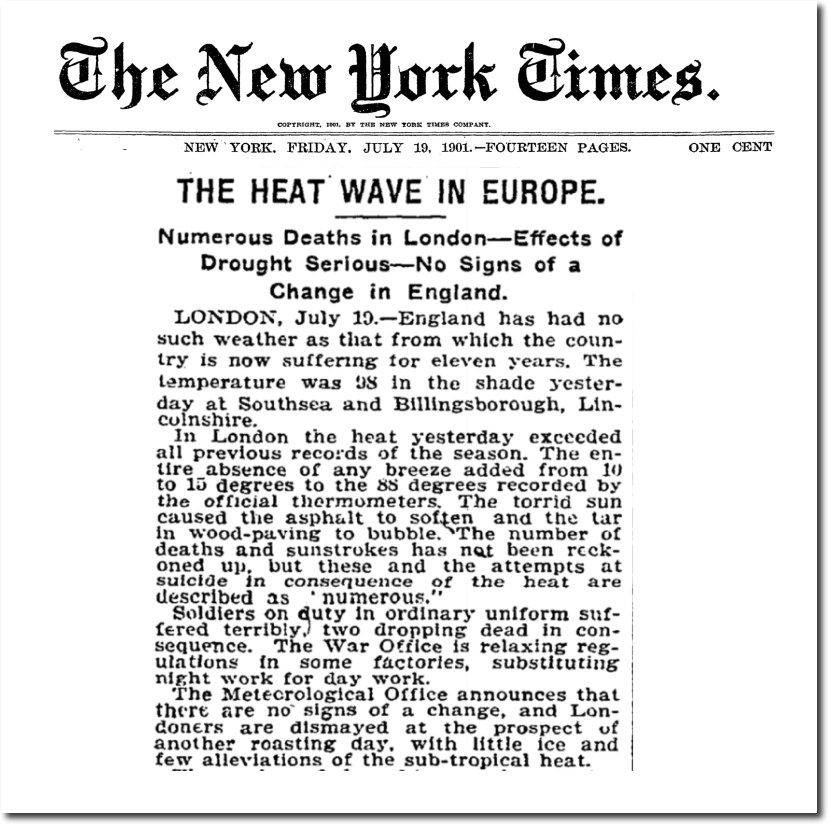
Later in July 1901, the heatwave expanded to Europe

THE HEAT WAVE IN EUROPE.; Numerous Deaths in London — Effects of Drought Serious — No Signs of a Change in England.

And continued into August.

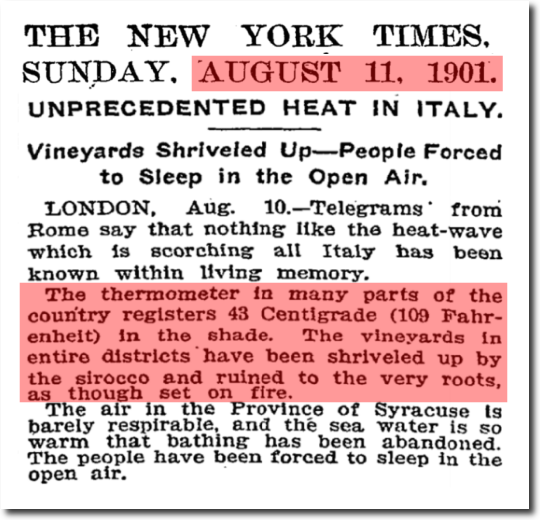
UNPRECEDENTED HEAT IN ITALY.; Vineyards Shriveled Up — People Forced to Sleep in the Open Air.

If climate scientists were actual scientists, they would want to understand what caused the heat of 1901 – rather than trying to erase it. But they aren’t scientists, they are crooks.

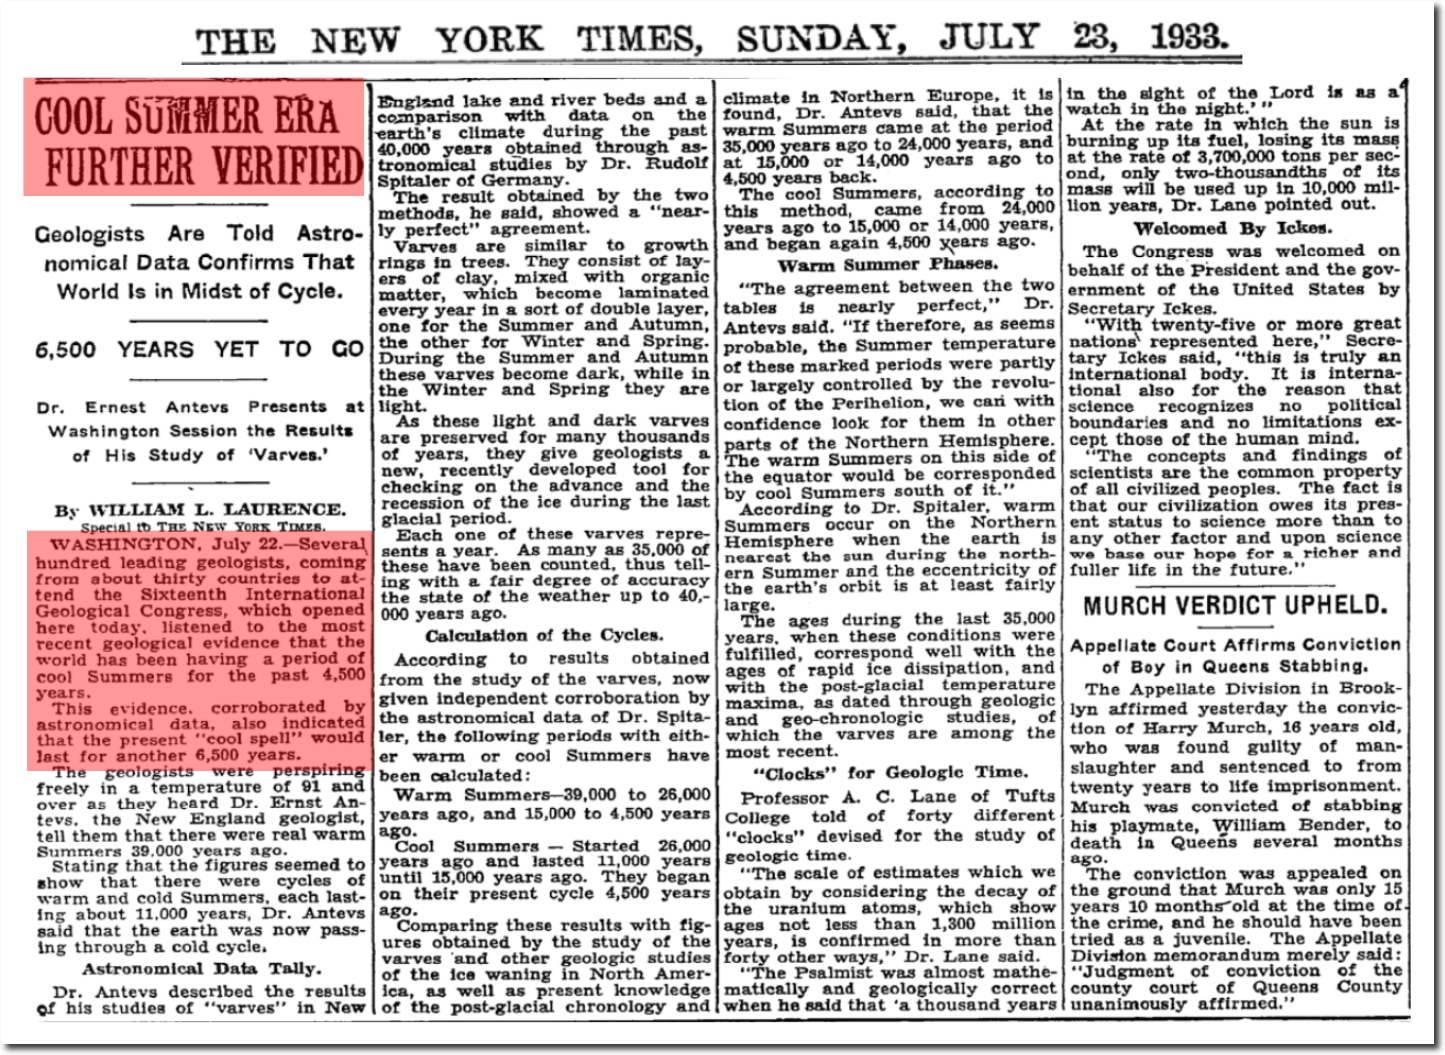
Before the days of climate scientists, geologists were in charge of climate studies – and they did actual science.

TimesMachine: July 23, 1933 – NYTimes.com

Draining the swamp requires cutting off every penny of funding from fake climate science.

Posted in Uncategorized | Leave a comment

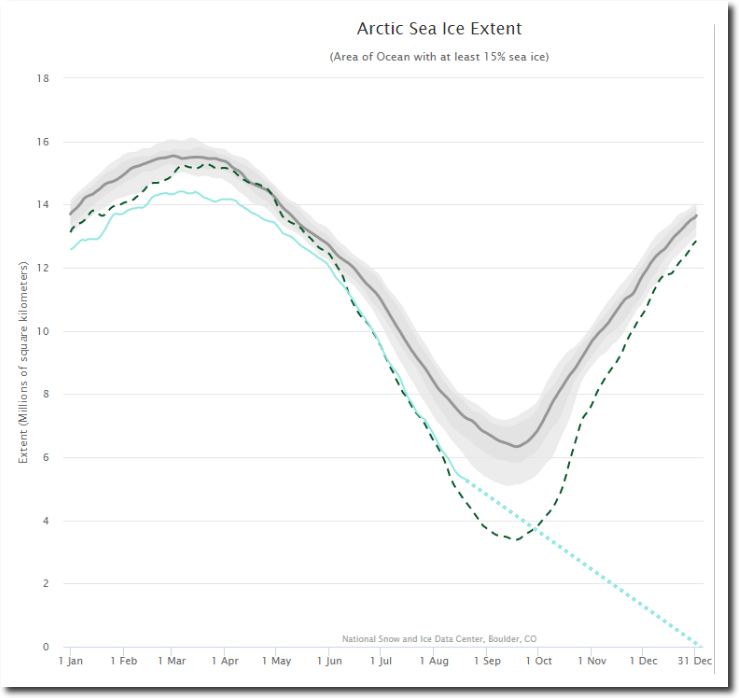
Updated Ice-Free Arctic Forecast

I’m now forecasting an ice-free Arctic on New Years Day, with temperatures at -35C.

Charctic Interactive Sea Ice Graph | Arctic Sea Ice News and Analysis

Posted in Uncategorized | Leave a comment