NOAA’s Complete Fake Climate Extremes Index

“Doublethink means the power of holding two contradictory beliefs in one’s mind simultaneously, and accepting both of them.”

  • George Orwell  1984

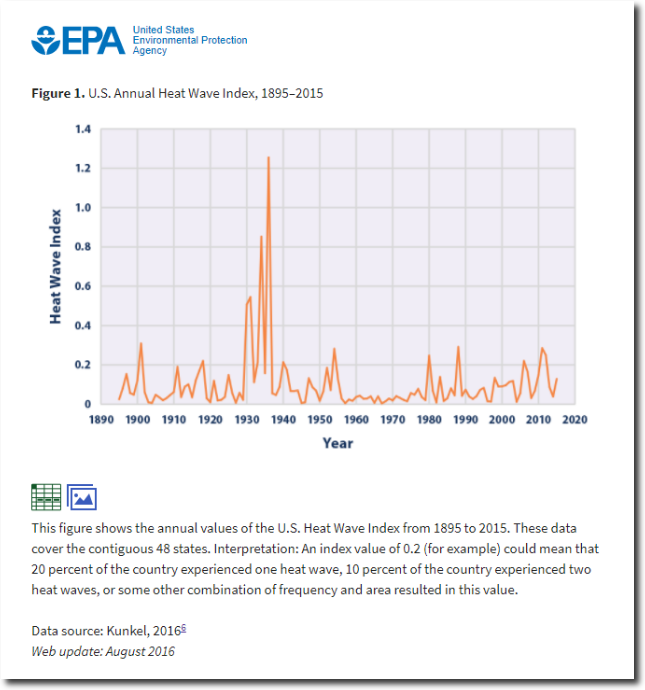
The EPA has this graph on their website, showing that the worst US heatwaves (by far) occurred during the 1930’s.

Climate Change Indicators: High and Low Temperatures | Climate Change Indicators in the United States | US EPA

But in classic Orwellian doublespeak, the EPA has another graph claiming the US experiences more unusually hot summer temperatures (the definition of heatwaves) than in the 1930’s.

Climate Change Indicators: High and Low Temperatures | Climate Change Indicators in the United States | US EPA

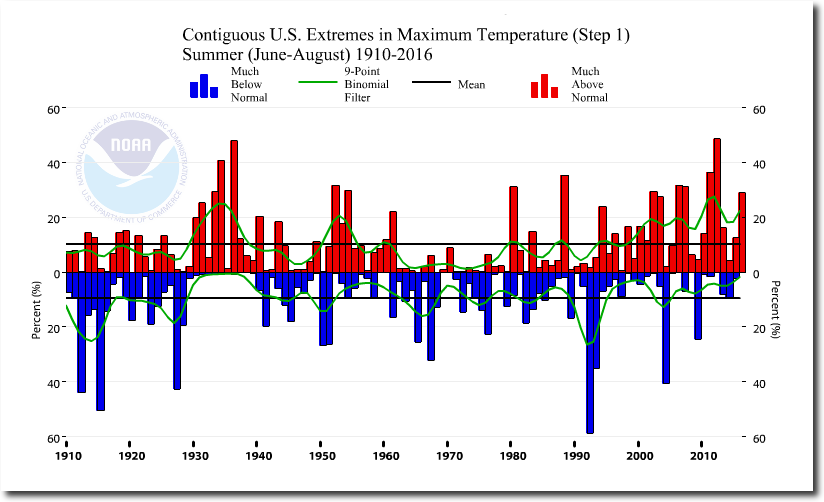
The two claims are mutually exclusive, and trace back to NOAA’s Climate Extremes Index (CEI) which shows that summer maximum temperatures in 2012 were hotter than in 1936.

U.S. Climate Extremes Index (CEI): Graph | Extremes | National Centers for Environmental Information (NCEI)

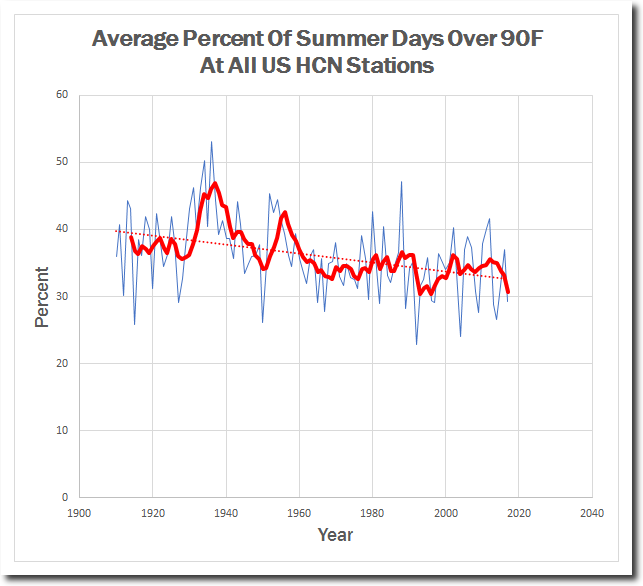
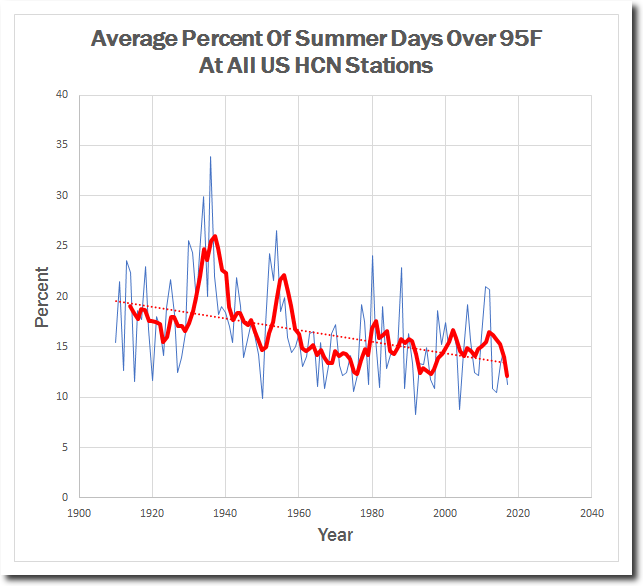
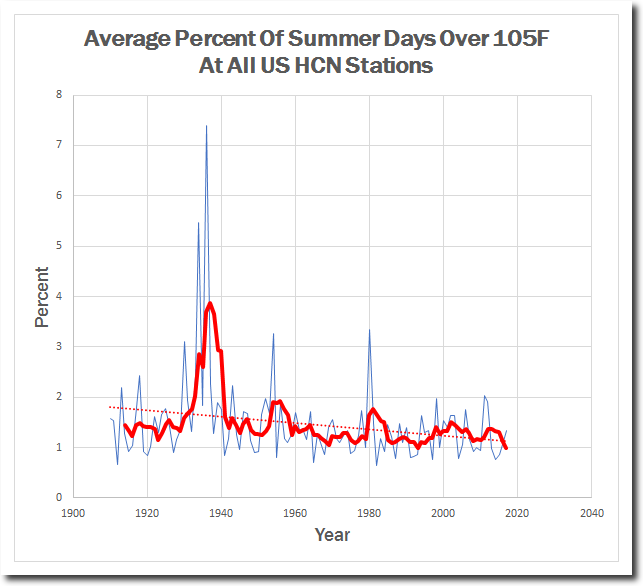
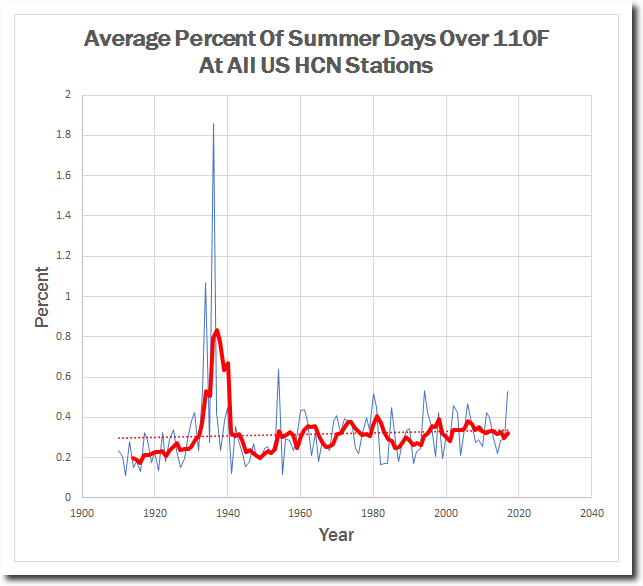
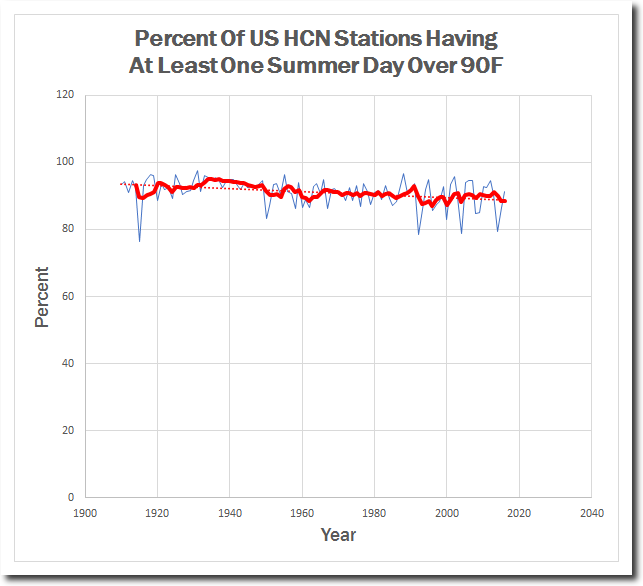
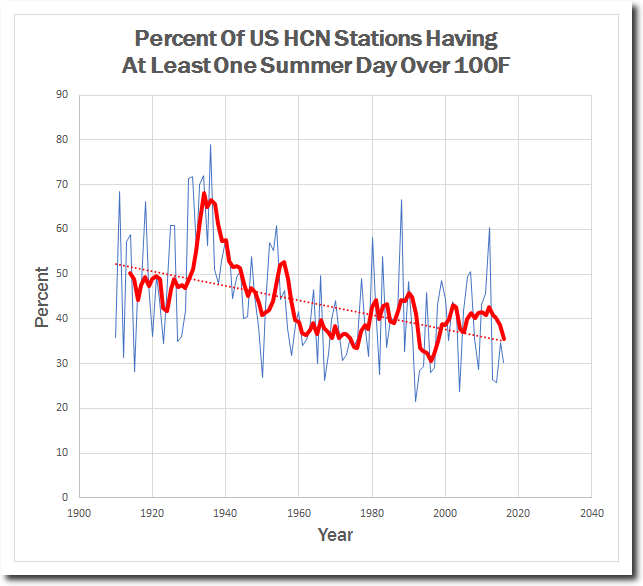
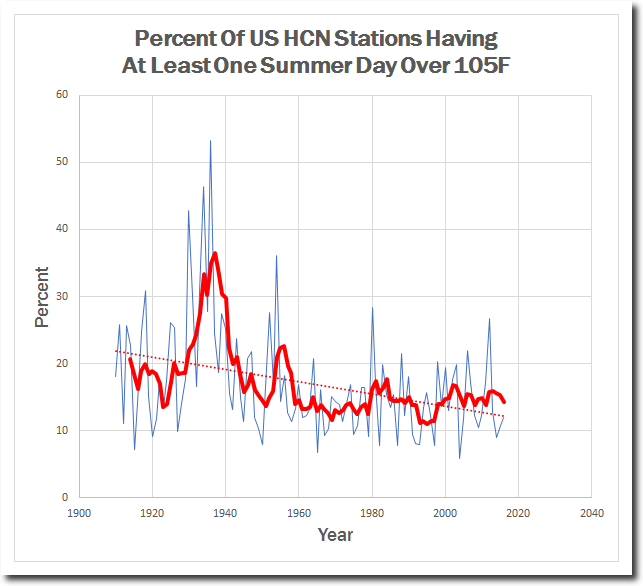
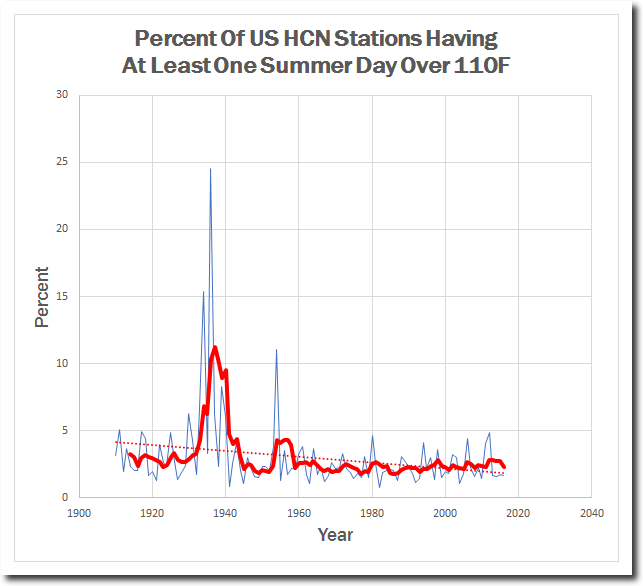
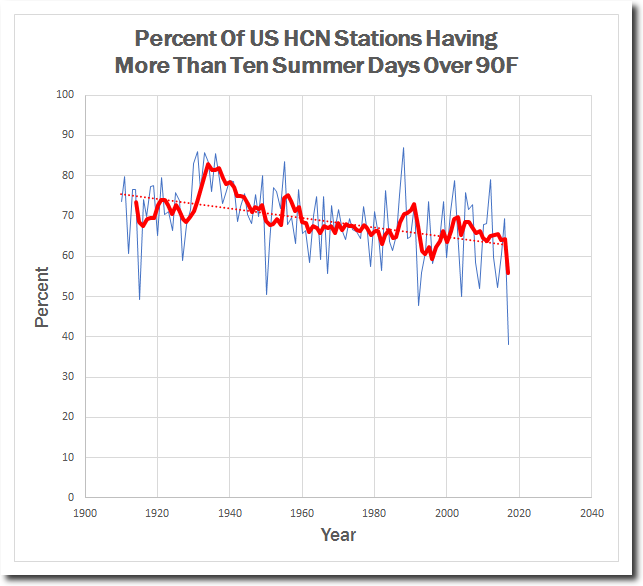
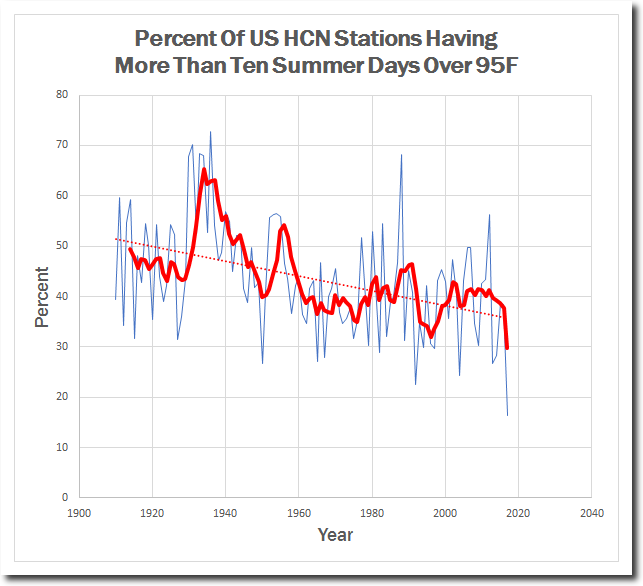
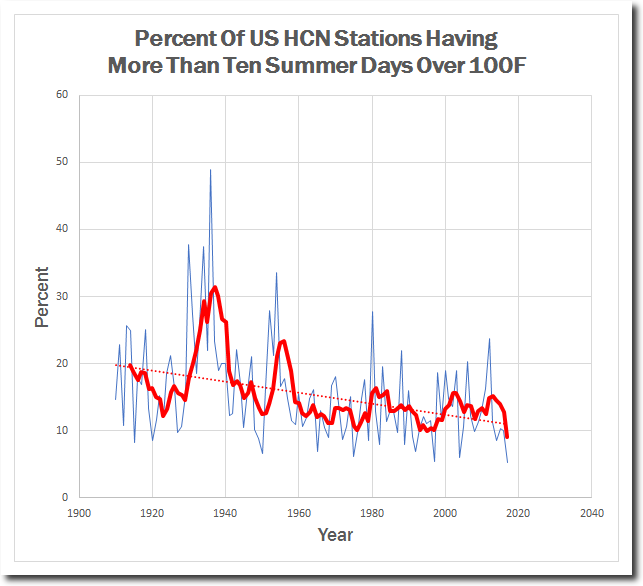
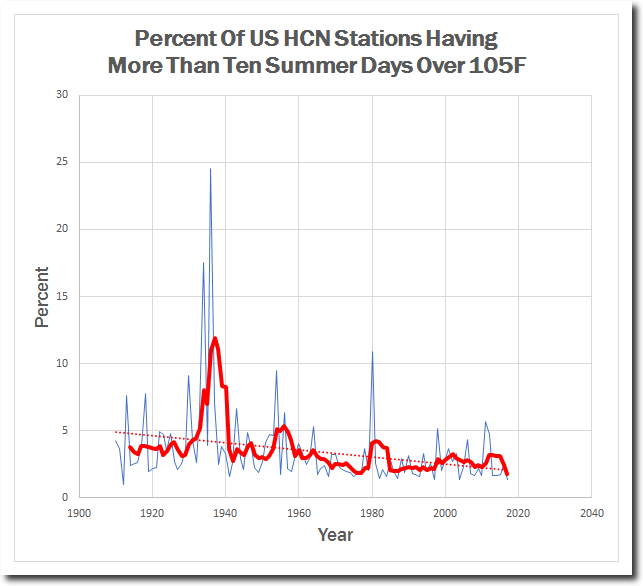
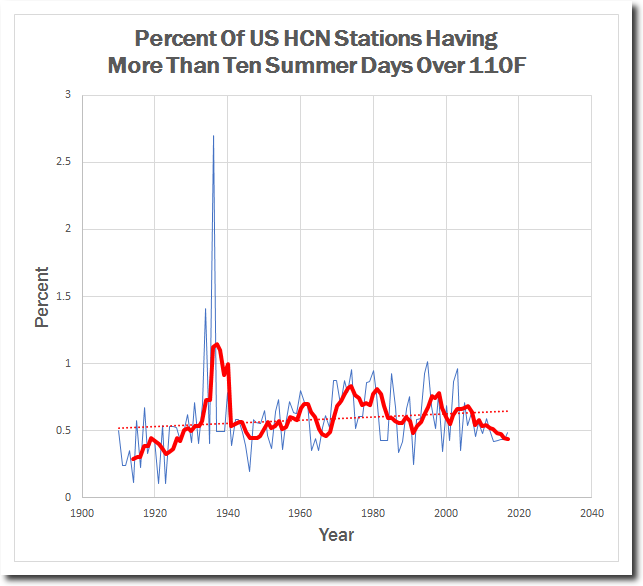
If you have been following my blog, you know that this claim is 100% fraudulent. The 1930’s were much hotter than recent years, and the frequency of heatwaves has plummeted. Below I have compiled all possible tests of this metric, and every single one of them shows that the 1930’s were much hotter than any recent years – agreeing with the first EPA graph.

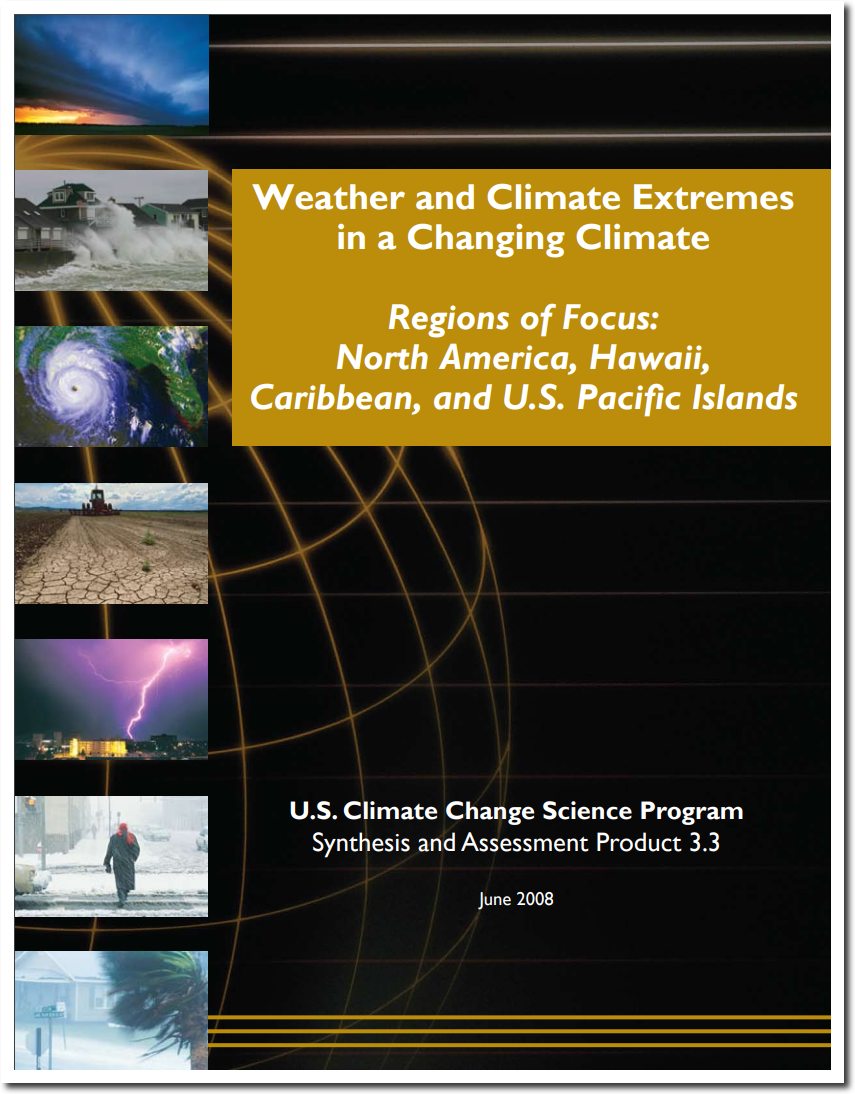
Heatwaves in the 1930’s were more intense, more widespread, and of longer duration. The NOAA Climate Extremes Index is completely fraudulent, and forms the basis of the George W. Bush Administration’s wildly fraudulent Climate Assessment.

sap3-3-final-all.pdf

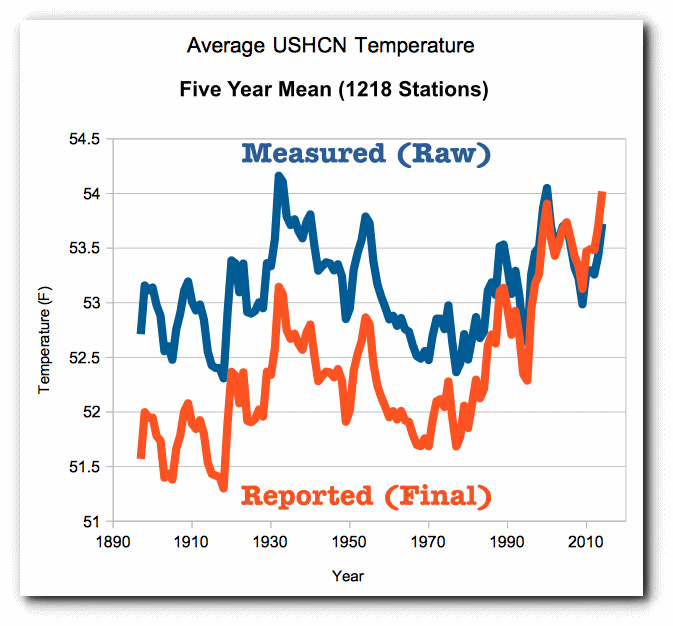
The most likely explanation for this fake data is that they use tampered USHCN data which cools the past.

The smoking gun is that a number of the graphs I posted should not have been affected by any of the USHCN adjustments, like the one below.

This is just one more example of straight up climate fraud by the US government.

Posted in Uncategorized | Leave a comment

More Arctic Sea Ice Than 1971

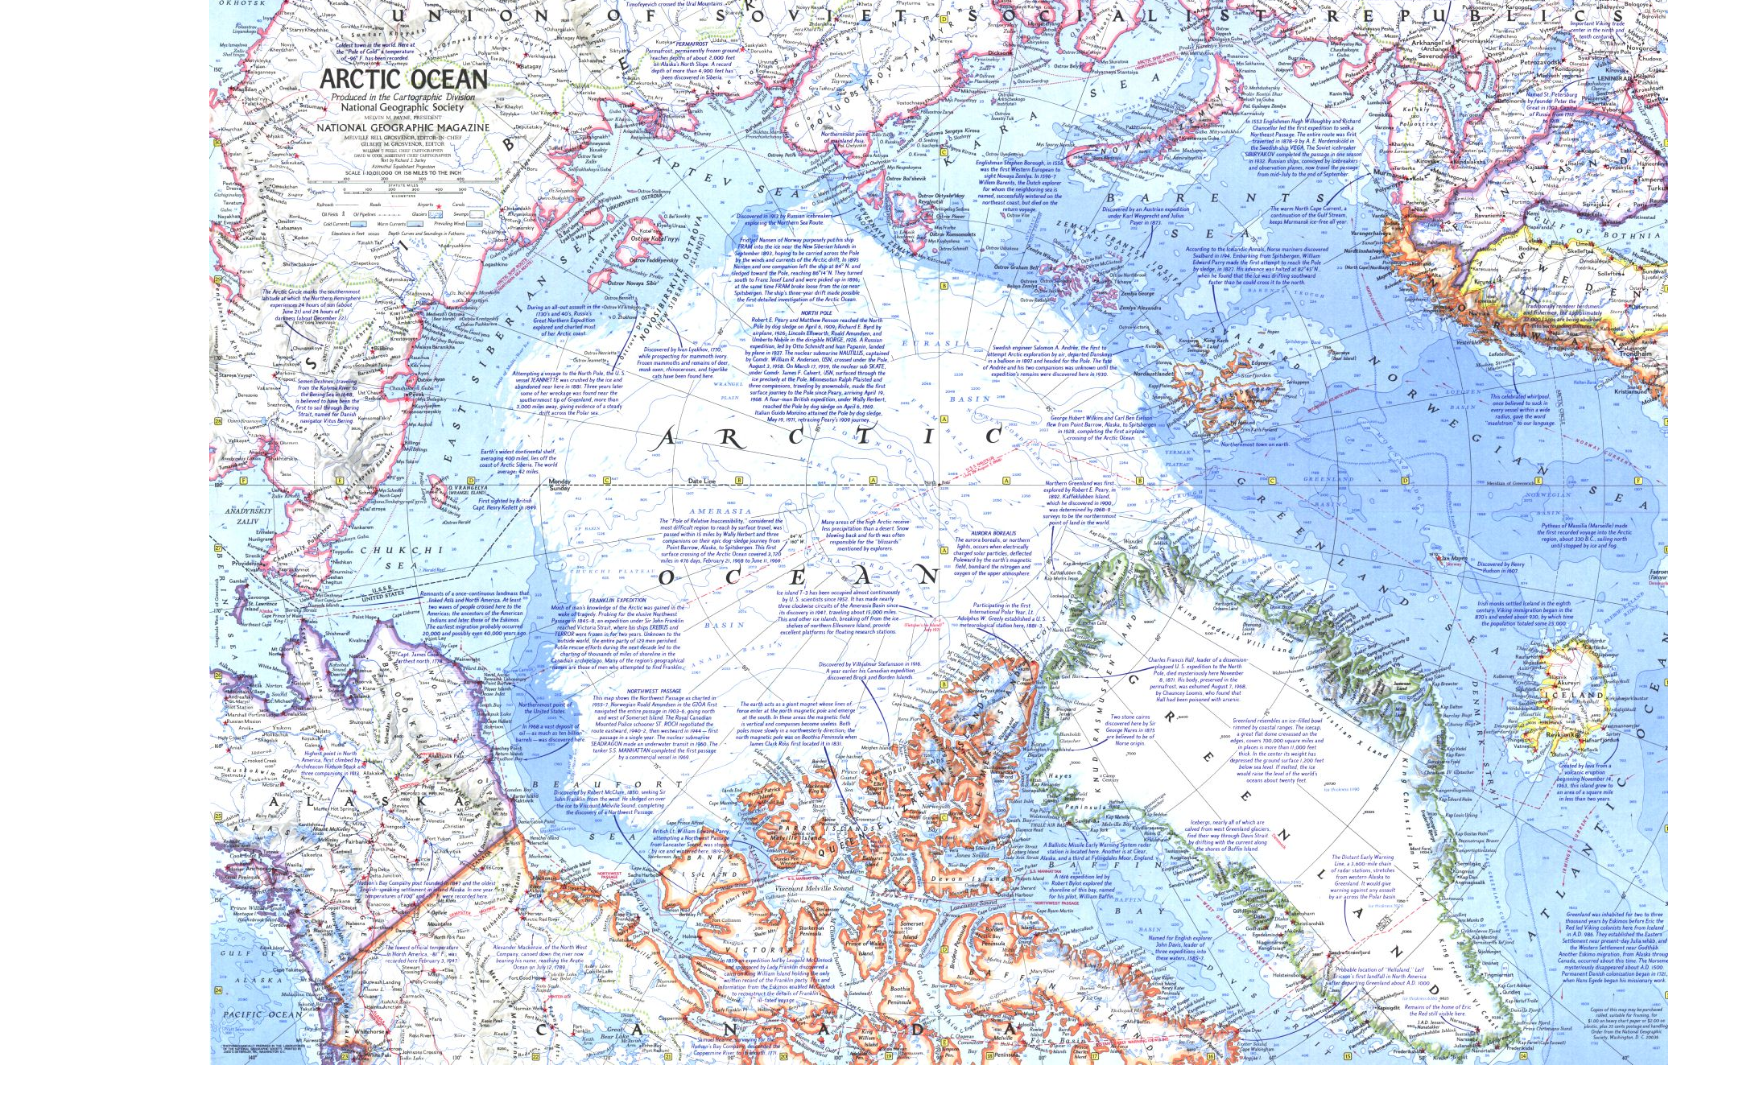
National Geographic published this map of Arctic sea ice extent in 1971

ARCTIC OCEAN

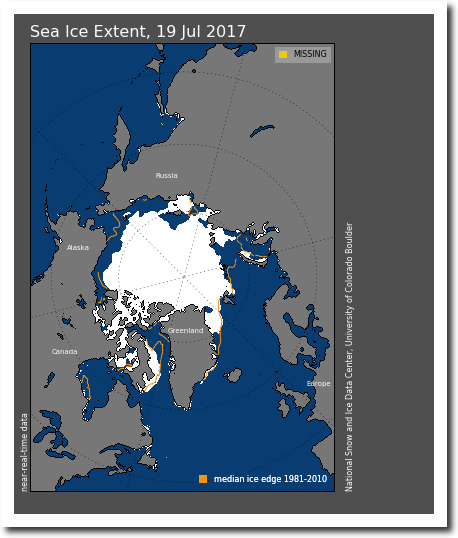
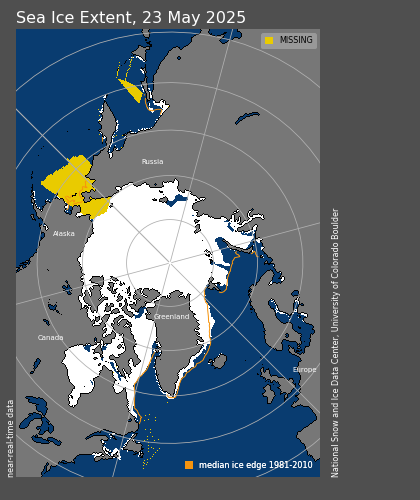
This map is current sea ice extent.

N_daily_extent.png (420×500)

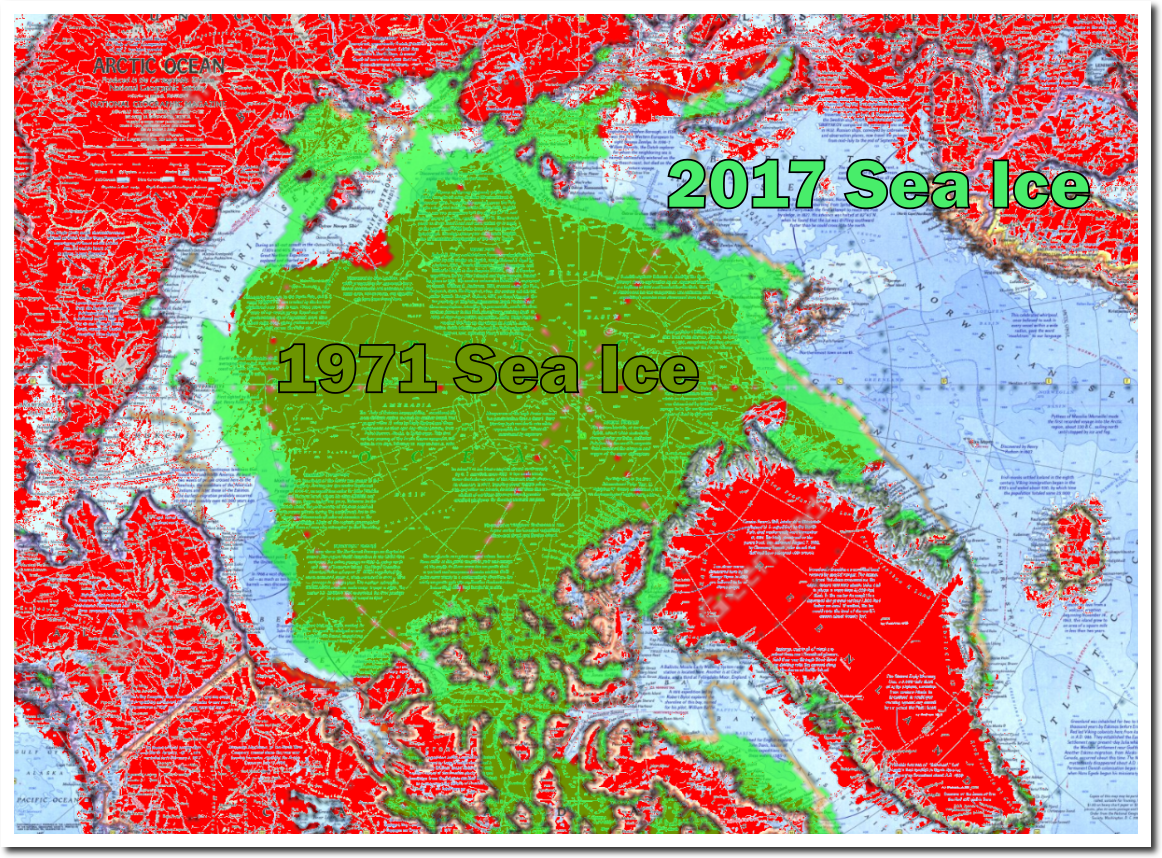
I overlaid the images at the same scale. The 1971 edge is shown in brown. The current edge is shown in green. As you can see, the current edge extends quite a bit further than the 1971 edge. The edge will shrink some over the remainder of the short melt season, but cold air in the Chukchi and Beaufort Seas will minimize melt for the next few weeks.

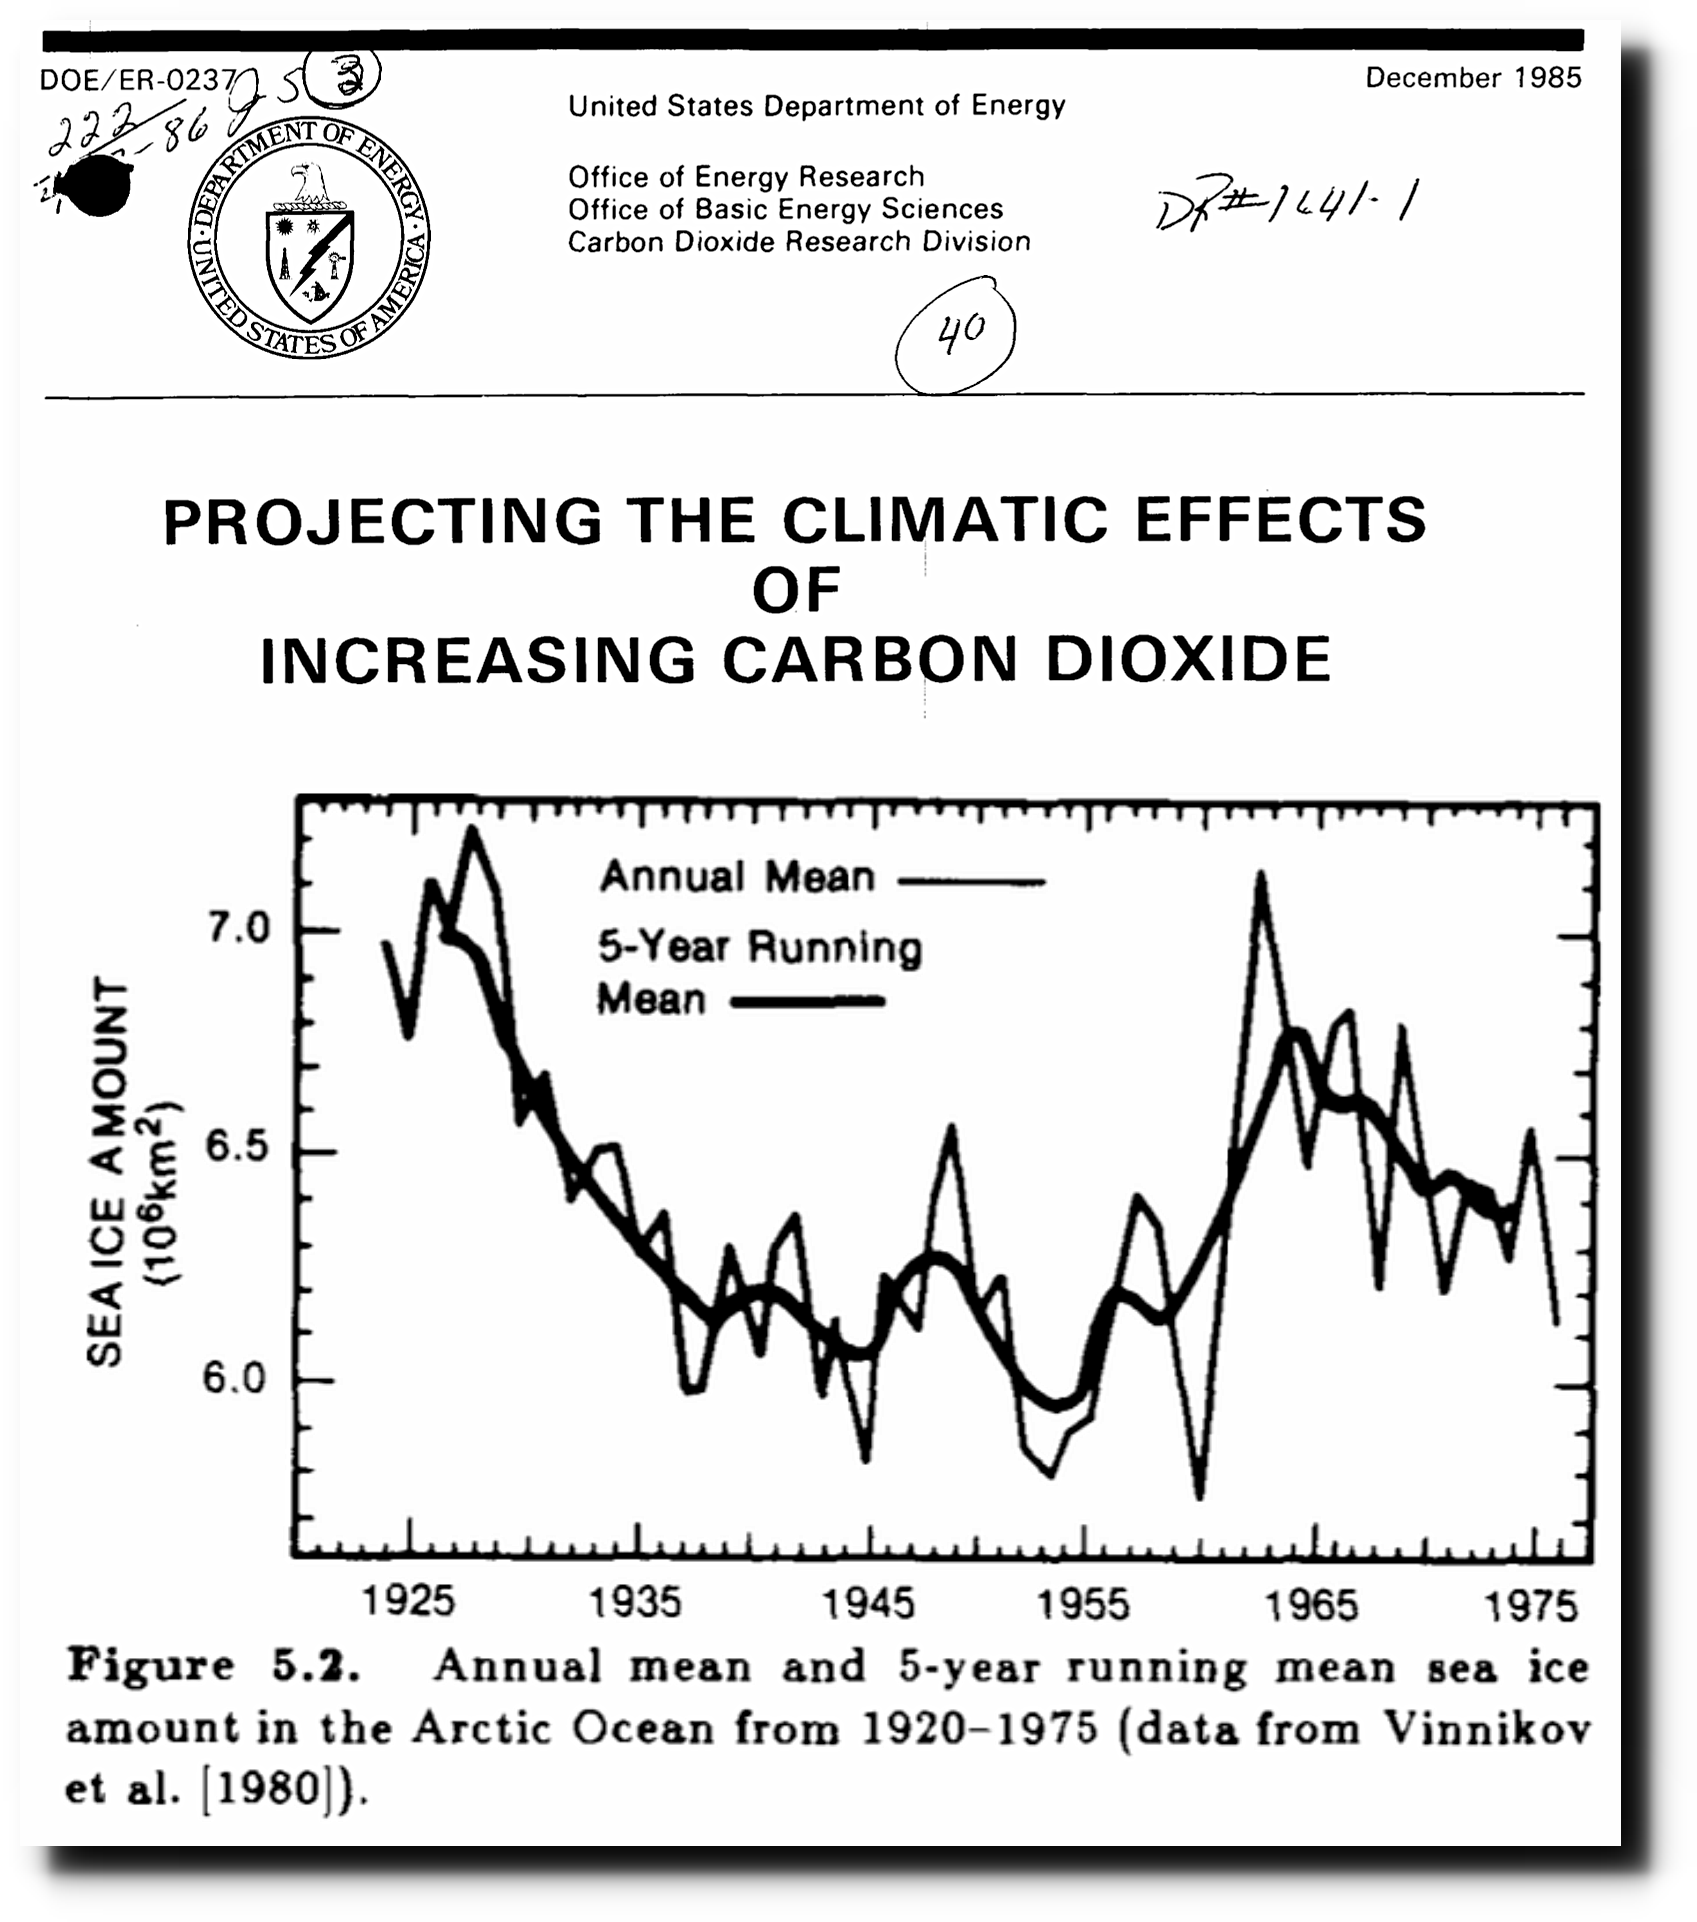
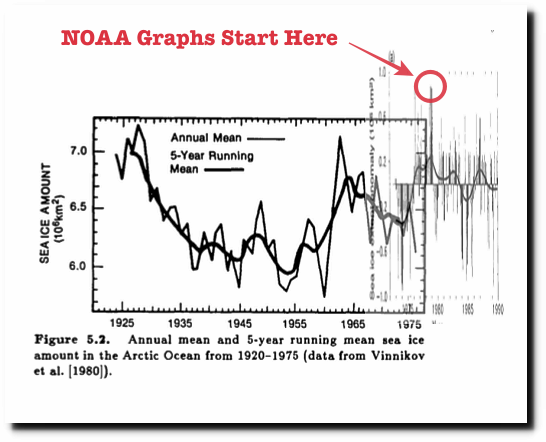
This map is consistent with data from the 1985 DOE report “Projecting the climatic effects of increasing carbon dioxide” – which showed low ice extent prior to the 1979 peak where fake climate scientists always start their graphs.

Arctic Sea Ice Fraud | The Deplorable Climate Science Blog

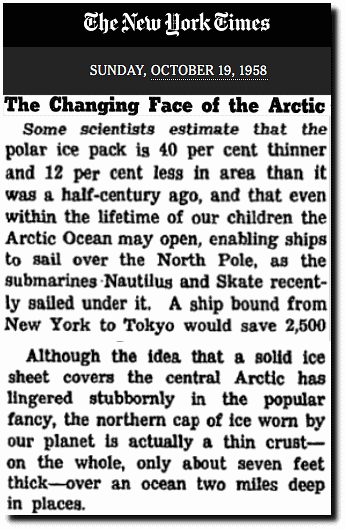
Newspaper accounts from the 1950’s confirmed that sea ice extent and thickness was low.

The Changing Face of the Arctic; The Changing Face of the Arctic 

The mainstream press won’t report this, because they aren’t interested in facts or science.

Posted in Uncategorized | Leave a comment

July 21, 1934 – Hottest Day On Record In Ohio

On this date in 1934, Gallipolis, Ohio reached 113 degrees. Ohio’s hottest temperature on record.

Posted in Uncategorized | Leave a comment

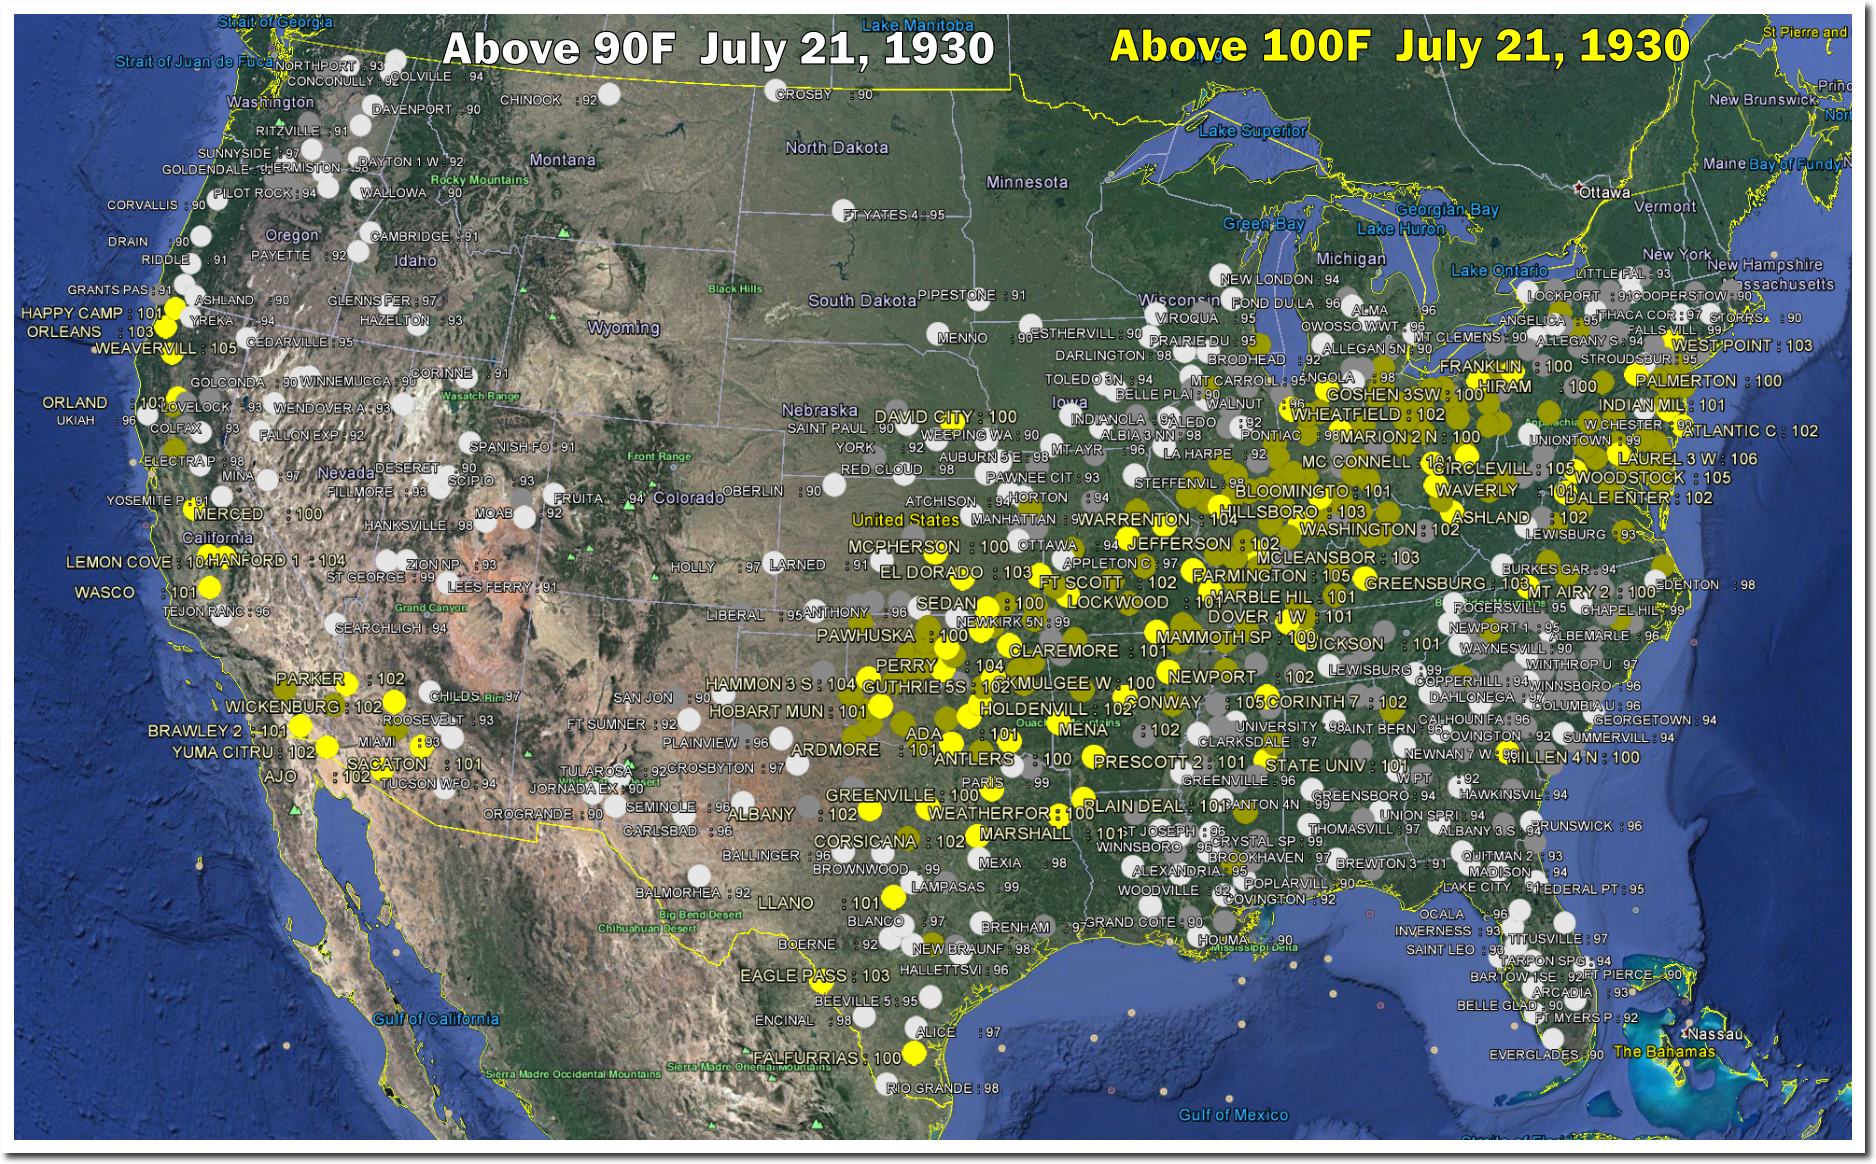
July 21, 1930 – Hottest Day On Record In Delaware

On July 21, 1930 Millsboro, Delaware reached 110 degrees – Delaware’s highest temperature on record.

Posted in Uncategorized | Leave a comment

July 20, 1930 – Hottest Day On Record In Washington DC

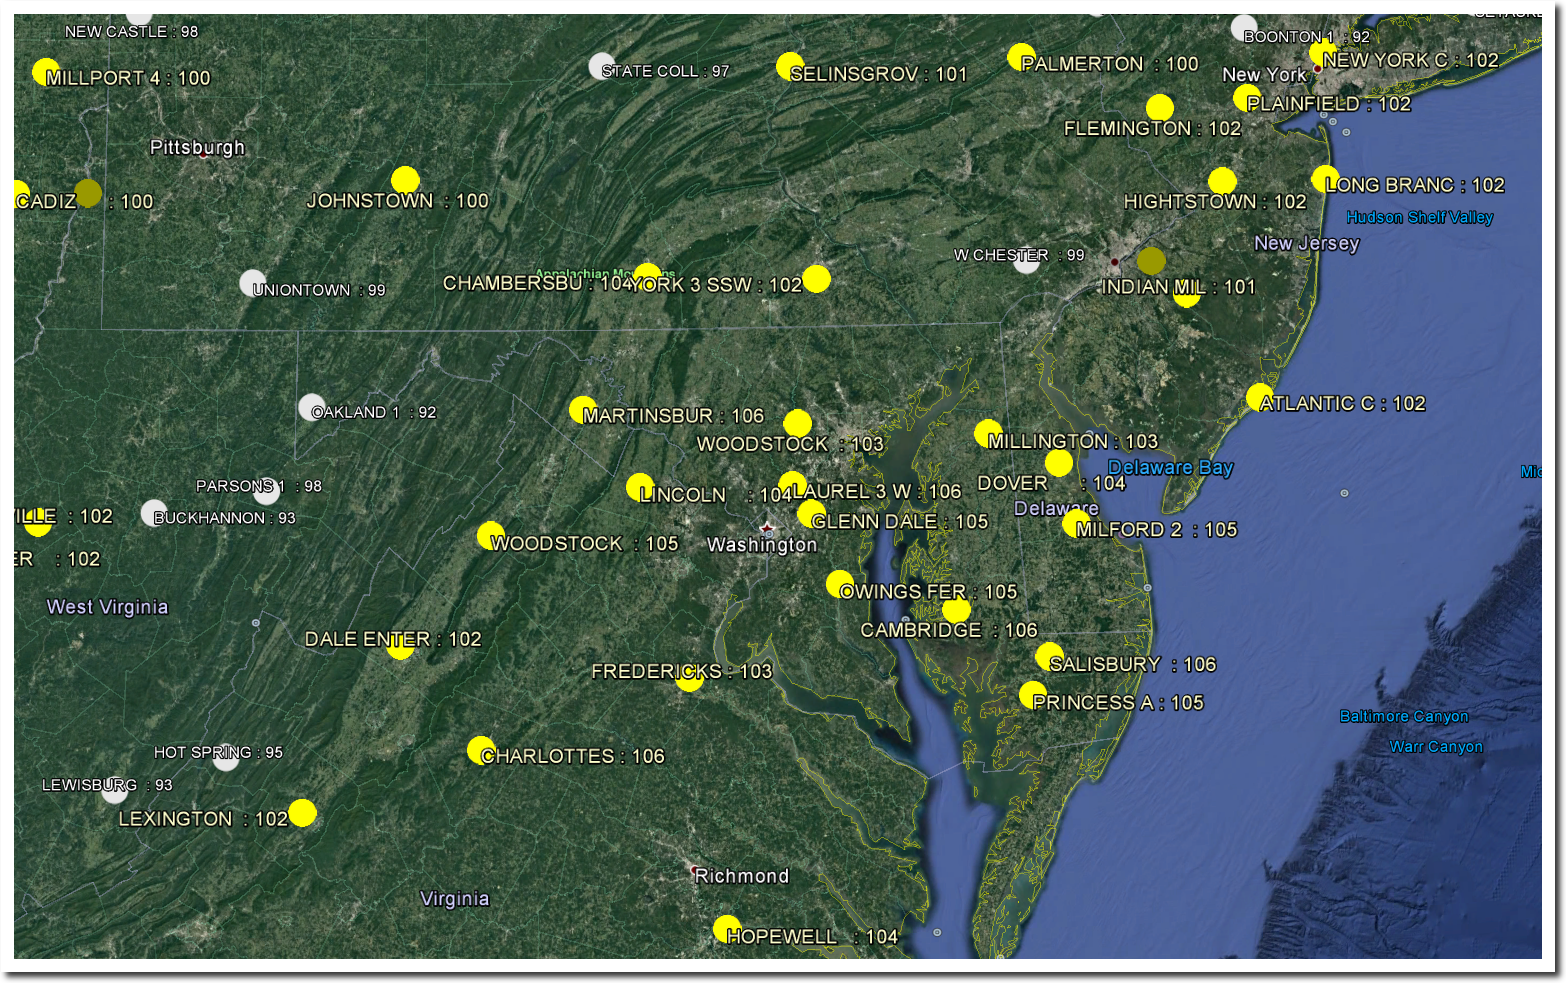
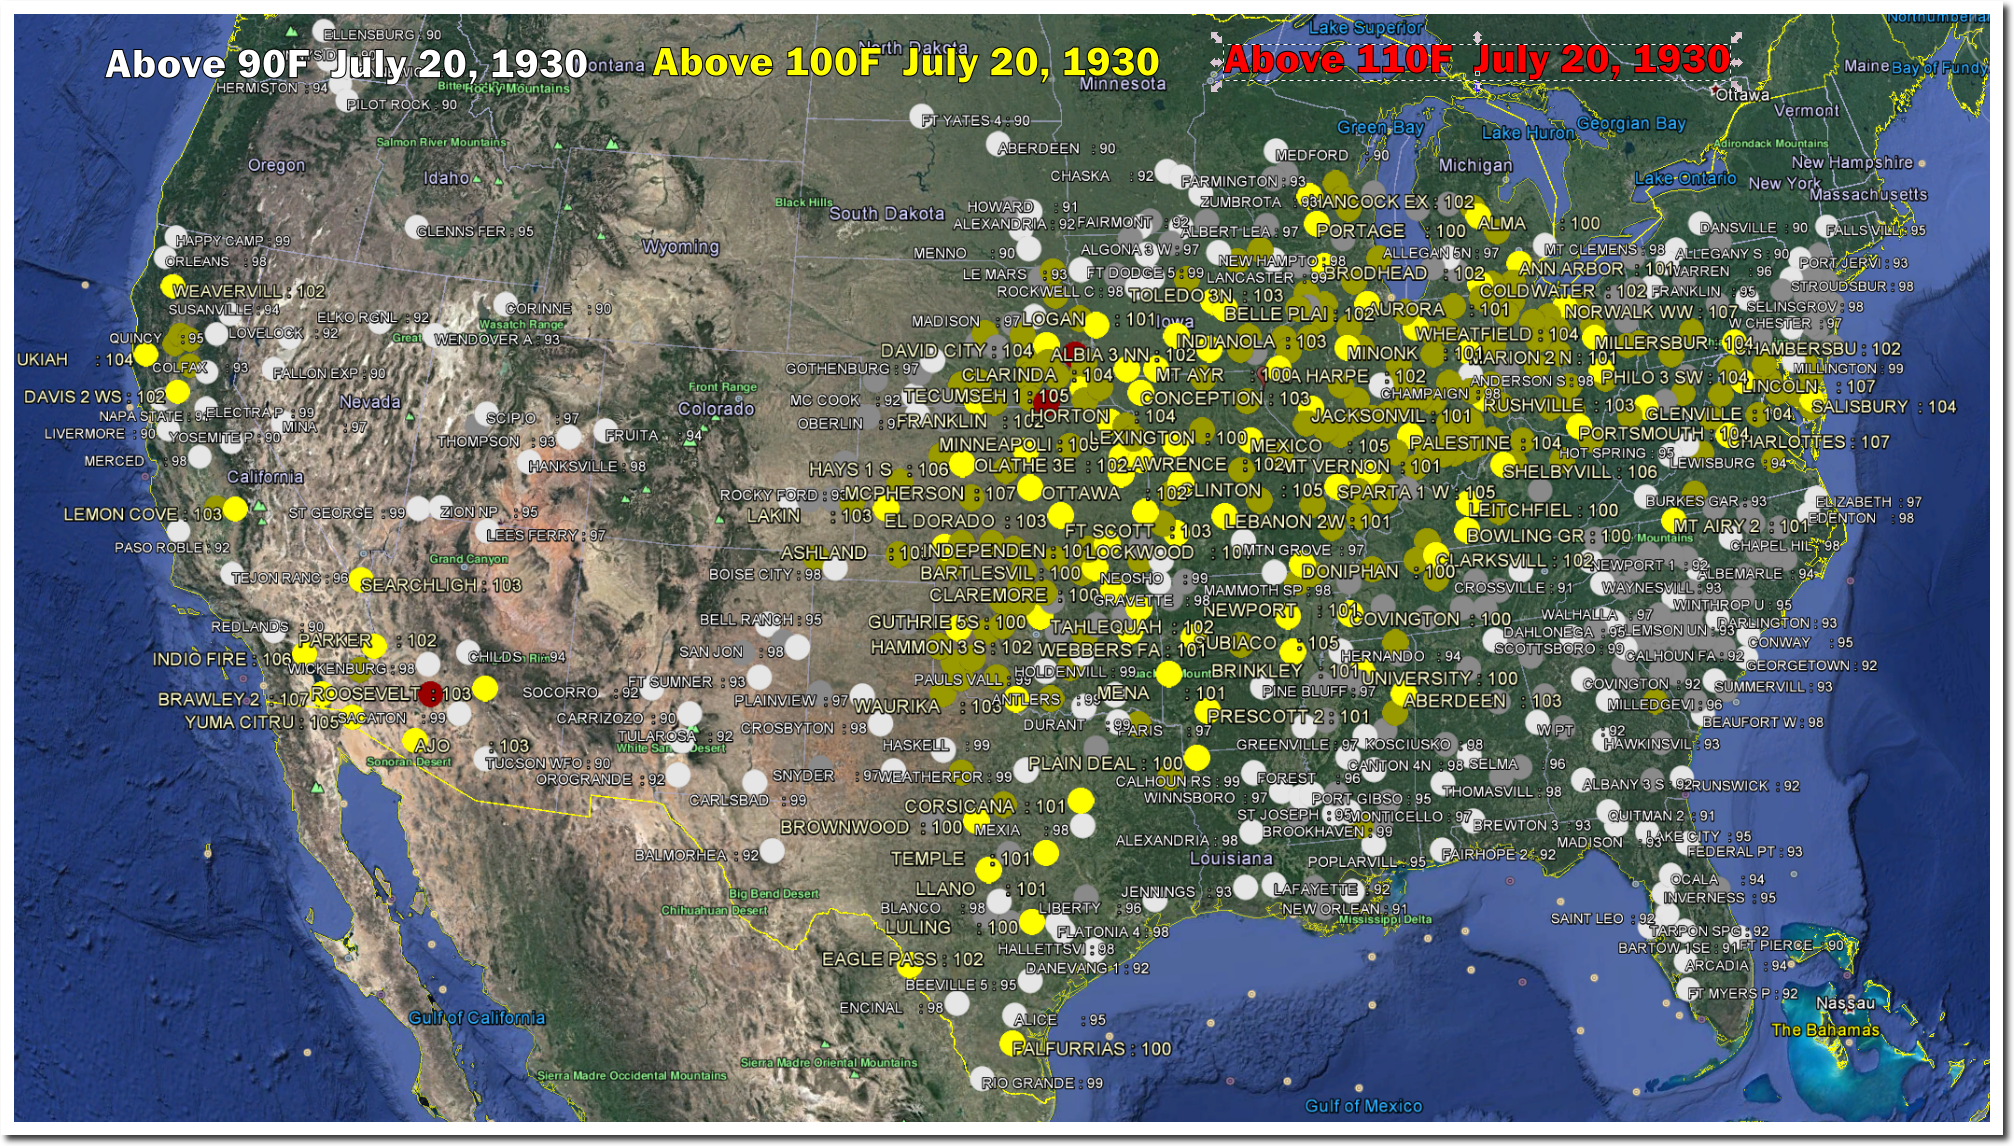
On this date in 1930, Washington DC reached 106F – the hottest temperature ever recorded there. Most of the eastern half of the US was above 100F.

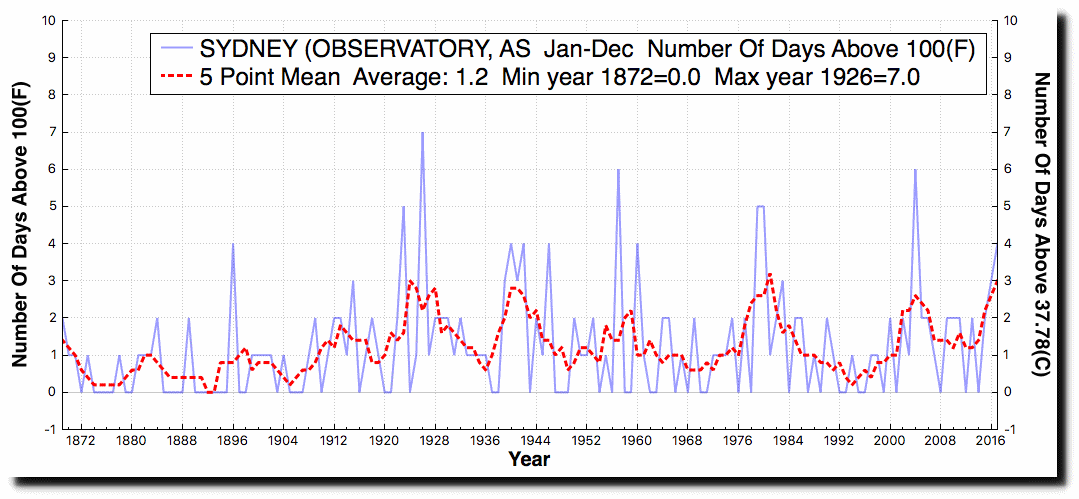
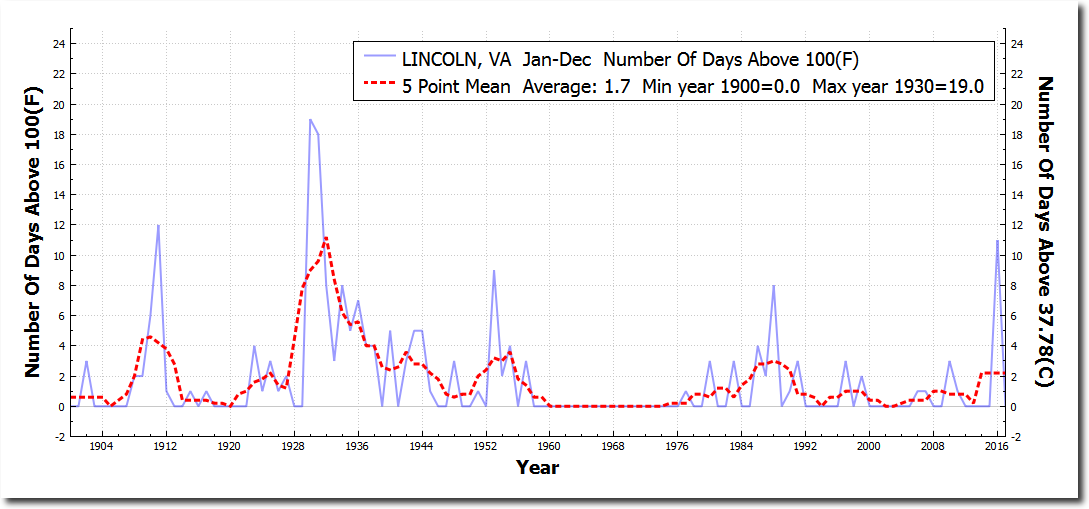
The closest USHCN station to DC in Virginia is at Lincoln. It is close to where I stay when I am in Maryland. They had nineteen days over 100F in 1930, and eighteen in 1931. One hundred degree days were much more common in the DC area prior to 1960, and have become less frequent as atmospheric CO2 has increased.
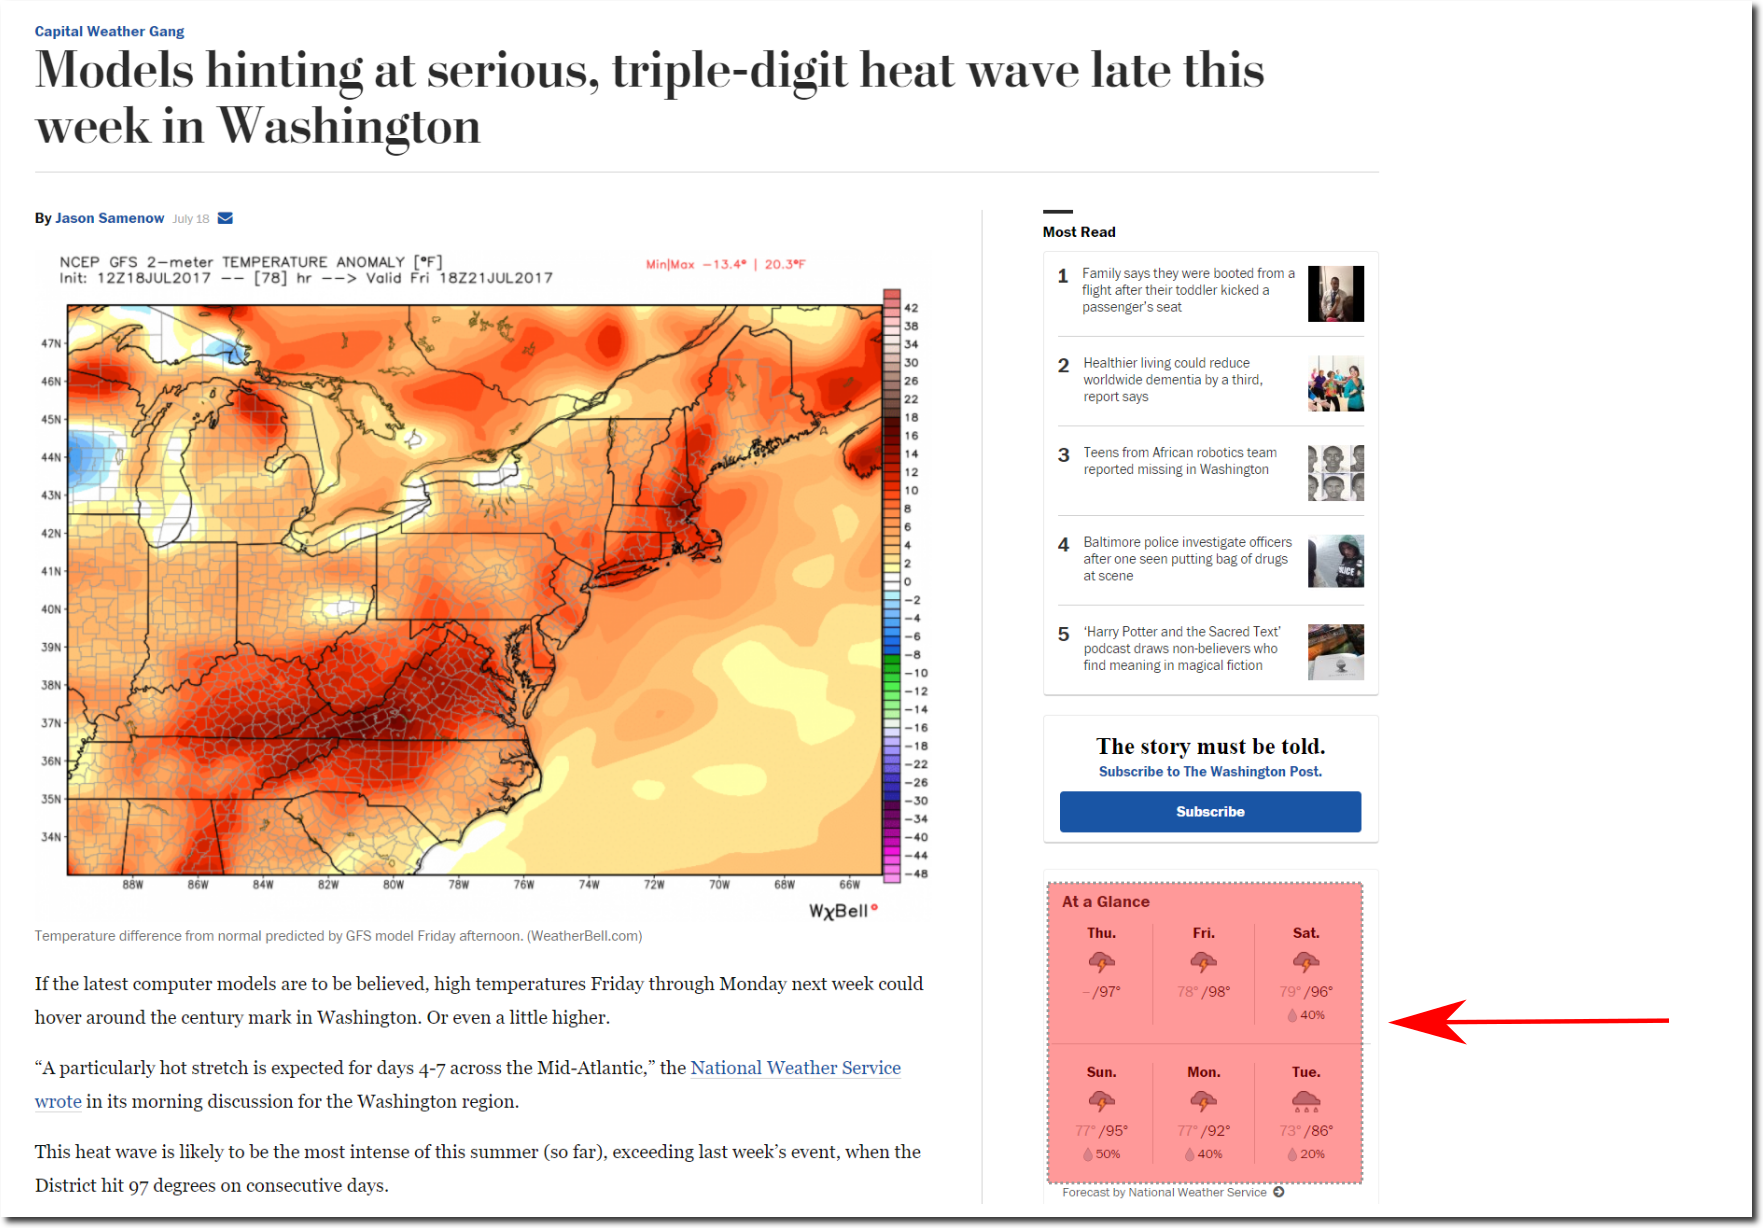
Things have changed though. The Washington Post now believes that temperatures ranging from 86 degrees to 98 degrees are “serious triple-digit heat.” Apparently math isn’t their strongest skill.
Models hinting at serious, triple-digit heat wave late this week in Washington – The Washington Post

Posted in Uncategorized | Leave a comment

Concern About Sea Level Rise In Malibu

People in Malibu, California are so worried about sea level rise – you can pick up a home there for only $80 million.

Posted in Uncategorized | Leave a comment

New Video : NASA And NOAA Erasing The Record Heat Of 1934

Posted in Uncategorized | Leave a comment

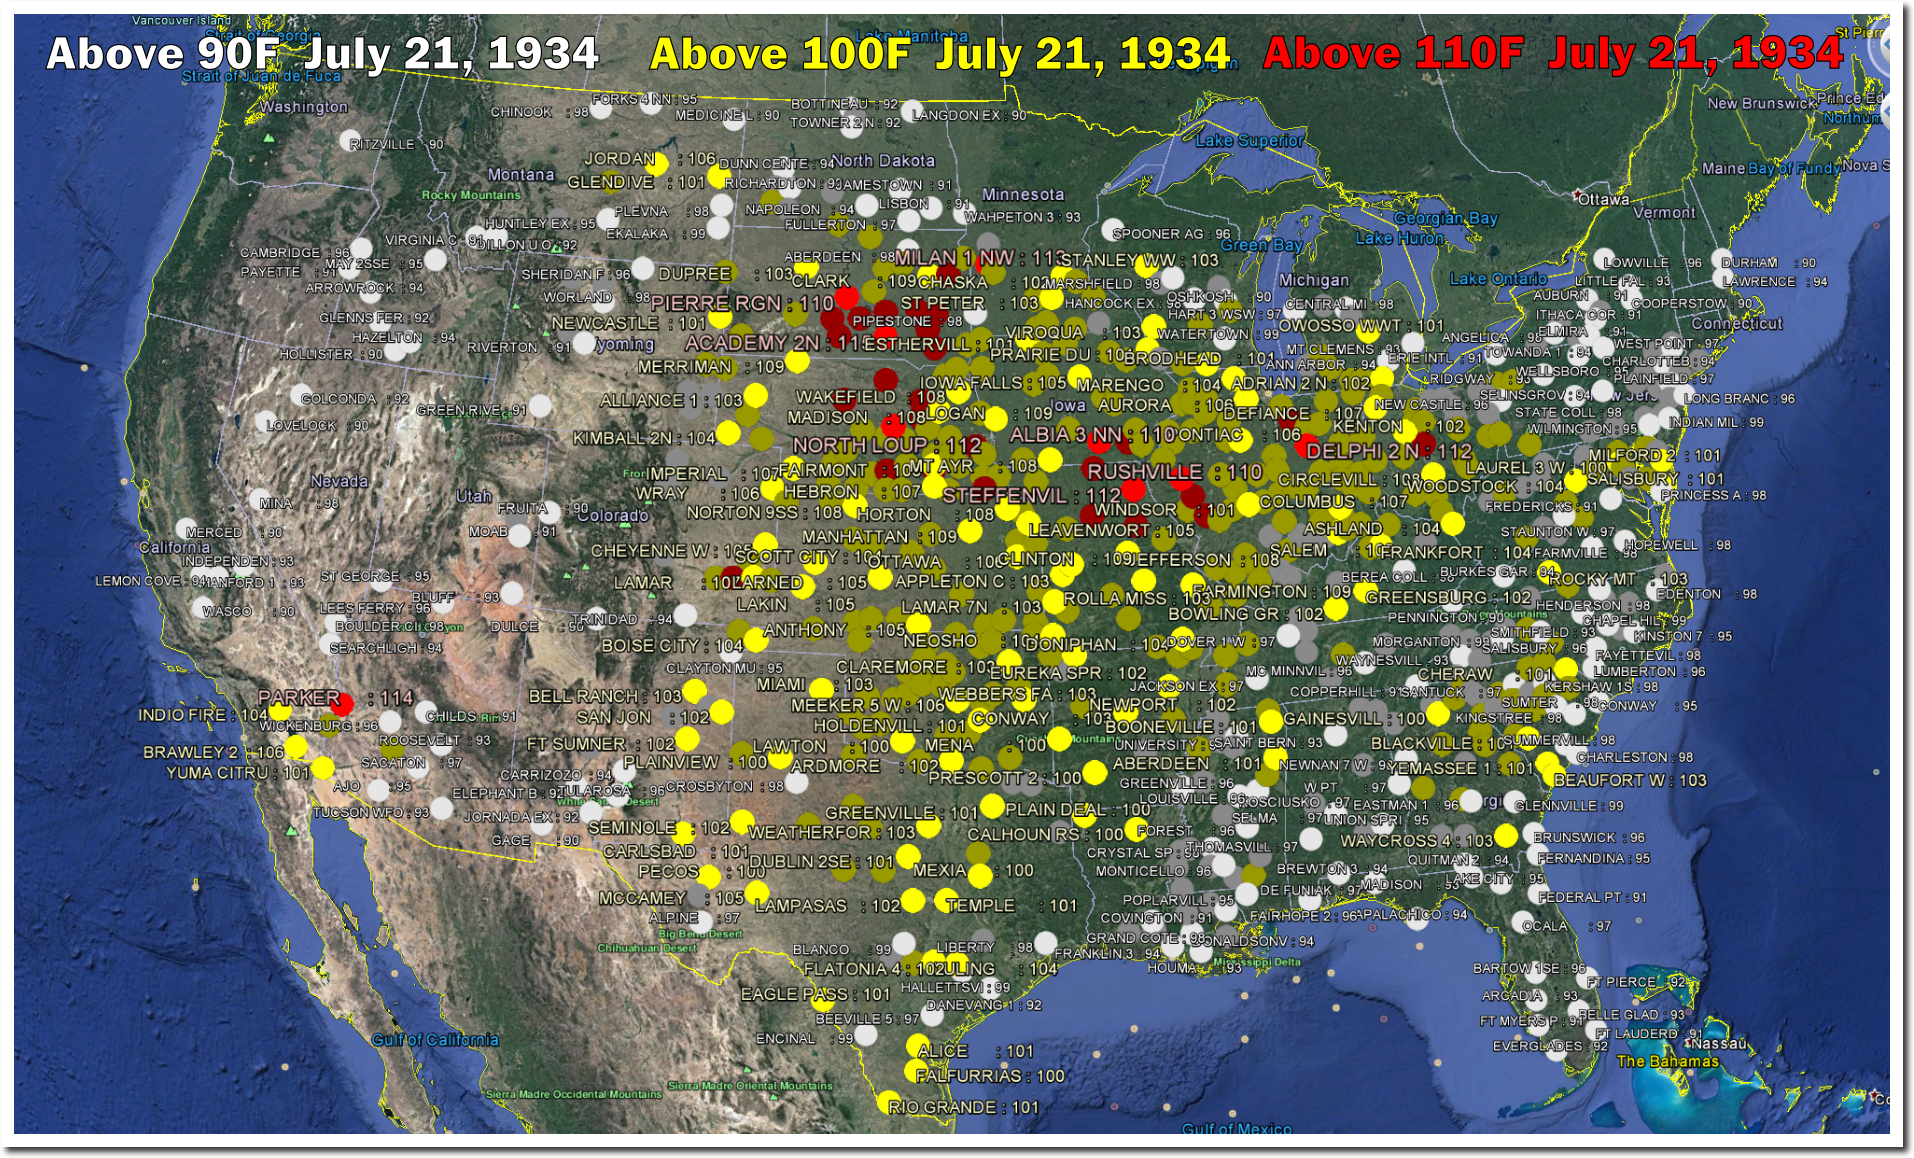
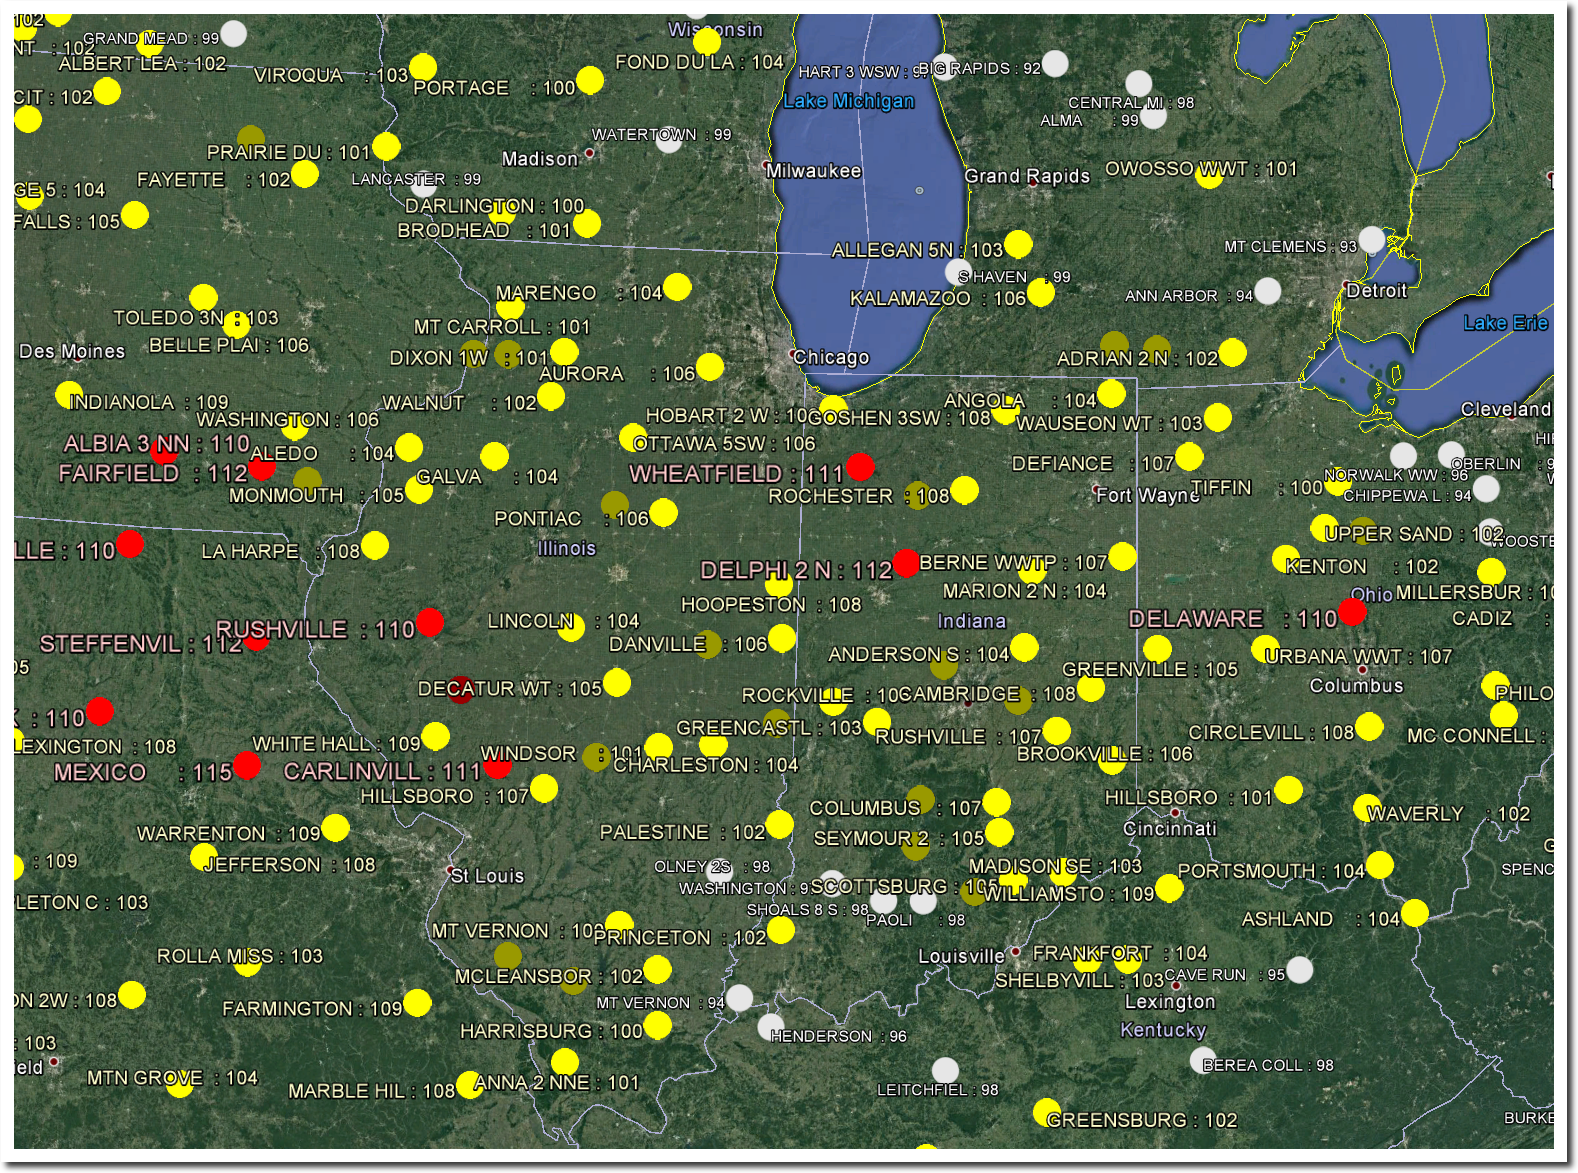
July 20, 1934 – 118 Degrees In Iowa

July 20, 1934 was the hottest day in Iowa’s history. Keokuk, Iowa reached 118 degrees. Almost the entire country was over 90 degrees, almost half was over 100 degrees, and a large section of the Midwest was over 110 degrees.

It was also the hottest day on record outside Omaha, Nebraska – where temperatures reached 116 degrees. Since then, peak summer maximum temperatures have plummeted.

The average maximum temperature that day across the US was 95 degrees, six degrees hotter than last year, which NOAA says was the hottest year on record.

Eighty percent of the US was in drought.

The US simply doesn’t get hot weather like that any more.

Climate alarmists now get hysterical about a hot day in Arizona, which happens every June.

1934 was the hottest year on record in the US. This wrecked global warming theory, so NASA and NOAA simply changed the data to make the heat go away.

NASA Temperature Graphs Are Fake News | The Deplorable Climate Science Blog

Who controls the past controls the future. Who controls the present controls the past.

  • George Orwell  “1984”
Posted in Uncategorized | Leave a comment

My Letter In The Boulder Daily Camera

Tony Heller: Five minutes in south Boulder open space – Boulder Daily Camera

Posted in Uncategorized | Leave a comment

The Year Without An Arctic Summer

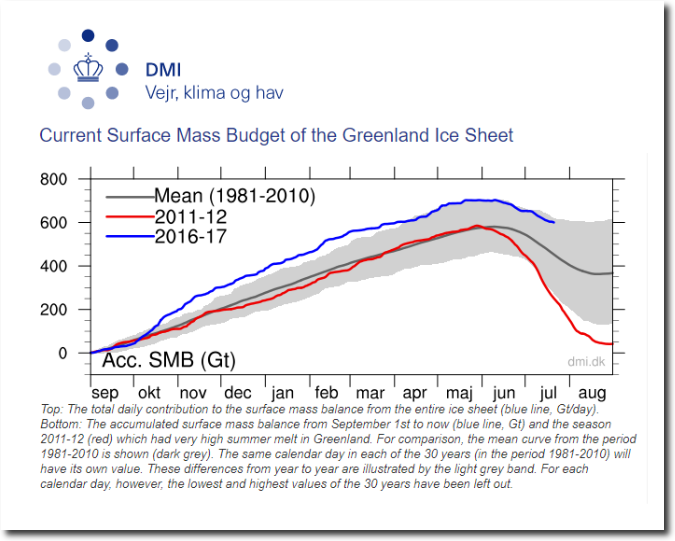
The Greenland Ice Sheet is gaining near record amounts of ice this year. Very little melting has occurred this summer, which is about to start winding down..

Greenland Ice Sheet Surface Mass Budget: DMI

Temperatures on the Greenland Ice Sheet have been extremely cold, and broke the all-time record for Northern Hemisphere July cold on July 4, at -33C.

summit:status:weather

Temperatures within 300 miles of the pole have been below normal every day since the beginning of May.

Ocean and Ice Services | Danmarks Meteorologiske Institut

We see the same pattern year after. Lots of ice gain over most of Greenland’s surface, particularly southeast Greenland.

Greenland Ice Sheet Surface Mass Budget: DMI

Greenland Ice Sheet Surface Mass Budget: DMI

Greenland Ice Sheet Surface Mass Budget: DMI

Despite all evidence to the contrary, government scientists insist on believing fake GRACE data which shows almost all of Greenland losing ice.

Grace_map_La_EN_20160300.png (920×1080)

Science used to involve data, facts, integrity and thought, but now it involves striving for grant money. Meanwhile, the climate mafia insists the Arctic is experiencing record melting, and “cracking up.”

These are criminals, not scientists.

Posted in Uncategorized | Leave a comment