
Disrupting the Borg is expensive and time consuming!

Google Search
-
Recent Posts
- Truth Or Consequences
- US Climate Trend Maps
- Declining Spring Snow Cover In Northern New Mexico
- You Can’t Fool Mother Nature
- Cattle And The Climate
- One Atomic Bomb Per Hour
- New Video : Analyzing Oil And Gas
- Is Antarctica Melting?
- High Speed Analysis And Visualization
- El Nino To The Rescue?
- Fake News Update
- Growth Of Antarctic Sea Ice
- 65 Years Of Progress!
- El Nino To The Rescue?
- Worst March Drought On Record
- ChartGL Process Control Demo
- The Biggest Money Laundering Scam
- Drought In The Headwaters Of Lake Powell
- Unrealistic Expectations Of Water Availability
- Did Bill Gates Do This?
- Worst March Drought On Record In The US
- The Real Hockey Stick Graph
- Analyzing The Western Water Crisis
- Gaslighting 1924
- “Why Do You Resist?”
Recent Comments
- Weylan McAnally on One Atomic Bomb Per Hour
- conrad ziefle on Declining Spring Snow Cover In Northern New Mexico
- Bob G on You Can’t Fool Mother Nature
- Ivan G Wainwright on You Can’t Fool Mother Nature
- conrad ziefle on You Can’t Fool Mother Nature
- Bob G on You Can’t Fool Mother Nature
- Gordon Vigurs on You Can’t Fool Mother Nature
- arn on Cattle And The Climate
- Bob G on Cattle And The Climate
- Robertvd on Cattle And The Climate
No Warming In Argentina Since 1940
I can only find three Argentinean stations in the GHCN/GISS databases with contiguous temperature records going back to the early 1940s.
Junin Aero is a rural station which shows 1940 warmer than now.
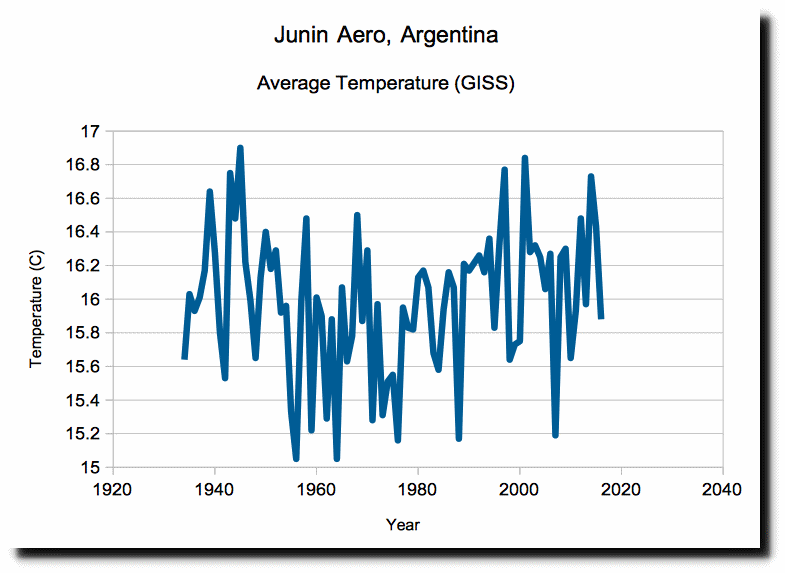
NASA has cleverly cooled the past there to hide the 1940’s warmth.
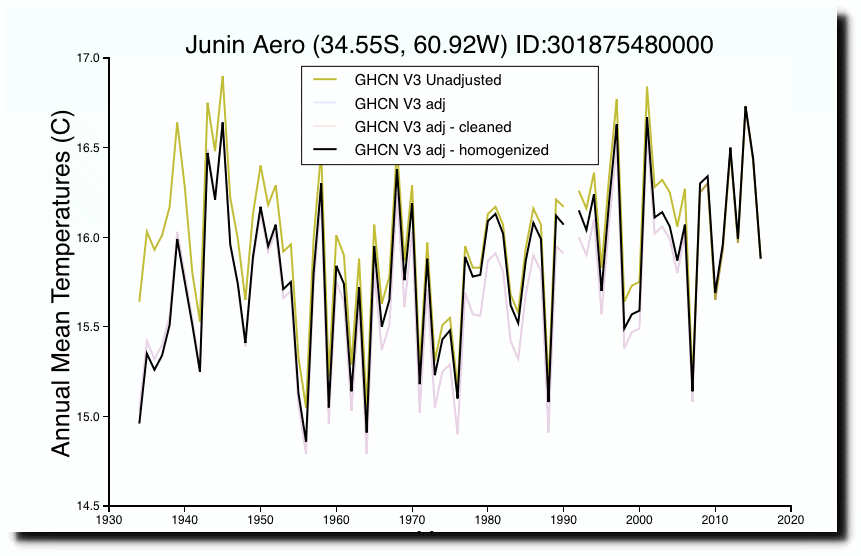 Data.GISS: GISS Surface Temperature Analysis
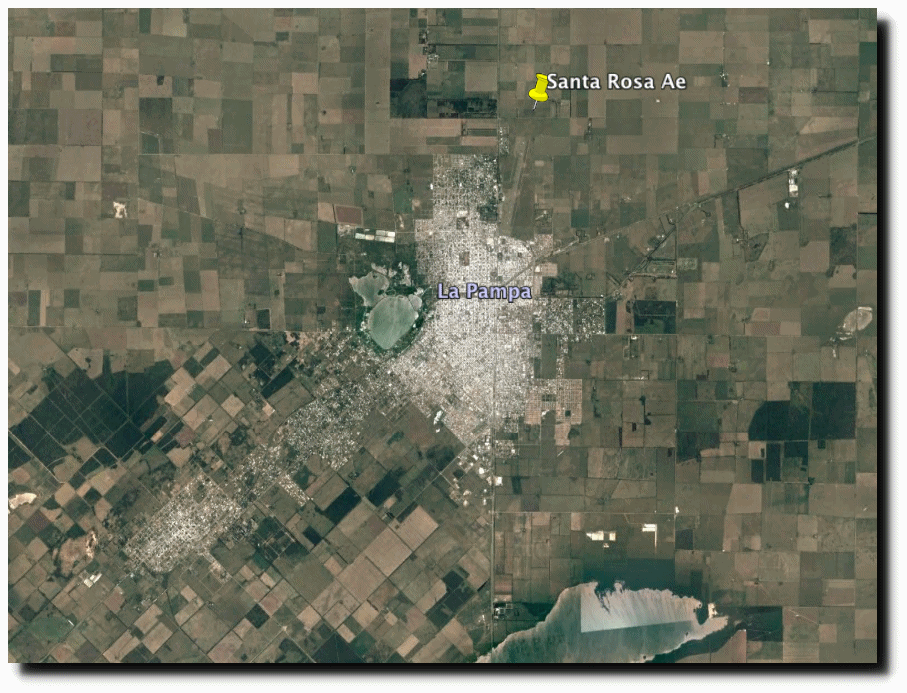
Santa Rosa Aero also is a rural station which shows no warming since 1940.
NASA has erased the 1940’s warmth there too.
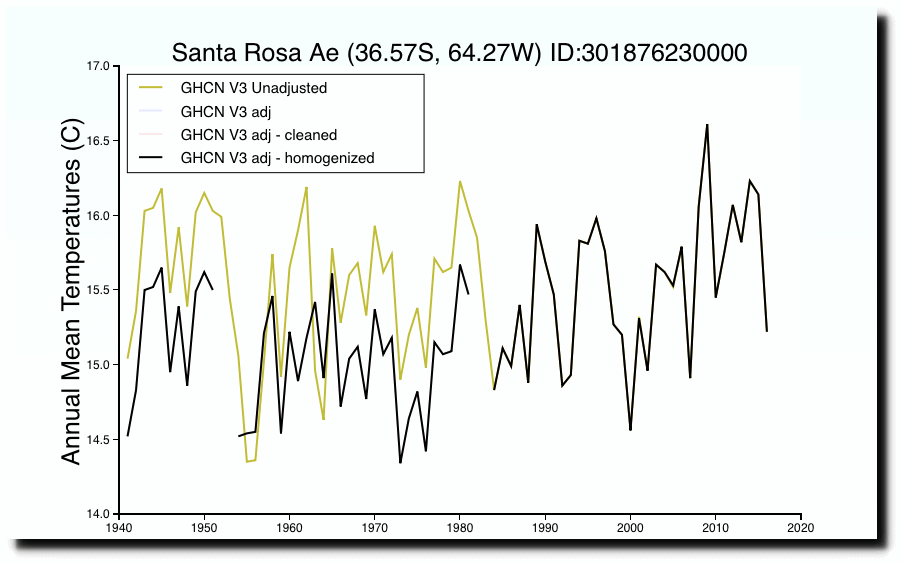
Data.GISS: GISS Surface Temperature Analysis
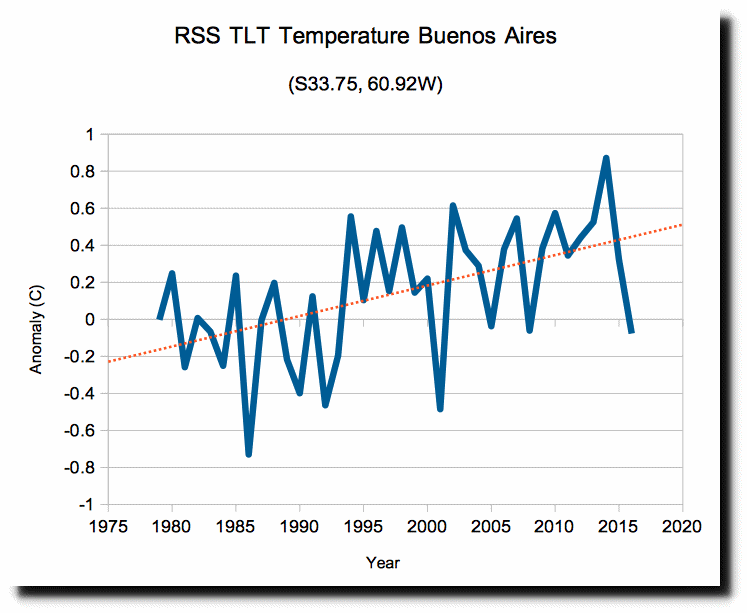
Both of these stations agree with RSS satellite data, showing about 0.5C warming since 1979.
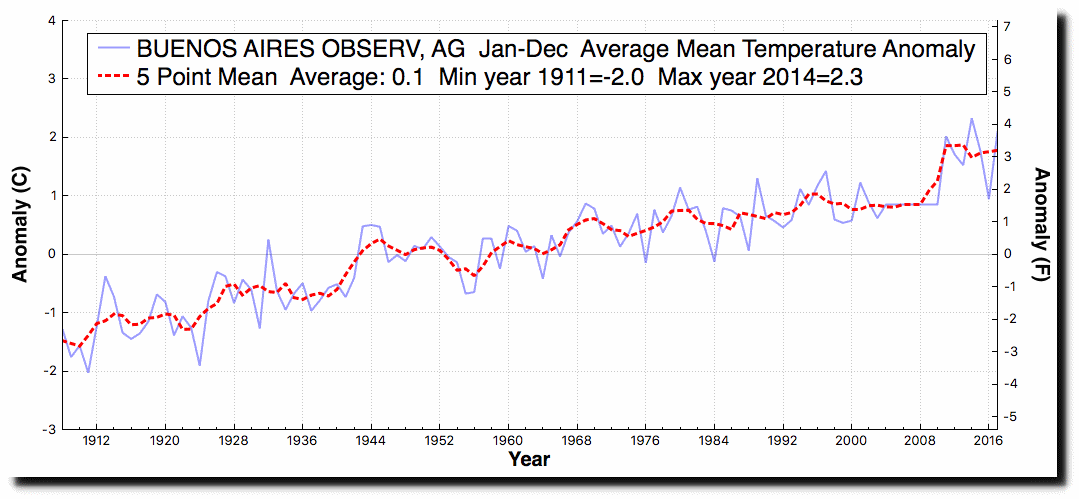
The third station is located in the middle of Buenos Aires, and shows about 3C warming since 1910, with current temperatures almost 2C warmer than 1940.

The only reason anyone believes that the world is warmer now than 1940 is because of Urban Heat Island effects like Buenos Aires, and junk science by NASA, NOAA, Richard Muller, Zeke and Mosher.
Posted in Uncategorized
Leave a comment
You Really Can’t Make This Stuff Up
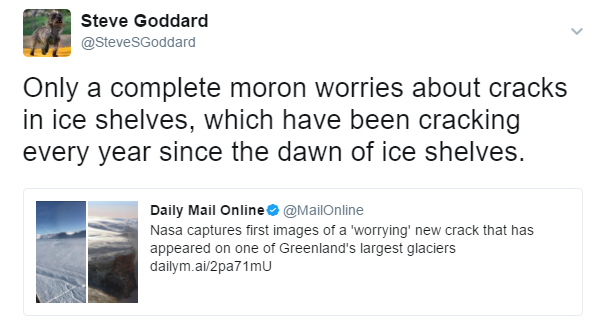
Some days I feel like we live in a Monty Python skit.
Posted in Uncategorized
Leave a comment
Bad Data And Bad Data Practices
Normally I focus on data tampering and fraud by NASA and NOAA, but there is another big problem. Their surface temperature data itself is garbage.
There are very few stations with long term records in South America, but one of them is the Mendoza, Argentina airport. That thermometer shows more than 1.5C warming since 1979, but satellite temperatures at that location show very little warming.
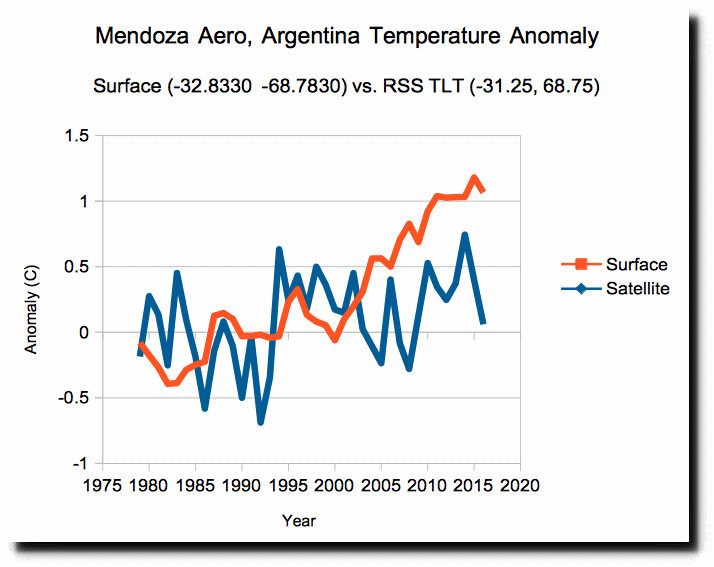
Surface and satellite temperatures are diverging there at a rate of almost three degrees per century.
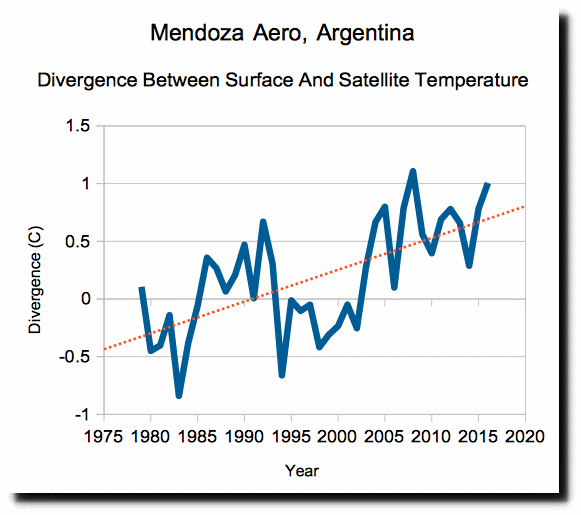
The thermometer is located at an airport on the edge of a large urban area.
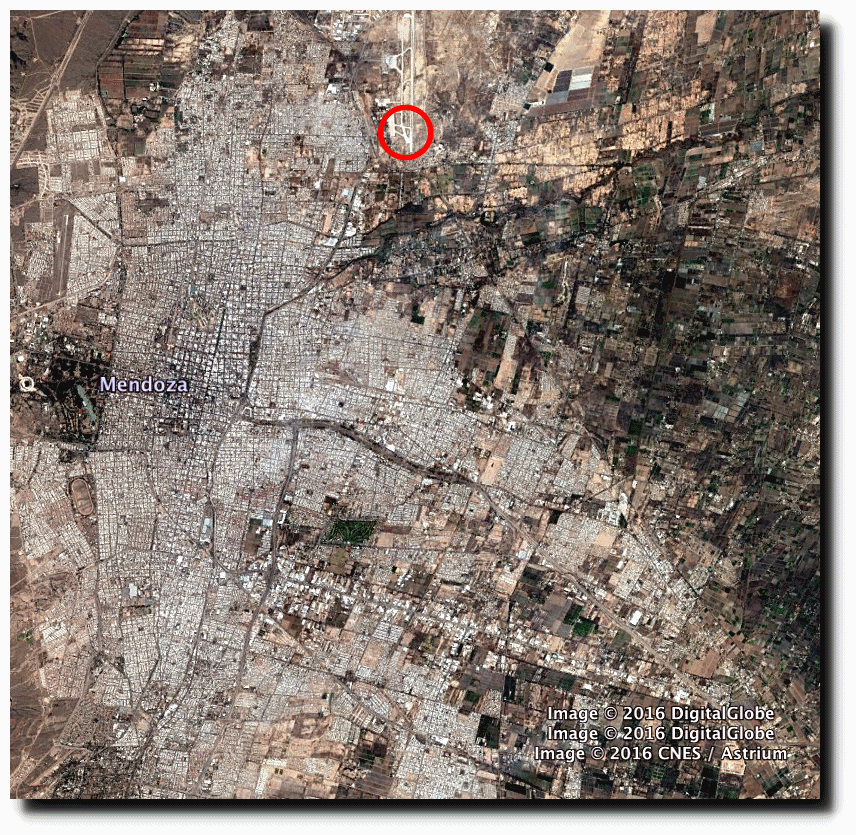
Mendoza appears to be warming, but it has nothing to do with climate.
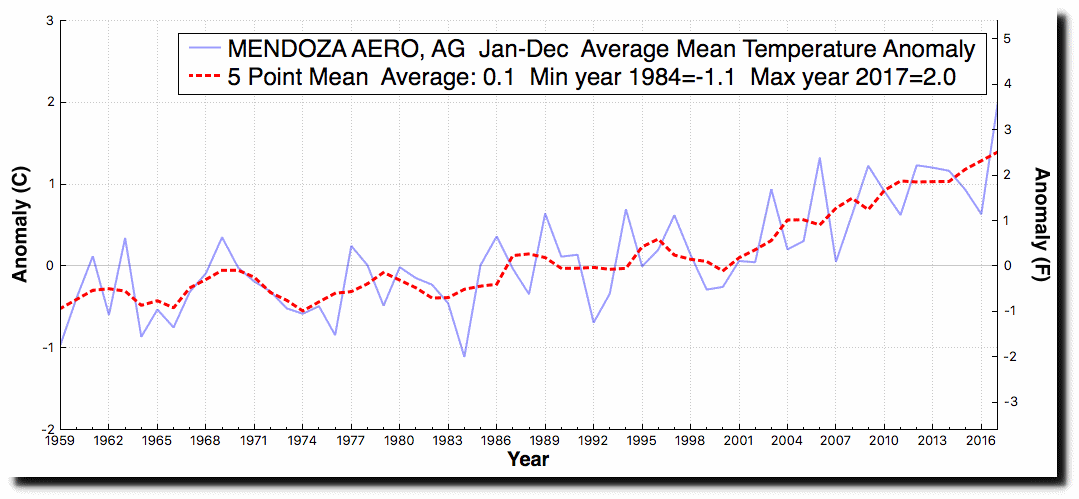
Policy is being driven by bad data and bad data practices, emanating from fake scientists at government agencies.
Posted in Uncategorized
Leave a comment
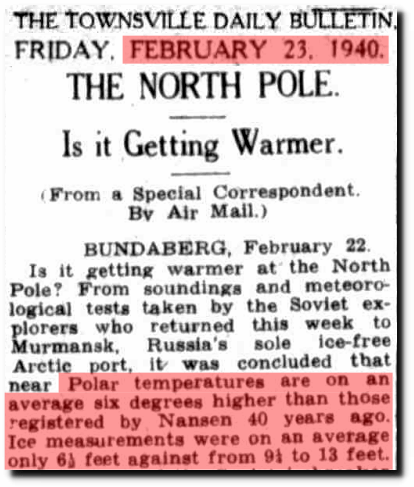
Arctic Sea Ice The Same Thickness As 1940
The Danish Meteorological Institute reports that Arctic sea ice is about two meters thick.
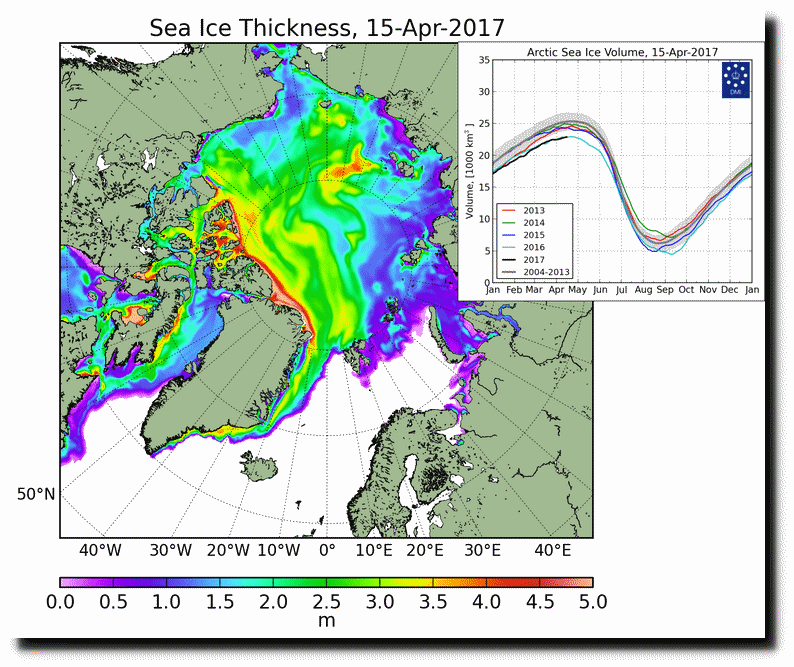
In 1940, Arctic sea ice was also about two meters thick.
In 1958, the New York Times reported that Arctic ice was about two meters thick, and that people carry a popular misconception that the ice is much thicker than it is. They also predicted an ice-free Arctic within one generation.
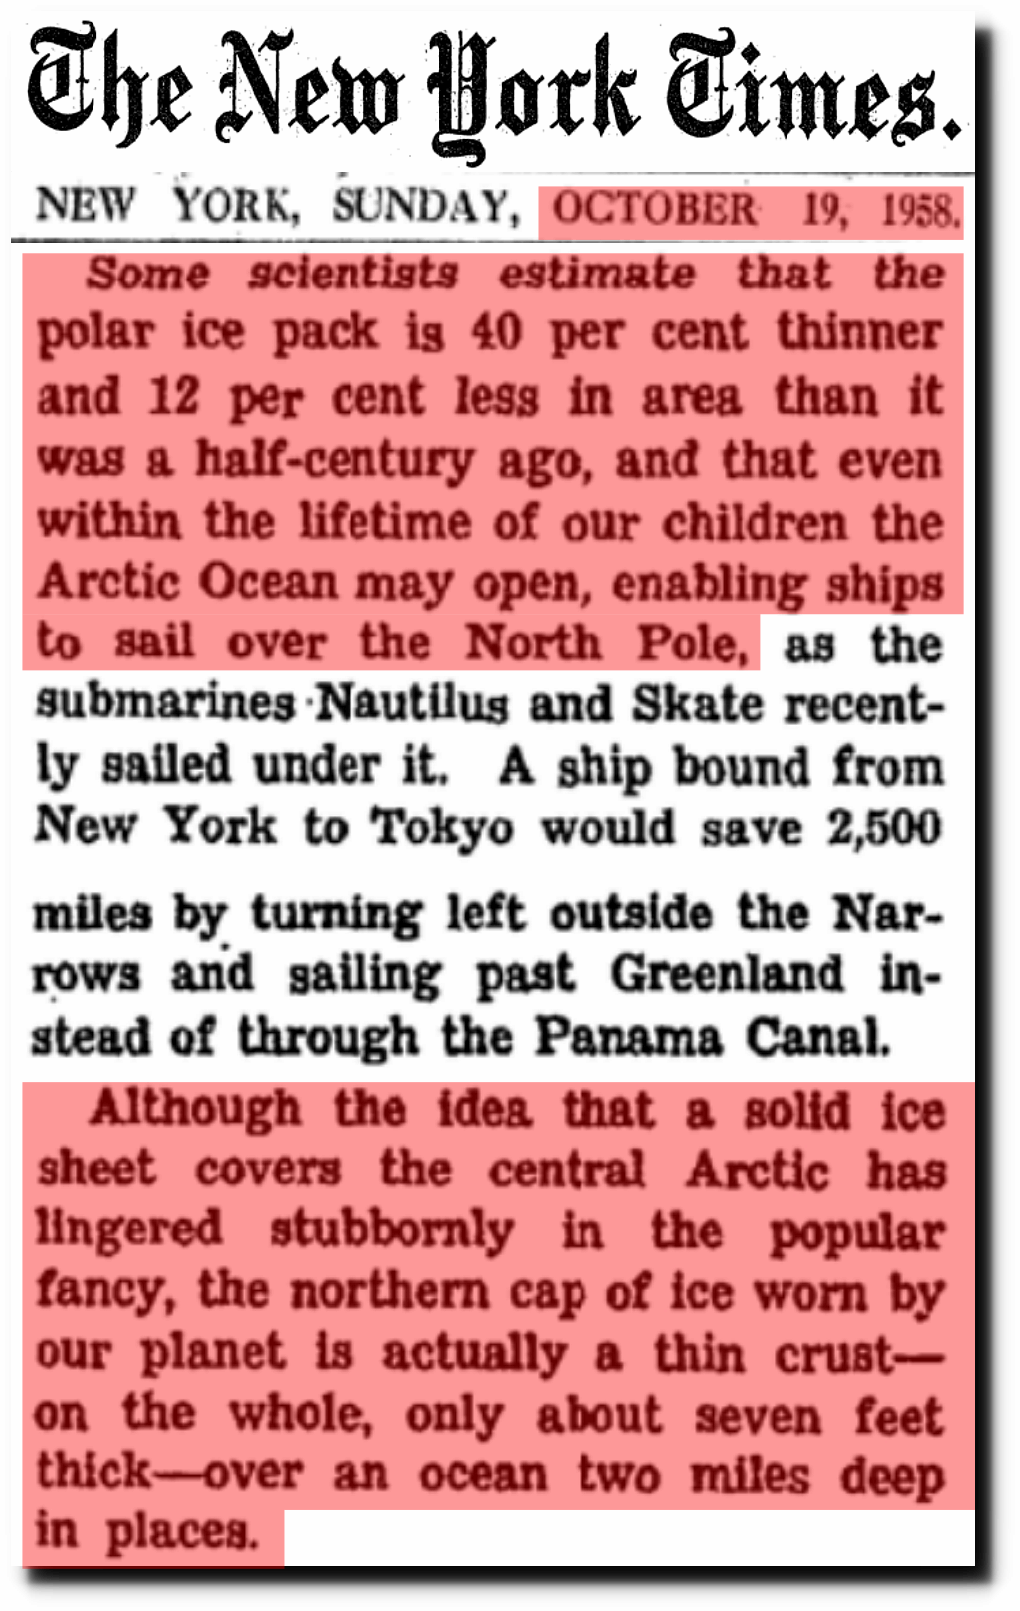
The Changing Face of the Arctic; The Changing Face of the Arctic – The New York Times
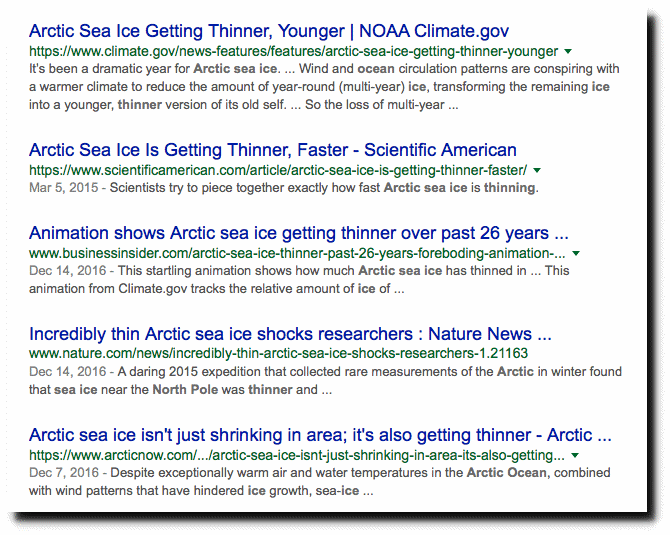
Arctic sea ice is about the same thickness as 75 years ago, but because people are constantly being lied to about climate by government scientists, they carry the same misconceptions which people had 60 years ago.
Posted in Uncategorized
Leave a comment
Michael Mann Continues His Extreme Meanders Of Climate Fraud
There are many crooks in the climate science business, but none more brazen than Michael Mann, who is now blaming California drought and “extreme meanders” in the jet stream on global warming.
Climate change is altering global air currents – increasing droughts, heatwaves and floods
One of the scientists who demonstrated conclusively that global warming was an unnatural event with the famous “hockey stick” graph is now warning that giant jetstreams which circle the planet are being altered by climate change.
Professor Michael Mann said extreme weather events – such as the “unprecedented” drought in California last year, the flooding in Pakistan in 2010 and the heatwave in Europe in 2003 – were happening more often than they should do, even taking the warming climate into account.
I blogged yesterday about how fraudulent this claim is.
This, he said, meant there had to be an additional factor.
Jetstreams are influenced by the difference in temperatures between the Arctic and the equator.
But the Arctic has been warming much faster than tropical climates – the island of Svalbard, for example was 6.5 degrees celsius warmer last year compared to the average between 1961 and 1990. The land has also been warming faster than the sea.
Both of those factors were changing the flow of these major air currents to create “extreme meanders” which were helping to cause “extreme weather events”, Professor Mann said.
Last year, another leading climate scientist warned that the rapid rate of warming in the Arctic could have a “catastrophic” effect on the weather in the northern hemisphere.
In a paper in the journal Scientific Reports, Professor Mann and other researchers wrote that evidence of the effect of climate change on the jetstreams had “only recently emerged from the background noise of natural variability”.
This claim is just as fraudulent as everything else Mann says. Forty years ago, experts said the exact opposite. They blamed California drought and extreme meanders in the jet stream on global cooling.

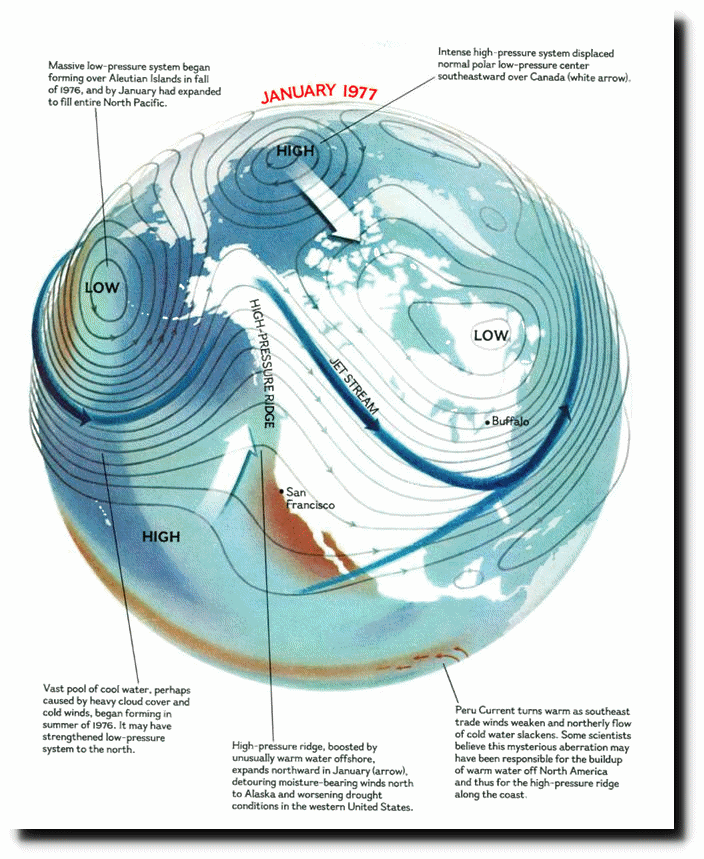
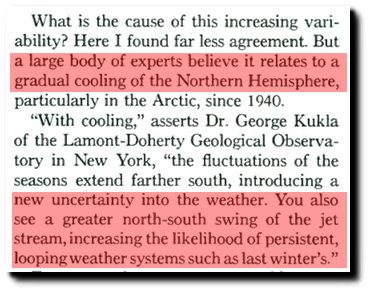
the 1977 drought is judged by experts as more severe than the 1930’s.
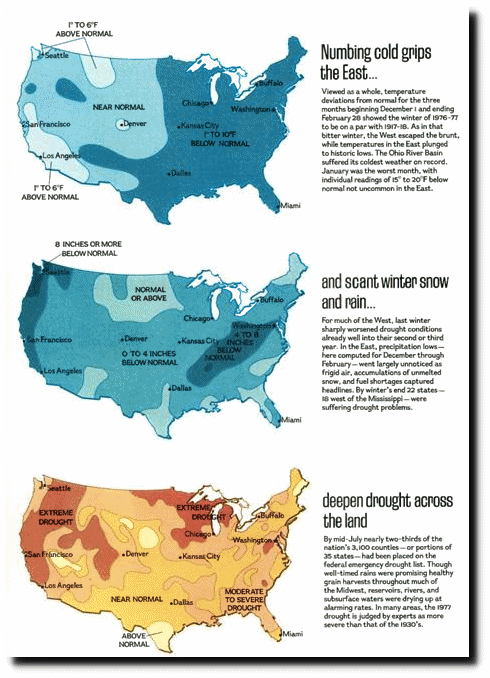
National Geographic : 1977 Dec, Page 822
Mann reported 6.5 degrees Arctic warming as proof of his Mann made global warming theory. But in 1947, experts reported ten degrees Arctic warming since 1900.
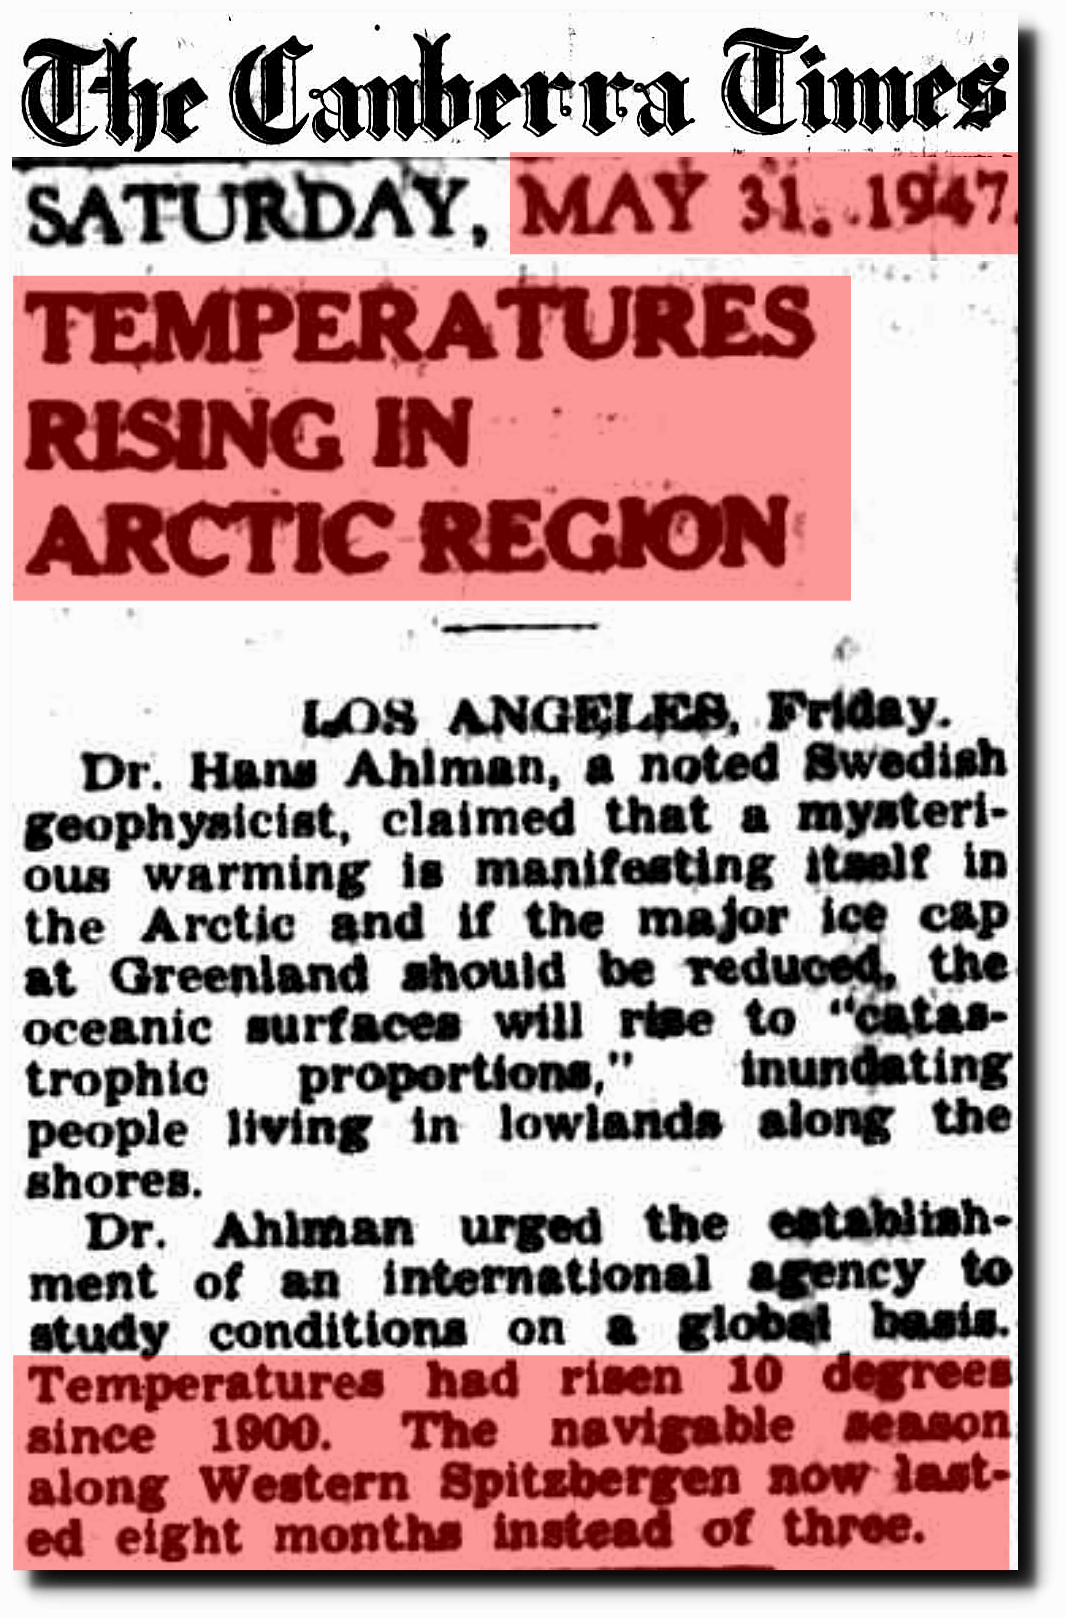
31 May 1947 – TEMPERATURES RISING IN ARCTIC REGION
Global warming theory had been disproved by 1991, after 45 years of Arctic cooling and thickening Arctic ice.
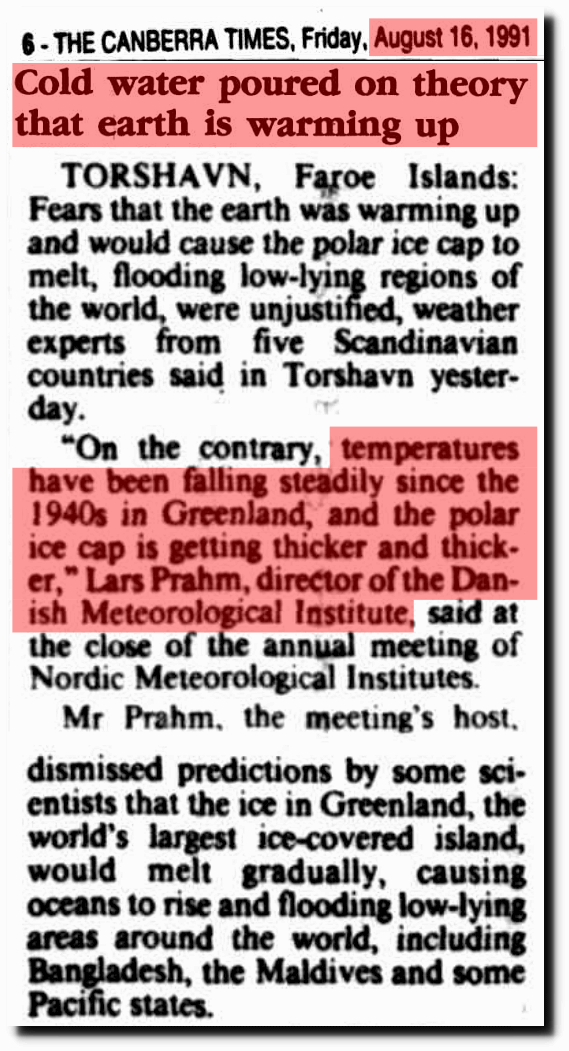
16 Aug 1991 – Cold water poured on theory that earth is warming up
Actual science and facts weren’t going to bring any money in for fraudsters like Mann and Gavin Schmidt at NASA, so they simply erased the post-1940 Arctic cooling.
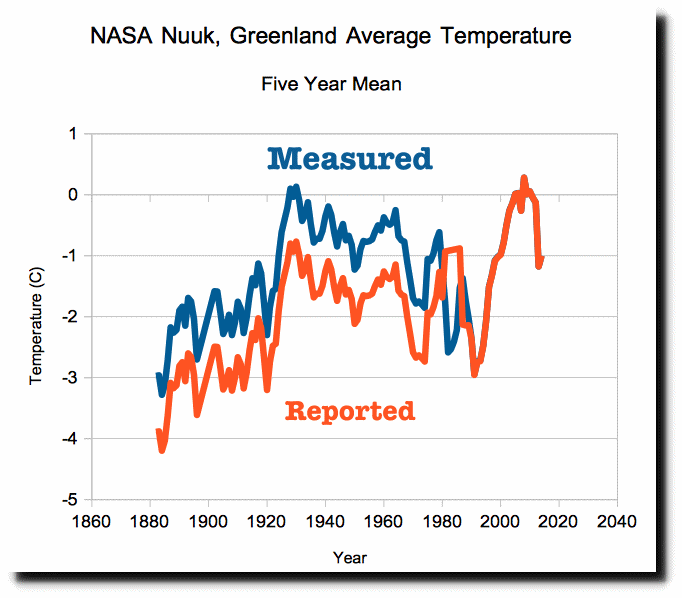
Data.GISS: GISS Surface Temperature Analysis
Global warming is the biggest scam in science history, There is no indication that the climate is changing in any way other than natural cycles, so government funded climate scamsters alter data and then use the fake data as the basis for their junk science theories.
Posted in Uncategorized
Leave a comment