Climate Hustle Next Monday – One Night Only

Your chance to help end this scam. Next Monday night (May 2) is a one night showing of Marc Morano’s movie Climate Hustle in 400 theaters across the US. If the showing gets a big turnout, there may be repeat performances.

The movie is very entertaining and shows how ridiculous the climate scam is. We need as many people as possible to see this ahead of the election. Please buy your tickets in advance,  and help fill the theaters up.

2016-04-26073600

Official Climate Hustle Site

Posted in Uncategorized | 11 Comments

The Surface Temperature Record Is A Farce

Ahead of Obama’s Paris meeting, Gavin and Tom made the global warming hiatus disappear. They needed to make 2015 the hottest year on record for the official propaganda.

2016-04-26062341

Their data tampering was so offensive, that even Michael Mann couldn’t stomach it.

2016-04-26064756

Making sense of the early-2000s warming slowdown : Nature Climate Change

Satellite data shows that 2015 was nowhere near as warm as 1998 or 2010, and that there has been no warming for nearly two decades.

2016-04-26062415

NASA surface temperatures are now diverging from actual temperatures  at a rate of 1.3C/century. 21st century global warming is entirely due to Gavin and Tom’s fake surface temperature graphs.

2016-04-26061548

2016-04-26062833

It will be interesting to see how the scam unfolds with a new president, solar minimum and a La Nina setting in.

sst_anom (4)

sst_anom.gif (800×600)

Democrats are calling for prosecution of people who lie about the climate. People who live in glass houses probably shouldn’t throw stones.

Posted in Uncategorized | 14 Comments

NASA – Doubling Sea Level Rise By Data Tampering

NASA has doubled 1880 to 1980 sea level rise since Hansen 1983. In 1983, NASA showed very little sea level rise after 1950. Now they show rapid sea level rise from 1950 to 1980.

2016-04-25065924

 1983: 1983_Hansen_etal_2.pdf  2016 :Sea Level

This fraud should not surprise anyone, because they have also doubled global warming via data tampering during that same time period.

Posted in Uncategorized | 27 Comments

Climate Science – A Data Free Science

Scientists say that Silicon Valley is going to drown due to sea level rise.

2016-04-25062904

2016-04-25062915

Screen-Shot-2016-04-25-at-09.42.43

Facebook’s shiny new HQ will disappear thanks to global warming

Had they done even the most minimal research, they would have know that sea level in the San Francisco Bay is currently 8.6 inches lower than it was on the same date 75 years ago.

9414750

Sea Level Trends – State Selection

Climate scientists collect huge amounts of grant money to simply make up propaganda for the government.

Posted in Uncategorized | 8 Comments

NASA – Clueless And Dishonest

James Hansen told Congress in June 1988 that it was going to be the hottest year ever. But by December he had backed down because a La Nina caused temperatures to plummet, which he called “unusual Pacific Ocean currents.”

2016-04-25052021

Ellensburg Daily Record – Google News Archive Search

Hansen said at the time that earth had warmed half a degree over the past 100 years. NASA now shows almost double that much warming from 1888 to 1988. They constantly increase historical warming, because they think no one will notice.

Fig.A (2)

Fig.A.gif (656×446)

NASA has already announced that 2016 is the hottest year ever, and once again we appear to have another La Nina setting in.

sst_anom (3)

sst_anom.gif (800×600)

However, this time around I wouldn’t bet against NASA making 2016 the hottest year ever, because they no longer make any pretense about trying to be honest and have already jacked 2016 up 0.75C.

2016-04-25062135

Wood for Trees: Interactive Graphs

Posted in Uncategorized | 5 Comments

More Missouri TOBS

There is no meaningful difference in Missouri temperature trends between morning/night and afternoon stations. TOBS adjustments do nothing but corrupt the data set.

2016-04-24181451

2016-04-24174740 2016-04-24174728

Posted in Uncategorized | 3 Comments

Hiding The Decline In Missouri

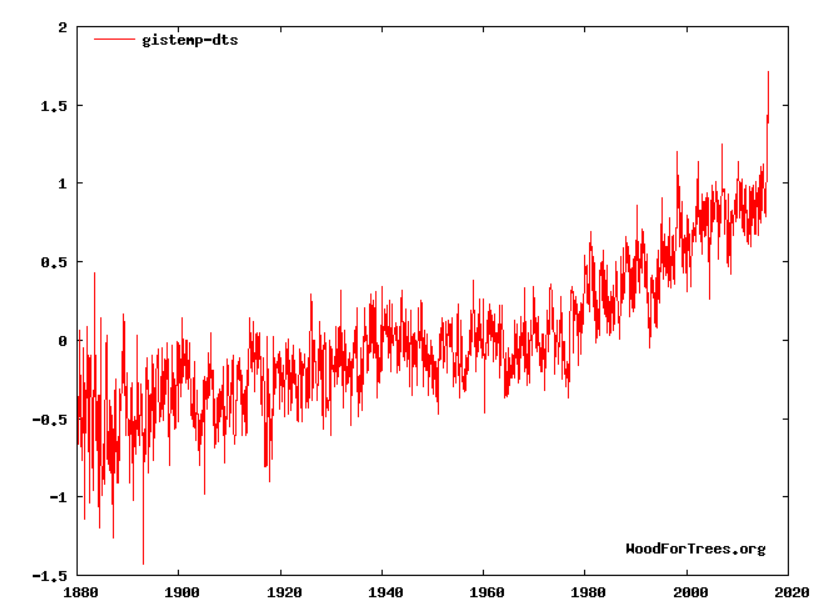
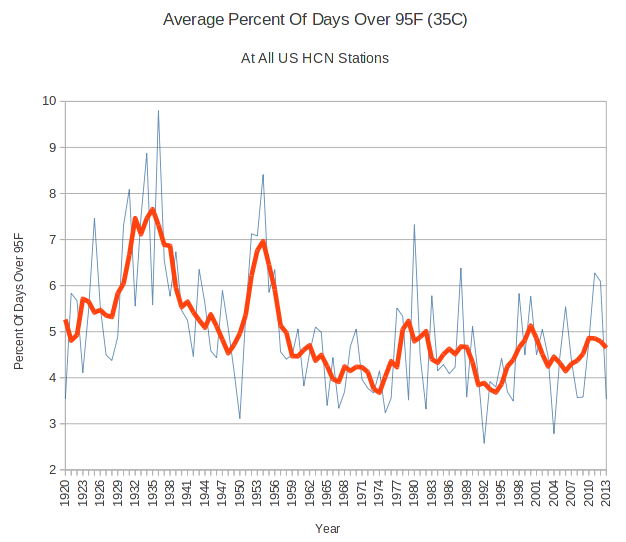
One of the primary excuses used by NOAA to hide the decline in the US temperature record, is Time Of Observation Bias (TOBS.) The theory is that people used to be incredibly stupid and reset their max/min thermometers only once per day – in the afternoon. This would cause double counting of some high temperatures, and result in historical temperatures which were too high.

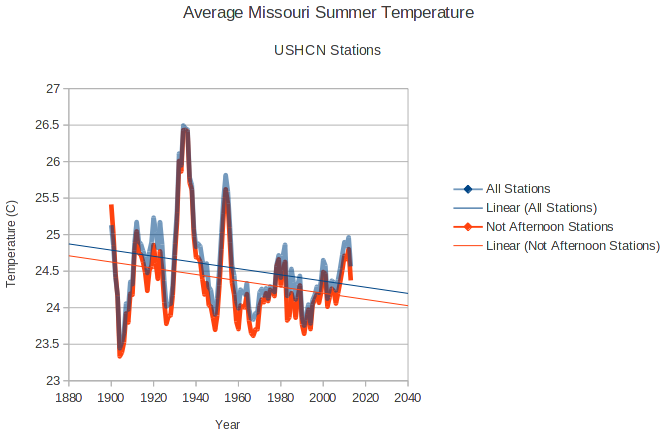
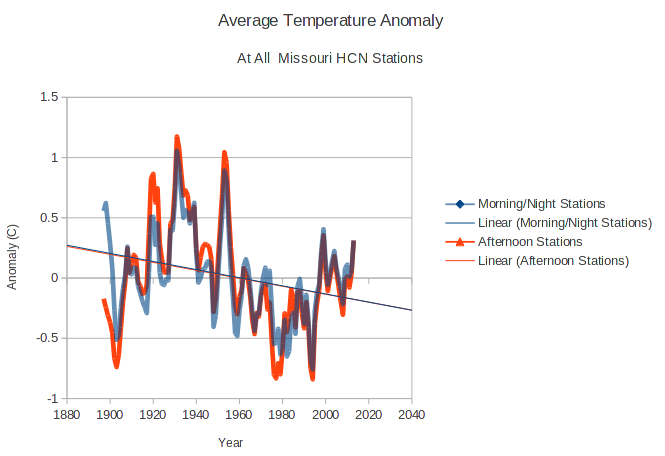
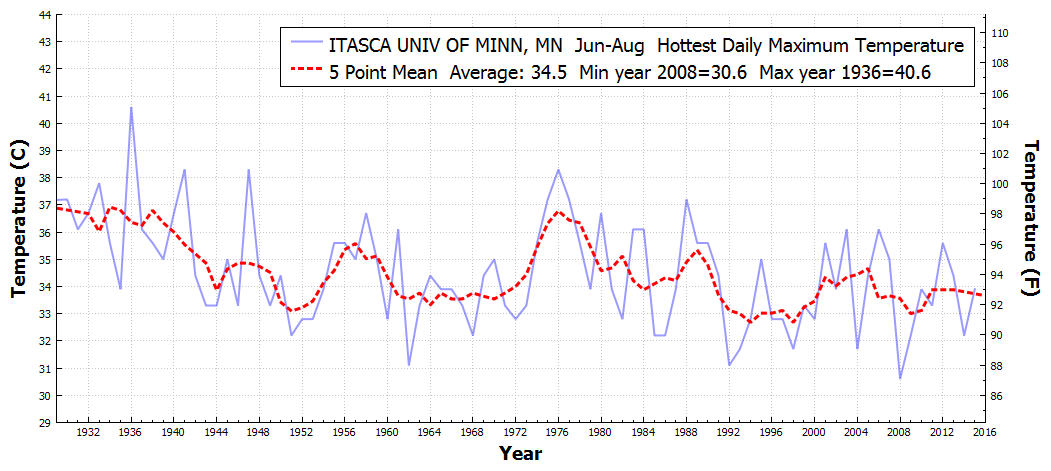
This theory is easy to test.  Half of the stations in Missouri took their min/max readings during July 1936 in the afternoon, and the other half took them at morning or night during that month. I separated those groups out and found that it makes no difference to summer temperature trends.

The group of morning/night stations has been cooling at almost exactly the rate as the group of all stations. Also note that summer temperatures in the 1930’s are essentially identical in the two groups. No matter what tricks NOAA uses to hide the decline in US temperatures, it doesn’t change the facts.

2016-04-24131710

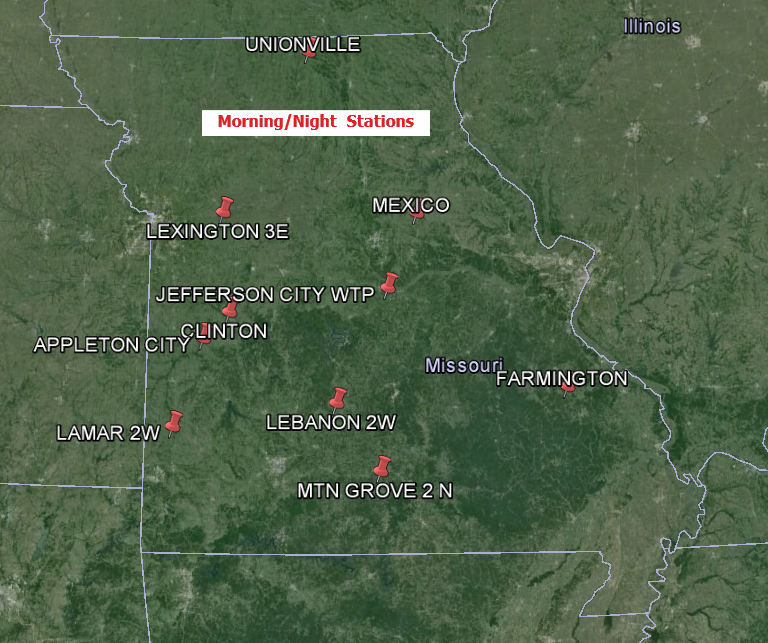
Morning/night stations.

                                                                  
APPLETON CITY           MO  USC00230204
CLINTON                 MO  USC00231711
FARMINGTON              MO  USC00232809
JEFFERSON CITY WTP      MO  USC00234271 
LAMAR 2W                MO  USC00234705
LEBANON 2W              MO  USC00234825
LEES SUMMIT REED WR     MO  USC00234850
LEXINGTON 3E            MO  USC00234904
MEXICO                  MO  USC00235541
MOBERLY                 MO  USC00235671
MTN GROVE 2 N           MO  USC00235834
SPICKARD 7 W            MO  USC00237963
UNIONVILLE              MO  USC00238523
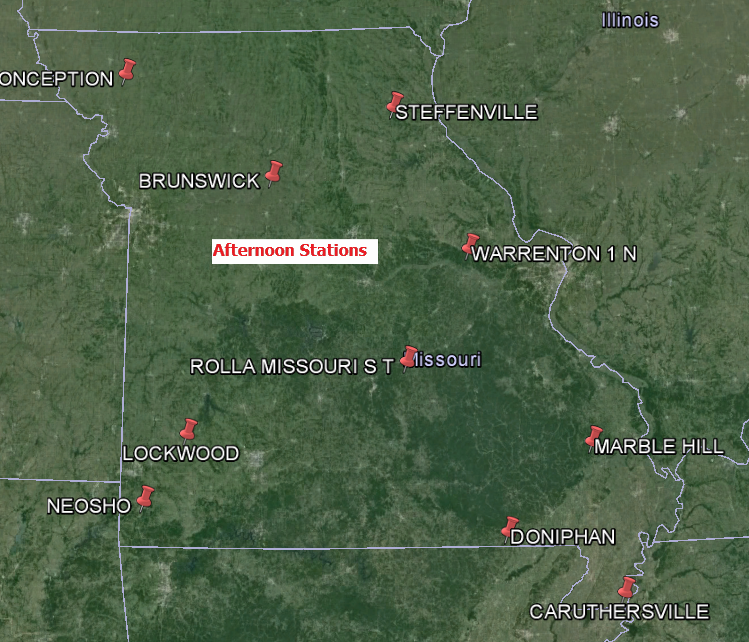
Afternoon stations

BOWLING GREEN 1 E       MO  USC00230856
BRUNSWICK               MO  USC00231037
CARUTHERSVILLE          MO  USC00231364
CONCEPTION              MO  USC00231822
DONIPHAN                MO  USC00232289
LOCKWOOD                MO  USC00235027
MARBLE HILL             MO  USC00235253
NEOSHO                  MO  USC00235976
ROLLA MISSOURI S T      MO  USC00237263
STEFFENVILLE            MO  USC00238051
SWEET SPRINGS           MO  USC00238223
TRUMAN DAM   RSVR       MO  USC00238466
WARRENTON 1 N           MO  USC00238725

2016-04-24174728 2016-04-24174740

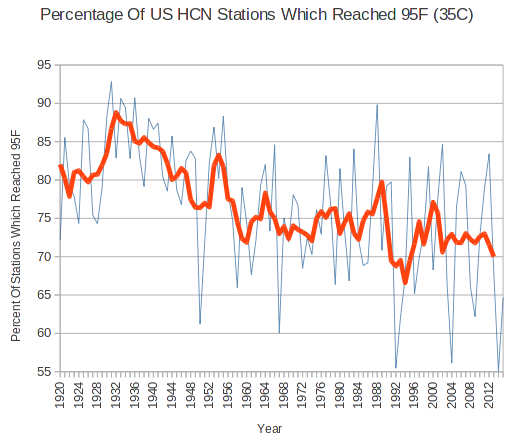
Another important test is the percentage of days over 100 degrees, comparing morning and afternoon stations. The result of this interesting – the morning/night stations actually have a higher frequency of hot days than the afternoon stations. This is the opposite of what TOBS theory would predict, and most likely due to the fact that the morning stations are generally further southwest than the afternoon stations.

2016-04-24173030

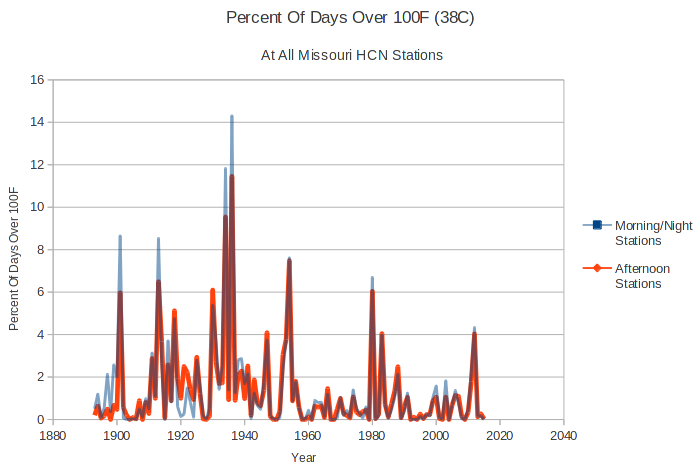
There is no indication that TOBS has a serious biasing effect, and no indication that the NOAA adjustments being done are legitimate.

Posted in Uncategorized | 11 Comments

A Repeat Of 2014?

Arctic temperatures this year have been behaving almost identically to 2014, which went on to be one of the coldest summers on record  north of 80N.

2016-04-24111722

meanT_2016.png    meanT_2014.png

Posted in Uncategorized | 9 Comments

Hiding The Decline In The US

EarthBurning

A favorite scare tactic of climate alarmists is that we are going to burn up in scorching summer heat. The evidence is overwhelming that the exact opposite is happening.

The areal coverage of hot afternoons in the US has plummeted over the last 95 years.

2016-04-24070210

The frequency of hot afternoons have also plummeted.

2016-04-24082057

And the hottest temperatures has also plummeted.

BLOOMINGTONINUNIV_IN_HottestDailyMaximumTemperature_Jan_Dec_1930_2015

ITHACACORNELLUNIV_NY_HottestDailyMaximumTemperature_Jun_Aug_1930_2016

STATECOLLEGE_PA_HottestDailyMaximumTemperature_Jun_Aug_1930_2016 HILLSBORO_OH_HottestDailyMaximumTemperature_Jun_Aug_1930_2016 MEEKER5W_OK_HottestDailyMaximumTemperature_Jun_Aug_1930_2016

MADISON_NE_HottestDailyMaximumTemperature_Jun_Aug_1930_2016

CALGARYINTL_CN_HottestDailyMaximumTemperature_Jul_Jul_1920_2016FTSCOTT_KS_HottestDailyMaximumTemperature_Jan_Dec_1930_2015 COLDWATER_KS_HottestDailyMaximumTemperature_Jan_Dec_1930_2015 PALESTINE_IL_HottestDailyMaximumTemperature_Jan_Dec_1930_2015 ITASCAUNIVOFMINN_MN_HottestDailyMaximumTemperature_Jun_Aug_1930_2016

July temperatures in Fort Scott, Kansas averaged almost 20 degrees hotter in 1954 than they did last year, which was NOAA’s HottestYearEver™

FTSCOTT_KS_DailyMaximumTemperatureF_Jul_Jul_1954_2015 Climate alarmism depends on a complete ignorance of both science, and history.

Posted in Uncategorized | 7 Comments

More On The CU Sea Level Screw Up

2016-04-23102014

2004 version: sl_cu2004_rel1.2.pdf     2015 version: 2015_rel2

Based on comments yesterday, I am not sure that everyone recognized the gravity of this CU sea level disaster. Not only don’t the years line up on the X-Axis between the two versions, but in the 2004 version the Jason data begins an annual cycle earlier than in the 2015 version.

I have tried to figure out what sort of error could lead to this type of mess, and can’t fathom how it could have happened. It looks like they are just making data up.

Posted in Uncategorized | 8 Comments