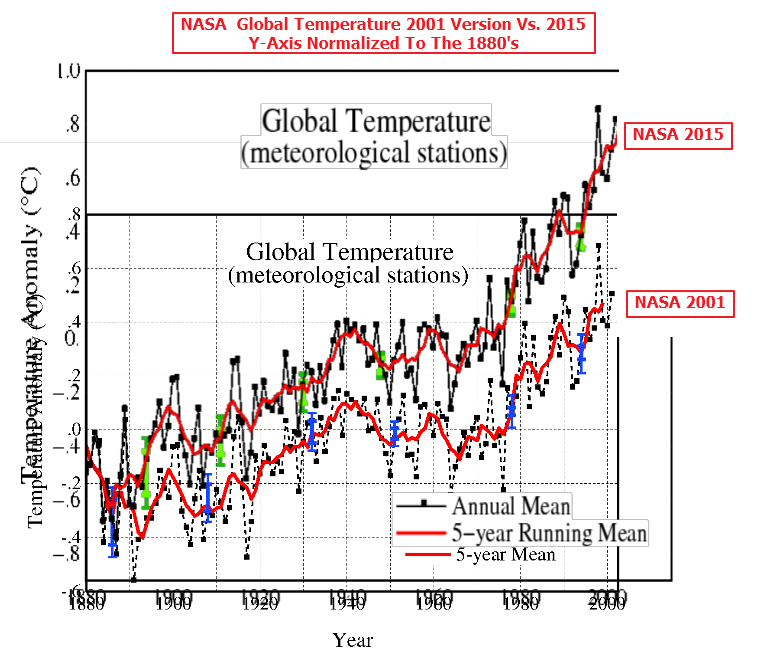
In 1981, NASA showed a little over 0.3C warming from 1900 to 1980 at 23°S- 90°S
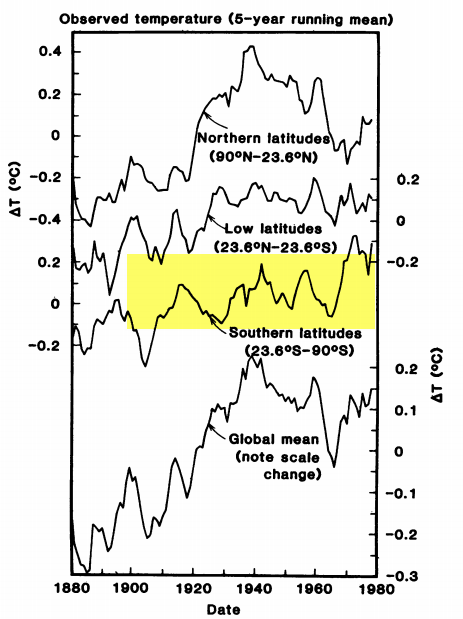
pubs.giss.nasa.gov/docs/1981/1981_Hansen_etal_1.pdf
They now show about 0.8C warming during that same time period for 23°S- 90°S
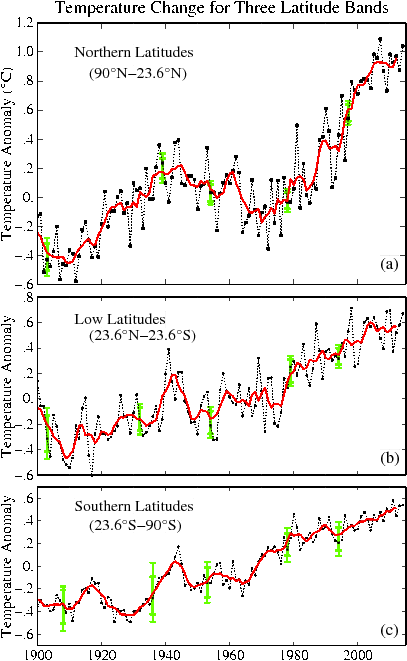
Fig.B.gif (407×661)
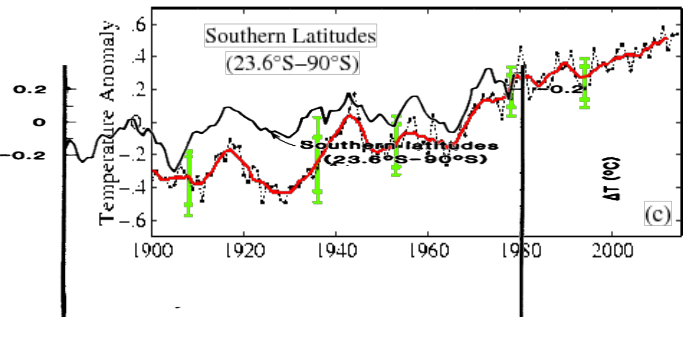
The next image overlays the two graphs at the same scale. Note how Gavin Schmidt massively cooled the past, to increase Southern Hemisphere warming.
Gavin’s data tampering didn’t stop in 1980 however. Since 2001, Gavin erased a 0.2C cooling in that region from 1990 to 2000.
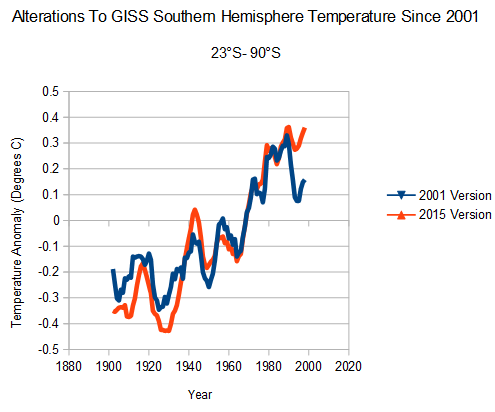
2001 version: FigB.txt
2015 version: Fig.B.txt
As with the Northern Hemisphere, Gavin has cooled pre-1960 temperatures and warmed post-1960 temperatures.
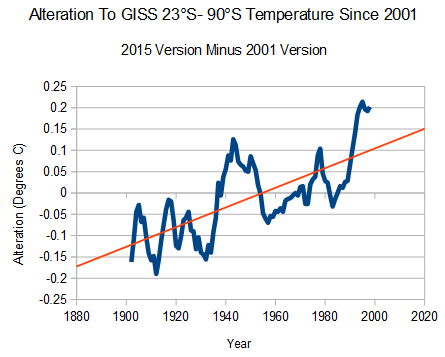
But with Gavin, the data tampering never stops. Since 2004, Gavin warmed 1980-2000 23°S- 90°S temperatures by about 0.1C.
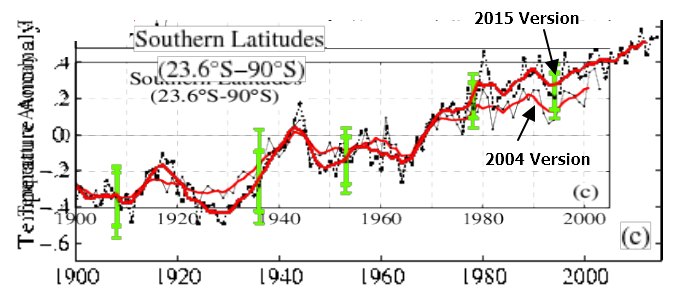
2004 version: Fig.B.ps
This might be considered surprising, because Gavin knows that Antarctica cooled significantly during that period.
Shindell, D.T., and G.A. Schmidt 2004.
While most of the Earth warmed rapidly during recent decades, surface temperatures decreased significantly over most of Antarctica.
Pubs.GISS: Abstract of Shindell and Schmidt 2004
NASA temperature graphs have little or nothing to do with the actual temperature of the earth. They are simply propaganda tools for the White House. Gavin will argue that the addition of fake historical ocean temperatures altered the trend, but buffering by the thermal mass of the oceans would have the opposite effect of reducing warming – not increasing it.
“A lie told often enough becomes the truth.”