Ångström Was Correct

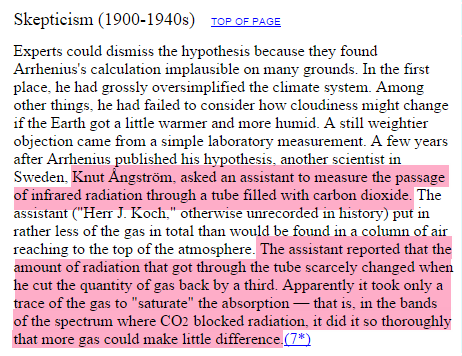
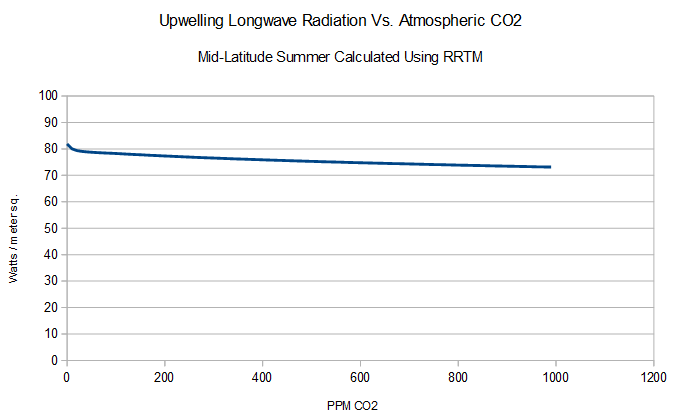
Knut Ångström discovered over 100 years ago that changing the amount of CO2 in the air has very little impact on how much longwave radiation is transmitted. This is the same thing which climate models show. The graph below was generated with data from one of the standard radiative transfer models used in climate and weather models.

As you can see, changing CO2 levels has little impact on the amount of radiation transmitted to the upper atmosphere in the mid-latitude summer.
2015-10-27-07-07-25

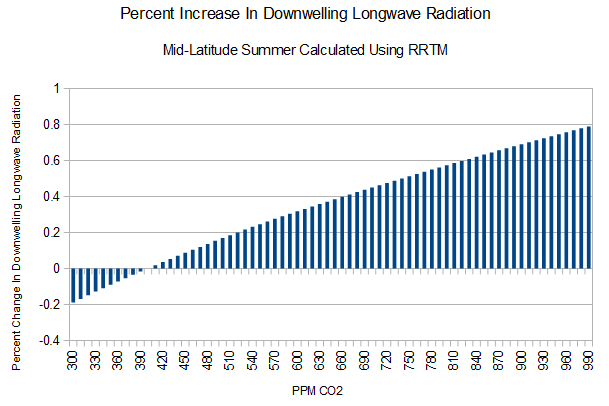
But it’s worse than it seems. The interesting thing is the amount of downwelling longwave radiation. This is the greenhouse effect. An increase to 1,000 PPM CO2 would increase the amount of downwelling longwave radiation in the mid-latitude summer by less than one percent. The concept being promoted by fraudsters Katherine Hayhoe and Heidi Cullen that summers will get much hotter as CO2 increases, is patently absurd. Correct use of models shows nothing of the sort.
2015-10-27-07-01-44

The whole climate scam is based around Hansen’s fake feedbacks. CO2 has very little effect.

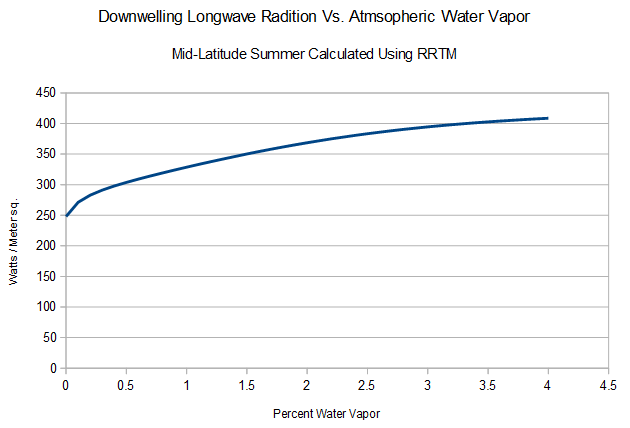
On the other hand, downwelling longwave radiation is strongly affected by humidity. A humid day will have 60% greater longwave radiation hitting the ground than a dry day. This is one reason why humidity makes the weather feel hotter. A one percent change in humidity has far more effect than a 100% change in CO2.
2015-10-27-07-27-11

If Hansen’s feedbacks were correct, one humid day would start the whole world spiraling towards thermal Armageddon. His theories are patently absurd.

Posted in Uncategorized | 8 Comments

“They Attribute” It To Global Warming

2015-10-27-04-51-34

Literally Washing Away

The cemetery, located near Rita on the west end of Majuro, has been eroding for a decade or more, islanders say, something they attribute in part to global warming. The ocean inundations are larger and occurring with greater frequency. In Laura, on the east side of the atoll, one cemetery is reported to be already underwater.

Global Warming: The Effects of Climate Change in Micronesia

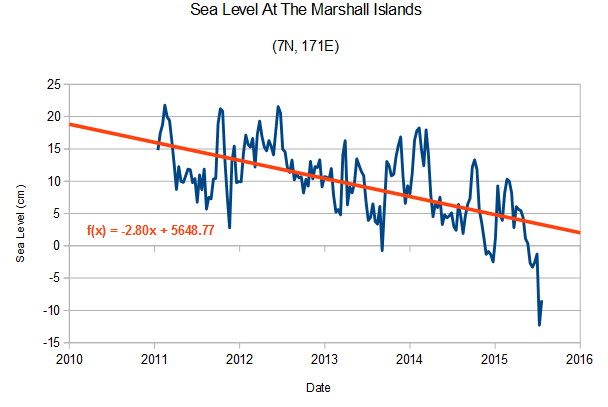
These people attribute their problems to global warming, and the author of the article is happy to push their propaganda. Chad Blair didn’t bother to check that sea level has been falling there for the past four years, and is the lowest in 17 years.

2015-10-27-04-50-23Interactive Sea Level Time Series Wizard | CU Sea Level Research Group

Chad Blair believes that building windmills in Kansas will stop the land from sinking in Micronesia.

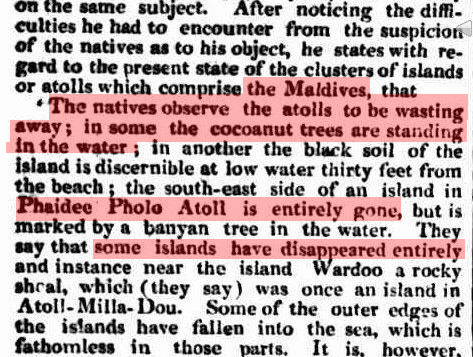
The identical phenomenon was occurring in the Maldives two hundred years ago. It has nothing to do with CO2 or “climate change”

ScreenHunter_4964 Dec. 06 06.09ScreenHunter_4963 Dec. 06 06.08

17 Feb 1837 – ACCOUNT OF THE MALDIVES.

Posted in Uncategorized | 14 Comments

Another Smoking Gun Of NASA Fraud

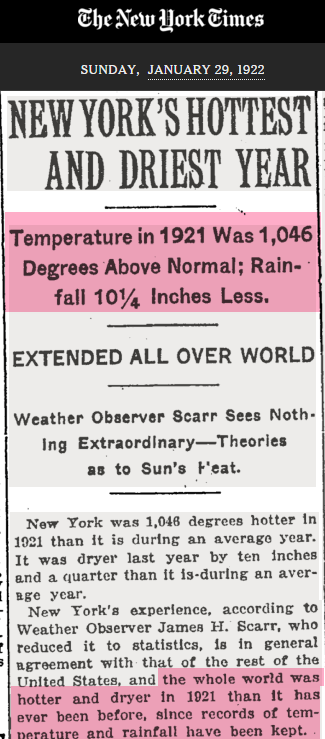
The New York Times reported that 1921 was very hot and dry around the planet.

2015-10-26-22-30-50

TimesMachine: January 29, 1922 – NYTimes.com

The criminals at NASA have since erased it, and made 1921 one of the coldest years on record.

Image 13

Posted in Uncategorized | 17 Comments

Climate Scientists – Living The Big Lie For Over A Century

Knut Ångström demonstrated over a century ago that adding more CO2 has minimal impact on Earth’s radiative balance. Climate scientists either ignore this completely, or lie about the significance of his findings.

2015-10-26-02-21-10

The Carbon Dioxide Greenhouse Effect

Adding more CO2 has very little effect. That is why Hansen had to invent his fake positive feedbacks.

Posted in Uncategorized | 22 Comments

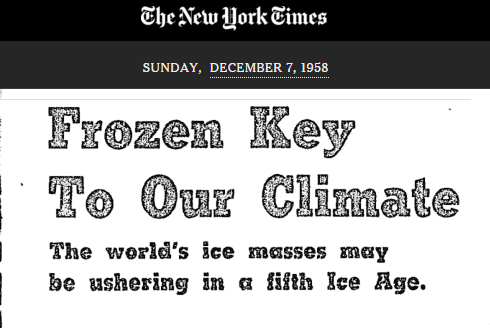
1958 : New York Times Predicted A New Ice Age, Six Weeks After Predicting An Ice-Free Arctic

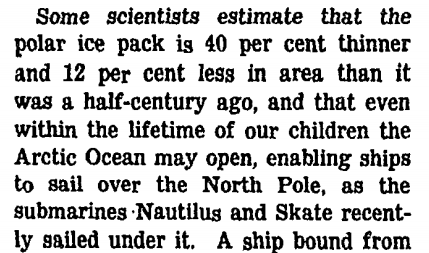
On October 19, 1958 the New York Times predicted an ice-free Arctic in the near future.

2015-10-26-19-20-212015-10-26-19-19-51

The Changing Face of the Arctic – View Article – NYTimes.com

Six weeks later they predicted a new ice.

2015-10-26-19-25-48 December 7, 1958 – NYTimes.com

Posted in Uncategorized | 4 Comments

NASA – Tampering Their Way To 2.0

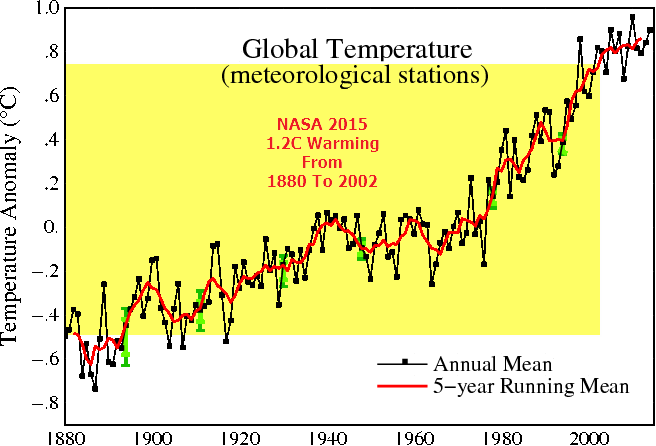
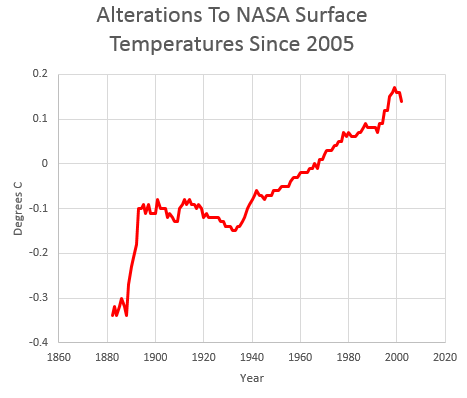
In 2005, NASA only showed 0.75C warming from 1880 to 2002

Fig.A.20051019http://data.giss.nasa.gov/gistemp/graphs/Fig_A.pdf

That wasn’t going to scare anyone about the mythical two degrees, so they changed the data to show 1.2C warming from 1880 to 2002

Fig.A (4)

Fig.A.gif (656×446)

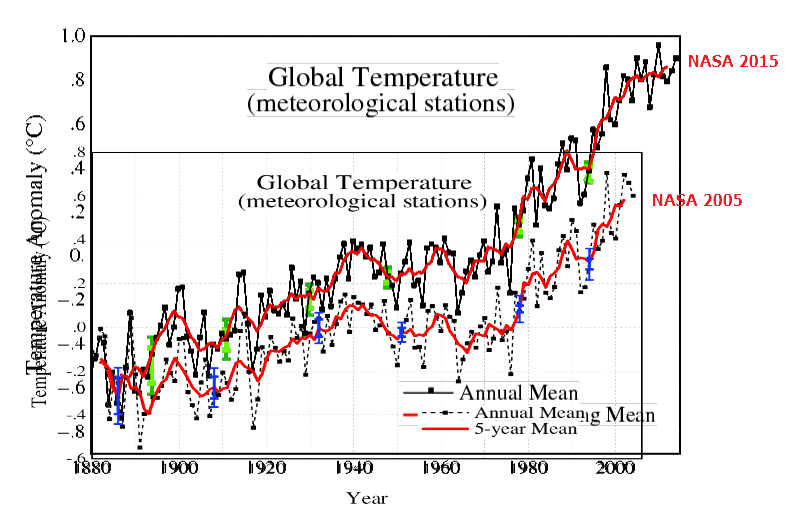
The next graph overlays the 2005 and 2015 versions, normalized to the 1880s. This view shows the massive alterations which NASA has made over the past ten years, which sit on top of all of their earlier massive data tampering.

2015-10-26-15-02-28

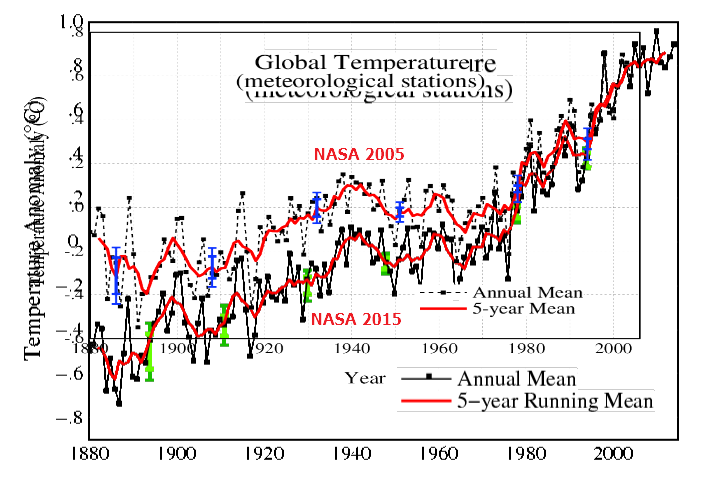
Here is another view, which normalizes the data to the most recent common decade

2015-10-26-20-11-57

Almost half of current global warming is due to the data tampering NASA and NOAA have done, just since 2005.

2015-10-26-17-22-45

2005 version: Fig_A.txt
2015 version: Fig.A.txt

Gavin understands that he is working with a huge data set that is very difficult for most people to analyze, and that he can basically do whatever he wants to it and get away with it.

Posted in Uncategorized | 6 Comments

More On The Patricia Fraud

Category five hurricanes cause nearly complete devastation of everything in their path.

2015-10-26-08-42-562015-10-26-08-41-48

Saffir-Simpson Hurricane Wind Scale

The damage from Patricia was not consistent with a category five hurricane. It would be very interesting to find out what that story was all about, other than more government propaganda ahead of Paris.

2015-10-25-16-29-12635813013112709631-Patricia1

Strongest hurricane ever was the official government claim. Complete nonsense.

Posted in Uncategorized | 21 Comments

Texas Snake Oil Salesmen

2015-10-26-07-58-43

Texas is vulnerable to warming climate – Houston Chronicle

Four years ago, Texas academics predicted that Texas weather would be hot and dry for the rest of the century, like the summer of 2011. And that they could fix it.

Texas has since turned very wet, and none of the state is in drought.

6mPNormUS

6mPNormUS.png (688×531)

The frequency of hot days in Texas has plummeted. The year 2011 was a statistical outlier which they claimed was a trend.

2015-10-26-08-14-57

Before NOAA data tampering, Texas temperatures have dropped over the past century.

2015-10-26-08-13-02

The heat and drought of 2011 was caused by cold water in the Eastern Pacific. This year they have warm water in the eastern Pacific, which normally leads to more rain in Texas. These academics are classic snake oil salesmen. They claim they can cure a non-existent malady.

Posted in Uncategorized | 4 Comments

Spectacular USHCN Data Tampering At Crosbyton, Texas

CrosbytonTxUSHCNDataTampering

There hasn’t been any warming Crosbyton, Texas over the last 90 years. That didn’t suit the political agenda, so NOAA massively cooled the past to create a non-existent warming trend.

Posted in Uncategorized | 3 Comments

Katherine Hayhoe’s Spectacular Lies About Lubbock Heat

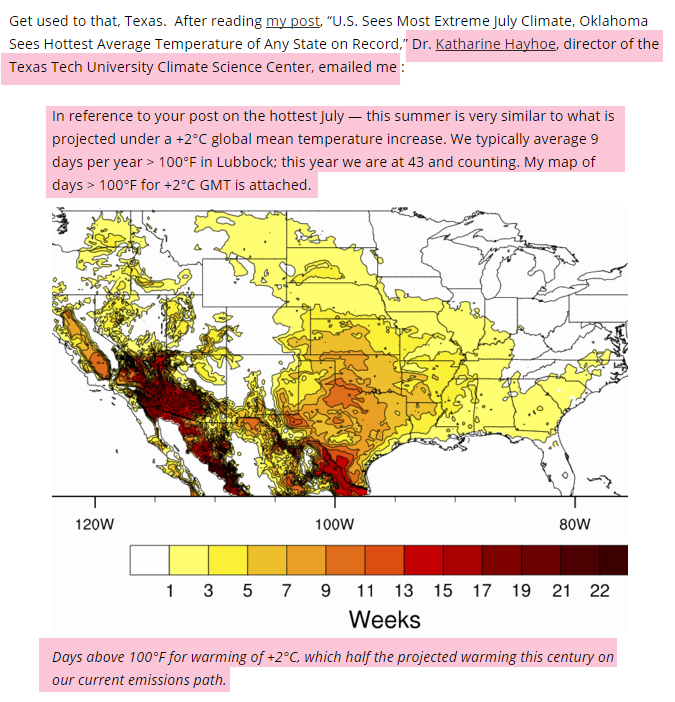
During the hot summer of 2011, Katherine predicted a huge increase in the number of 100 degree days in Lubbock, Texas.

2015-10-26-06-41-42

With No End in Sight for Texas Drought, ABC News Explains: “Every Farmer in the World Will Be Affected by Climate Change” | ThinkProgress

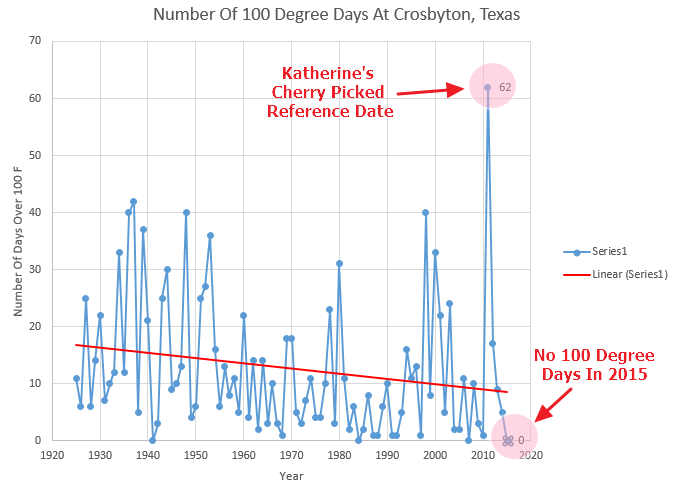
In fact, the exact opposite is happening. The frequency of 100 degree days at Lubbock has dropped in half over the past ninety years. She cherry picked a single outlier year in 2011 to use as her reference point. Since then, the number of 100 degree days has plummeted, and this year was one of only four over the past 110 years, which didn’t have any 100 degree days.

2015-10-26-06-38-26

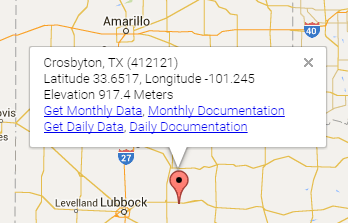
Crosbyton is the closest USHCN station to Lubbock.

2015-10-26-06-56-30

You can download the Crosbyton daily temperature data here.

http://cdiac.ornl.gov/sasserv/CrosbytonTX412121_3214.csv

If that doesn’t work, here is a copy I downloaded this morning.

CrosbytonTX412121_3214

This sort of anti-science malfeasance is standard operating procedure for Katherine Hayhoe. She ignores actual thermometer data, and makes claims based on meaningless output of broken climate models, with no qualifiers or explanation that the models are at odds with the measured data.

Posted in Uncategorized | 7 Comments