Barack Obama is focused on choking off the US energy supply, while lying about fake agreements with Asian countries. Asian coal usage is projected to triple by 2040.
Australia’s coal exports set to rise as south-east Asia demand surges | afr.com
Barack Obama is focused on choking off the US energy supply, while lying about fake agreements with Asian countries. Asian coal usage is projected to triple by 2040.
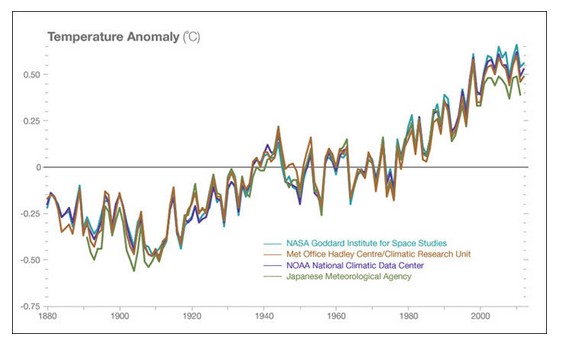
NASA uses this graph to “prove” that global warming is real. It shows the close agreement between NASA, NOAA, CRU and the Japan Space Agency.
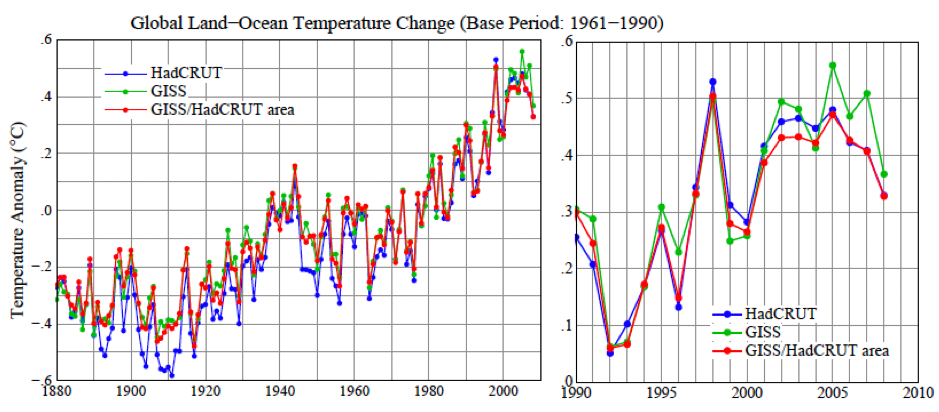
But six years ago, James Hansen was upset that they didn’t agree, and that there was no warming after the hottest year of 1998. Trenberth was also upset about the lack of warming. He called it a travesty.
If It’s That Warm, How Come It’s So Damned Cold?
by James Hansen, Reto Ruedy, Makiko Sato, and Ken Lo
Figure 4. Global surface temperature anomalies relative to 1961?1990 base period
So what did these government criminals do? They all changed their data in unison, and simultaneously made the post 1998 hiatus disappear.
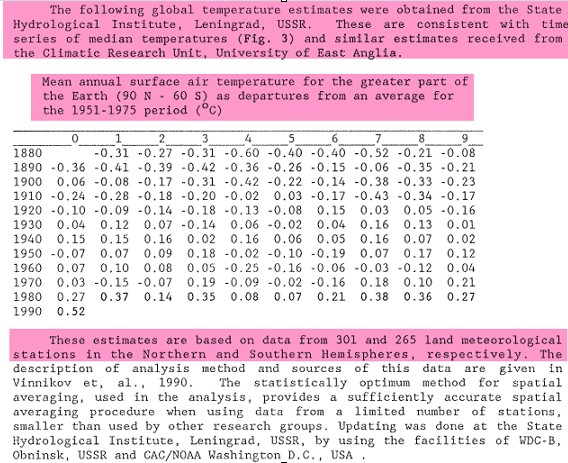
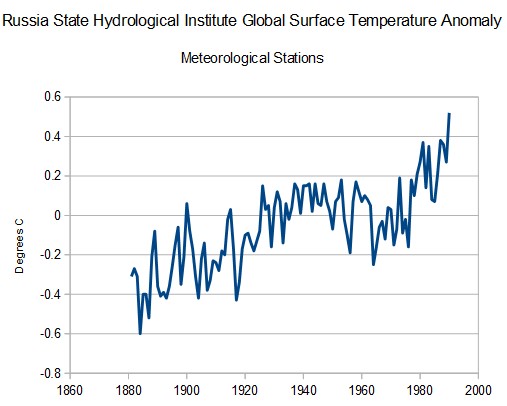
In 1990, NOAA published these global temperature numbers from the Russia State Hydrological Institute, and said they were consistent with CRU.
The numbers showed about 0.6°C warming from 1880 to 1980, and 0.2°C cooling from 1940 to 1970.
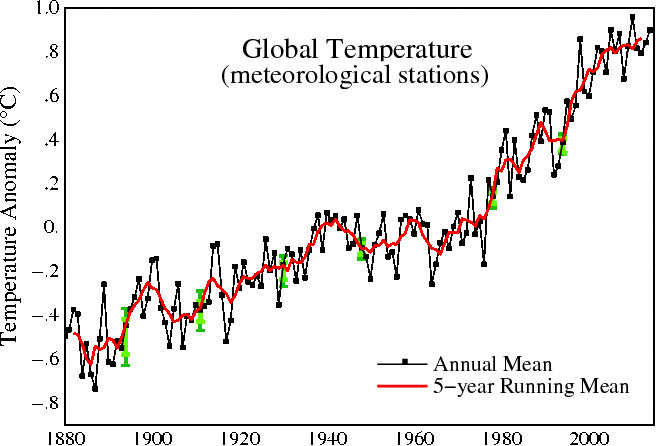
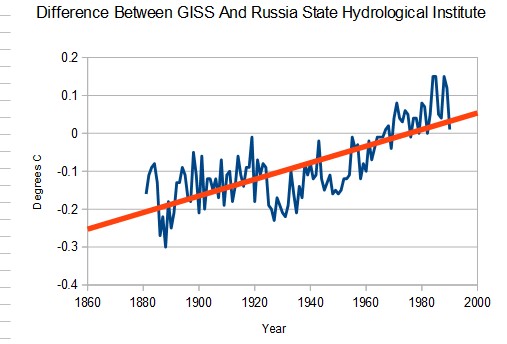
NASA now shows about 0.9°C warning from 1880 to 1980, and no cooling after 1940.
The graph below shows the difference between the NASA data and the Russian data.
These government agencies are blatantly colluding and data tampering in unison, and then claiming to be independent after they do their dirty deeds.
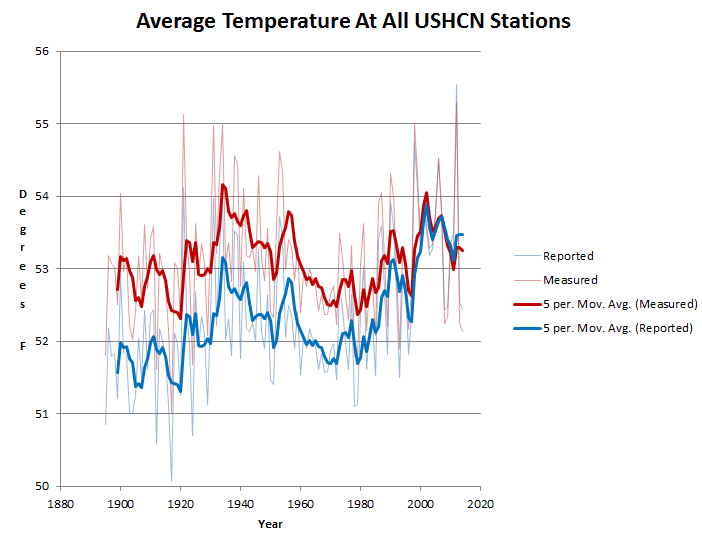
NOAA reports almost two degrees warming in the US, almost all of which is fake, and is derived from fake data. The red line below is the average of all of the measured station data, and the blue line is the average of all of reported station data. The US government has created a completely fake US warming trend, which the thermometers did not measure.
Reported: ushcn.tavg.latest.FLs.52j.tar.gz
Measured: ushcn.tavg.latest.raw.tar.gz
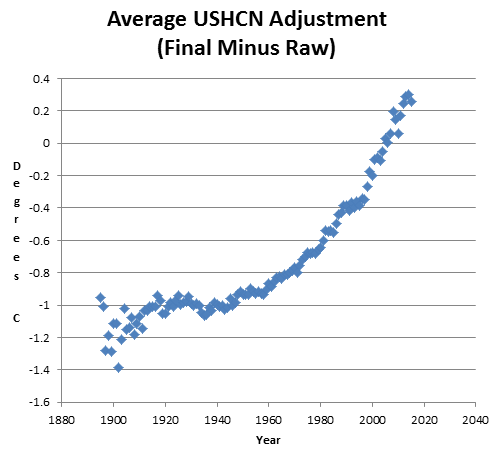
The graph below shows the spectacular hockey stick of data tampering NOAA is doing to the US data set.
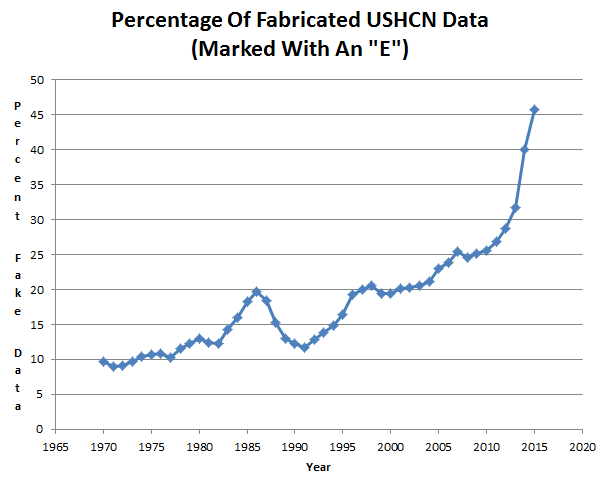
The primary mechanism they use for this data tampering, is to simply fabricate data. Fake data is marked with an ‘E’ like this data for Baudette, MN. It means they have no underlying data for that station during that month.
Almost half of their reported data is now fake.
In 1989, NOAA reported that there had been no warming in the US.
U.S. Data Since 1895 Fail To Show Warming Trend
By PHILIP SHABECOFF, Special to the New York Times Published: January 26, 1989
After examining climate data extending back nearly 100 years, a team of Government scientists has concluded that there has been no significant change in average temperatures or rainfall in the United States over that entire period.
The study, made by scientists for the National Oceanic and Atmospheric Administration was published in the current issue of Geophysical Research Letters. It is based on temperature and precipitation readings taken at weather stations around the country from 1895 to 1987.
U.S. Data Since 1895 Fail To Show Warming Trend – New York Times
In 1999, NASA’s James Hansen reported that much of the US was cooling.
in the U.S. there has been little temperature change in the past 50 years, the time of rapidly increasing greenhouse gases — in fact, there was a slight cooling throughout much of the country
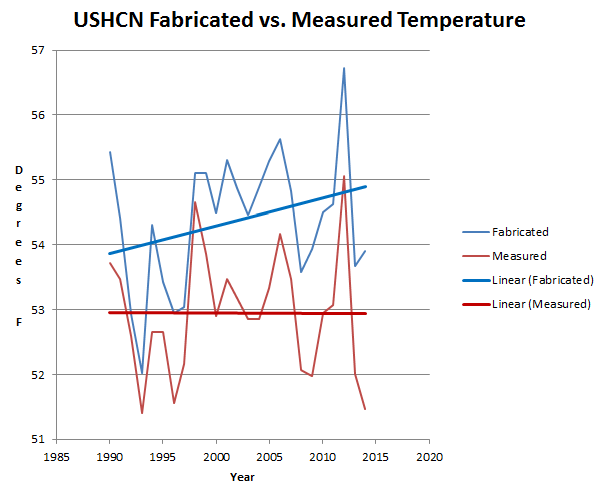
But the fraud is vastly worse than it seems. Since NOAA reported no US warming in 1989, thermometers have continued to show no US warming. One hundred percent of US 1990-2014 warming is due to fake data.
This is the biggest fraud in history, and more than 97% of climate scientists base their work on completely fraudulent data from NOAA and NASA. The “consensus” is based on sham data.
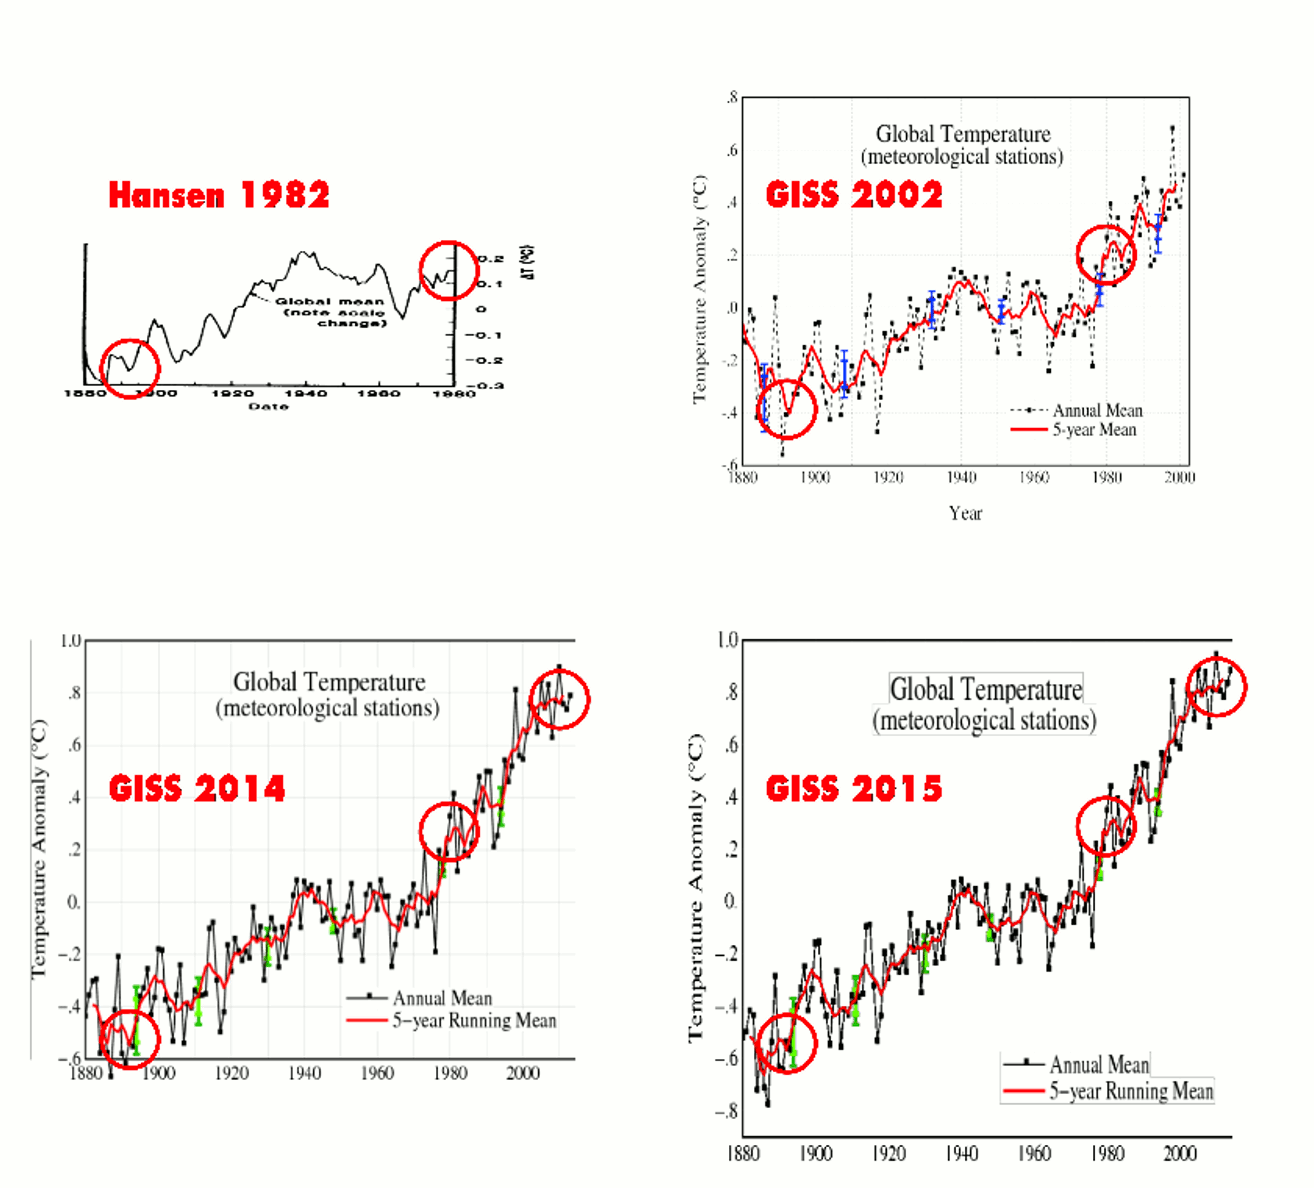
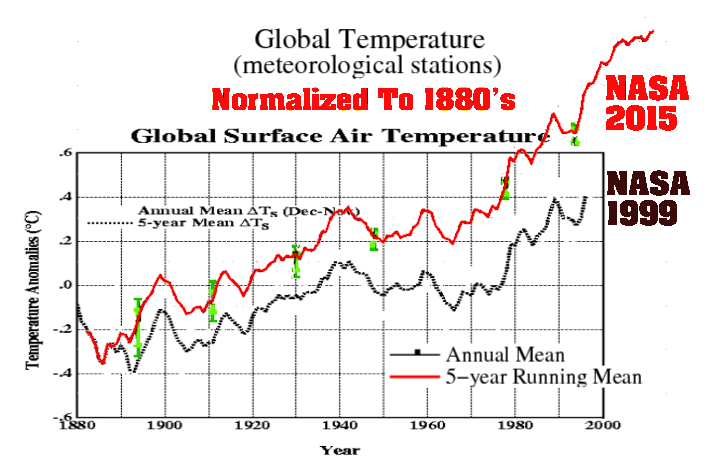
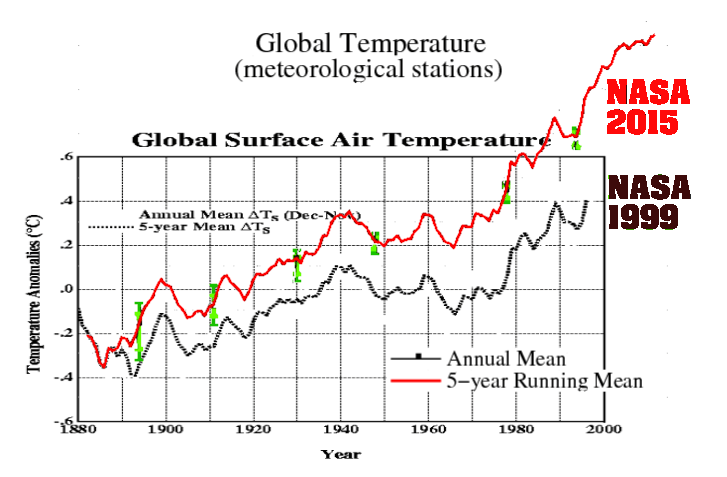
Yesterday I showed how NASA has doubled their own reported global warming since 1999
1999 Figure 1: Global annual-mean surface air temperature change based on the meteorological station network.
2015 Version: traditional analysis using only meteorological station data
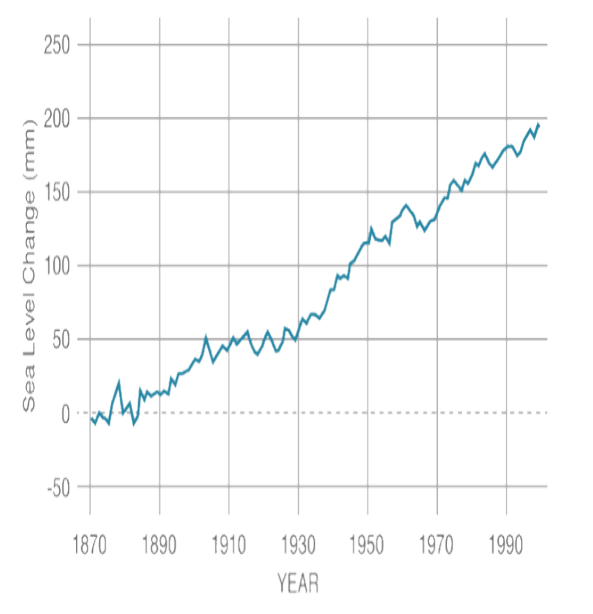
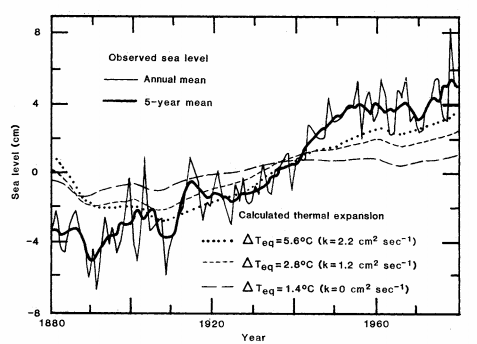
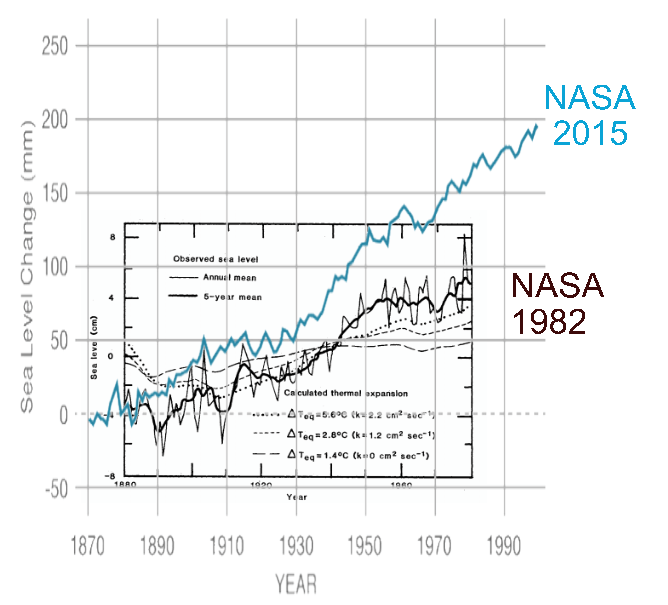
That is pretty spectacular fraud, and they have done exactly the same thing with their sea level data since 1982. NASA currently shows 16 cm of sea level rise from 1880 to 1980, and no change in rates over time
But in 1982, NASA only showed 8 cm of sea level rise from 1880 to 1980, and a sharp flattening to almost zero after 1950.
The next graph is an overlay of the two above, normalized to 1880.
NASA’s current graph looks nothing like their 1982 graph, doubling sea level rise. Exactly the same thing they have done with temperature rise.
We are having 70 MPH wind gusts and the electricity is out. Greens must be thrilled to be living like cavemen without the necessary survival skill set.
I had completely forgotten what the Milky Way looks like.
In 1999, NASA reported 0.6C warming from 1882 to 1996. Now they report almost twice that much warming from 1882 to 1996. Note that the alterations have been far outside of the green error bars, indicating incompetence, fraud, or both.
1999 Figure 1: Global annual-mean surface air temperature change based on the meteorological station network.
2015 Version: traditional analysis using only meteorological station data
The next graph shows the same thing, normalized to 1880’s temperatures.
This is the biggest fraud in science history, and needs to be investigated by Congress immediately.
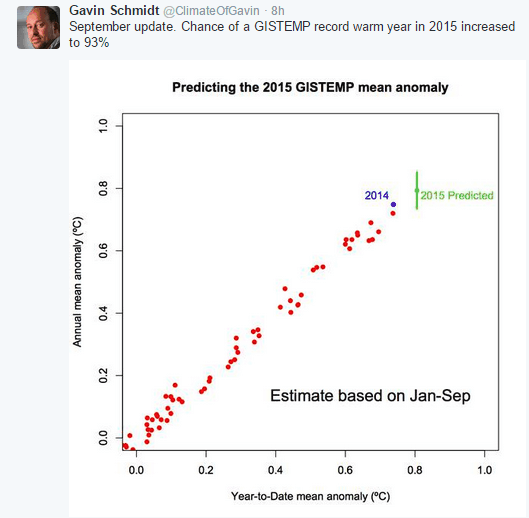
Gavin just bumped recent global temperatures up so much that he had to add a new Y-axis grid line at 0.8°C.
Shortly after doing this, he announced that the odds of a record warm year had increased.
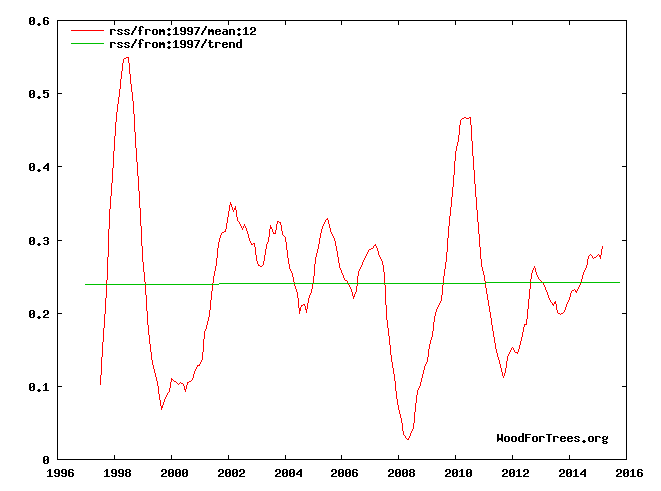
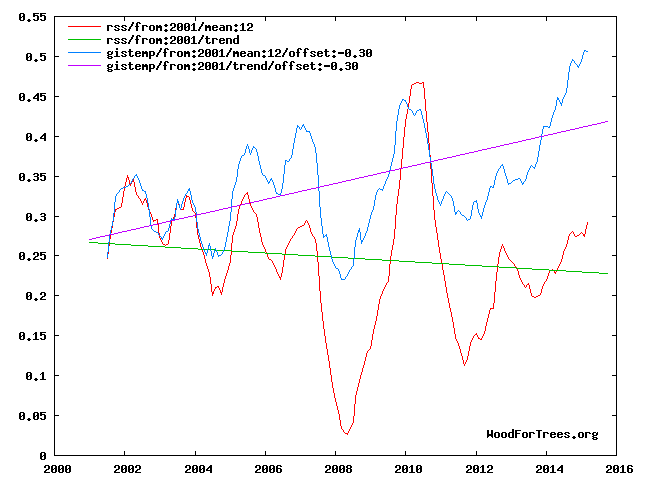
No mention from Gavin of course that satellite data shows a 0% probability of 2015 being a record warm year.
If Gavin was an actual scientist, he would mention that his data is diverging from satellite data at a rate of 1.27°C per century since the beginning of this century.
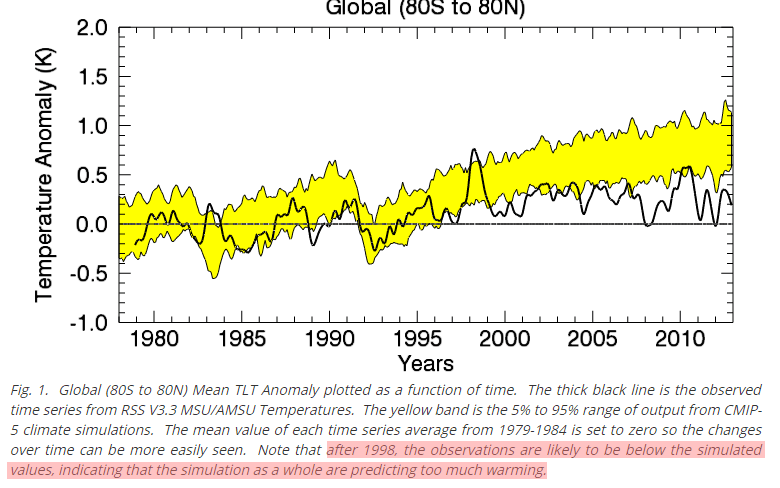
If Gavin was an actual scientist, he might also mention that warming has been much slower than forecast by climate models.