
Government climate scientists keep saying that they need larger supercomputers to improve their accuracy.
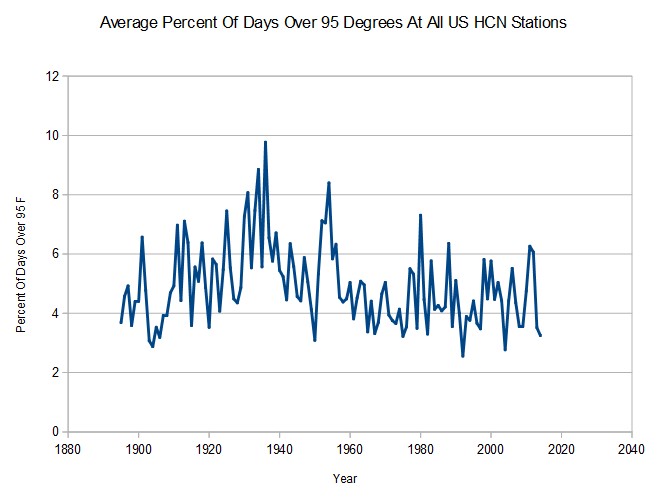
I just tested their claim by processing the entire 135 year long US HCN daily temperature record on my $180 laptop with 2GB memory, in nine minutes and ten seconds – while I was simultaneously tweeting, blogging and generating spreadsheet graphs.
And my temperature graph is far more accurate than any of the fraudulent graphs they make on their billion dollar computers. The US is much cooler now than it was 80 years ago. Somehow our “top scientists” missed this.
BTW – this was done on Windows 10. I doubt it would have been possible to do this on Windows 8 or earlier versions, because the memory management wasn’t adequate.

Reminds me of the story about Little Red Riding Hood and the Wolf: “”But Grandmother! What BIG teeth you have,” said Little Red Riding Hood her voice quivering slightly.
http://www.dltk-teach.com/rhymes/littlered/8.htm
“Government climate scientists keep saying that they need larger supercomputers to improve their accuracy.”
Larger computers are no more accurate than small ones, although they should be faster.
I don’t know what processing you were doing which took 9 minutes and ten seconds, but if you could have done it using machine code rather than in Windows 10, it would have taken even less processing time.
When I owned a TRS-80 computer, and could program the Z-80 in machine code, I could do things in seconds, which took many minutes in the basic language.
Climate models are very complex but I am not convinced that the scientists are making best use of the processing power of the machines they are using by writing efficient code.
You have no idea what you are talking about. The code is written in C++ and is being run on a tiny Atom processor with less than 500 MB free RAM.
“You have no idea what you are talking about.”
At risk of being pedantic, each person is the only person that knows what he is talking about. It would be more correct to say “you are wrong!” since he isn’t just comparing apples to oranges, but Windows 10 to machine language. One is an operating system the other is a method of coding a program.
So clearly he does have an idea what he is talking about. I cannot be impressed or dismissive since you don’t say, in your story, what are the parameters: data file size, number of rows of data, nature of that data, how challenging it is to parse the data, what exactly you are computing, what language you used (interpreted vs compiled). C++ uses quite a lot of late-binding and that means at least one additional pointer resolution for every function call whereas a typical C program is static bound to its libraries. How much of a difference that actually makes depends on whether you make a large number of function calls inside a loop. If you do, then C is more efficient; maybe more efficient than assembly language (the C optimizer can do things you might not think about when writing your assembly language).
Agreed, the use of high level code for programming is really slowing things down. However, if a simple model explains things adequately then most of these people will be out of jobs. I learned when fighting the evil empire(Soviet Union) that when you actually solve a problem you are out of work.
. . . when I was fighting the old evil empire before its boarders expanded to enclose the globe
I thought C++ was a low level programming language, Assembly would process faster but it would take longer to build, C++ or Pascal is a decent balance… Still.. how did an $180 laptop with 2GB memory out perform government supercomputers in accuracy? lol
Sparks writes “Still.. how did an $180 laptop with 2GB memory out perform government supercomputers in accuracy?”
That’s trivial. You simply compute with more digits. It takes longer of course. Scientific calculations are almost always computed using floating point, probably 64 bit “doubles”. make it more than 64 bit and presto, more accuracy.
http://www.multiprecision.org/index.php?prog=mpc
http://www.mpfr.org/
QV,
Governmental climatologists need a bigger supercomputer because they are processing complex data types called in computer science “off-beam datasets”. Second, they don’t use old-fashioned ”batch” processes but a more advanced, sophisticated but CPU intensive “iterative chain botch” methodology. Harry wrote an unpublished but very useful and detailed white paper on the subject:
For further understanding you should look up these claims:
Such criticism of massive supercomputing shows a profound misunderstanding of this scientific field. The governmental climate programs have a fundamental advantage because their results have been proven and certified as 100% irreproducible. They are therefore very robust and final. They provide an essential scientific certainty and a solid foundation on which we can conduct further science and build a better world.
On the other hand, the results obtained from Goddard’s cheap laptop are reproducible and could be falsified so nothing ever gets settled.
I hope I was able to clear it up.
Processing speed is secondary to the relevance of the data being issued in my book and which, in this case, Could it be that moving that super-hot day marker to one more representative of a nice-warm one of over 80deg. say might not tell a different tale?
david, it is a fair question and I would like to see the answer. However is not controversial that that the US has cooled as NASA used to admit as much. Also realize that the claim is “extreme” weather events. Right now the Calif drought is the only thing that perhaps can be called “extreme”, and reservoir levels are slightly above where they were in the last major drought in the 1970s, and well be low mega droughts of the past 1000 years.
Overall the southeastern US has clearly cooled…
https://stevengoddard.wordpress.com/2015/10/15/temperatures-in-the-southeastern-us-plummeting/
“BTW – this was done on Windows 10. I doubt it would have been possible to do this on Windows 8 or earlier versions, because the memory management wasn’t adequate.”
I’m still using XP Pro but will get a new computer with Windows 10 this winter. Thinking of going top of the line Dell. Maybe a M6800? But could go with something a little less capable.
Use Mozilla Firefox with Windows 10. The web browser that comes with 10 is terrible.
Got to agree on the default WIndows 10 browser (I think it’s Edge?). It pretty much sucks.
I still use my legacy IE or Google Chrome.
“Maybe a M6800?”
Chuckle out loud. Aim low — Intel 4004.
Condescend much?
“Condescend much?”
Yes. It means “descend together”. Down we go!
On the subject of historical temperature data, there is interesting archive of climate data in the journal “Monthly Weather Review” which is available online:
http://journals.ametsoc.org/loi/mwre
If you examine some of the issues before 1900, you’ll see that there are, for selected US cities, ** hourly** temperature averages (presumably temperatures at a specific time of day). Therefore TOBs is not a factor (one of the main reasons that the NOAA corrects early 20th century temperature anomalies down). It would be interesting to compare this data with the corrected NOAA for different parts of the country.
In 1918 there was 20 years of continuous data.
Meteorology: A Text-book on the Weather, the Causes of Its Changes, and Weather Forecasting By Willis Isbister Milham (1918) states there are 180 to 200 ‘regular weather stations ordinarily in the larger cities, 3600 to 4000 coop stations and 300 to 500 special stations.
Meteorology: A Text-book on the Weather, the Causes of Its Changes, and Weather Forecasting By Willis Isbister Milham (1918)
The observations of temperature taken at a regular station are the real air temperature at 8am and 8pm, the highest and lowest temperatures of the preceding 12 hours, and a continuous thermograph record…. [Richard Freres thermograph] ….these instruments are located in a thermometer shelter which is ordinarily placed 6 to 10 feet above the roof of some high building in the city. At a Cooperative station the highest and lowest temperatures during a day are determined, and also the reading of the maximum thermometer just after it has been set. The purpose of taking this observation is to make sure that the maximum thermometer has been set and also to give the real air temperature at the time of observation.
Continue reading page 77 on.
If a good continuous thermograph record for at least twenty years is available, the normal hourly temperatures for the various days of the year can be computed….
“the average temperature for a day is found by averaging the 24 values of hourly temperature observed during that day”
If the normals are based on twenty years of observations, it will be found that there is not an even transition from day to day, but jumps of even two or three degrees occur….
Continue reading page 77 on.
I thought it quite interesting that Willis Isbister Milham was talking about 20 years of hourly data in 1918.
On page 68 he says a thermometer in a Stevenson screen is correct to within a half degree. It is most in error on still days, hot or cold. “In both cases the indications of the sheltered thermometers are too conservative.”
on Page 70
“The Ventilated thermometer which is the best instrument for determining the real air temperature, was invented by Assman at Berlin in 1887…will determine the real air temperature correctly to a tenth of a degree.”
The data at the beginning of the 19th century is better than the ClimAstrologists want us to know.