Some of NASA’s more impressive data tampering is in Alice Springs, where they have knocked a full 2C off of older temperatures
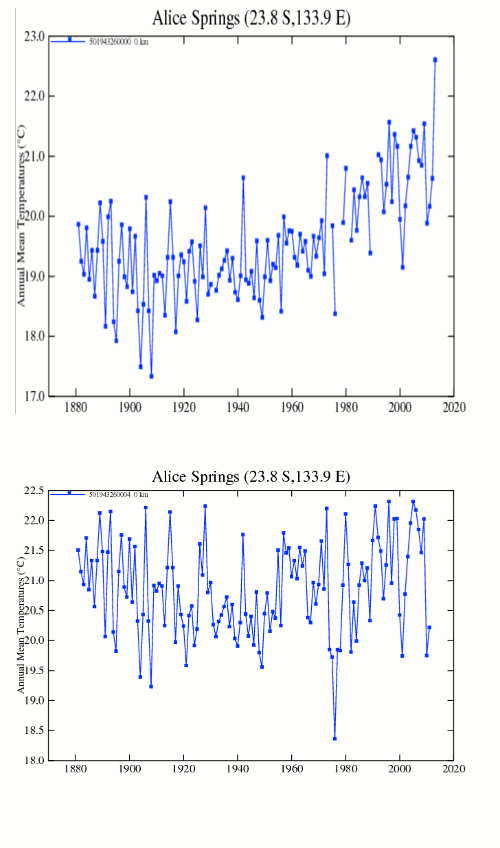
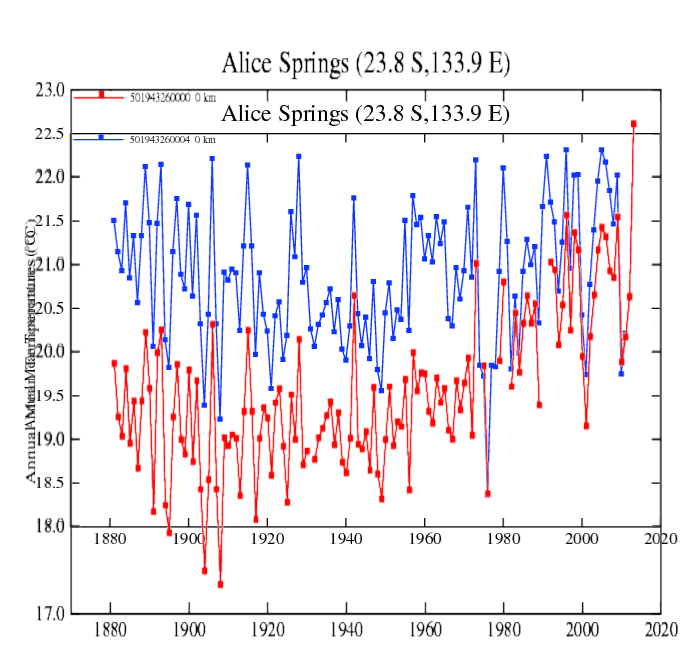
Some of NASA’s more impressive data tampering is in Alice Springs, where they have knocked a full 2C off of older temperatures
BERKELEY, Calif., June 4, 2012 – Solar cells do not offset greenhouse gases or curb fossil fuel use in the United States according to a new environmental book, Green Illusions (June 2012, University of Nebraska Press), written by University of California – Berkeley visiting scholar Ozzie Zehner. ”
Green Illusions explains how the solar industry has grown to become one of the leading emitters of hexafluoroethane (C2F6), nitrogen trifluoride (NF3), and sulfur hexafluoride (SF6). These three potent greenhouse gases, used by solar cell fabricators, make carbon dioxide (CO2) seem harmless. Hexafluoroethane has a global warming potential that is 12,000 times higher than CO2, according to the Intergovernmental Panel on Climate Change (IPCC). It is 100 percent manufactured by humans, and survives 10,000 years once released into the atmosphere. Nitrogen trifluoride is 17,000 times more virulent than CO2, and SF6, the most treacherous greenhouse gas, is over 23,000 times more threatening.
The solar photovoltaic industry is one of the fastest-growing emitters of these gases, which are now measurably accumulating within the earth’s atmosphere according to the U.S. National Oceanic and Atmospheric Administration (NOAA). A NOAA study shows that atmospheric concentrations of SF6 have been rising exponentially. A paper published in the peer-reviewed journal Geophysical Research Letters documents that atmospheric NF3 levels have been rising 11 percent per year.
h/t to Dave G
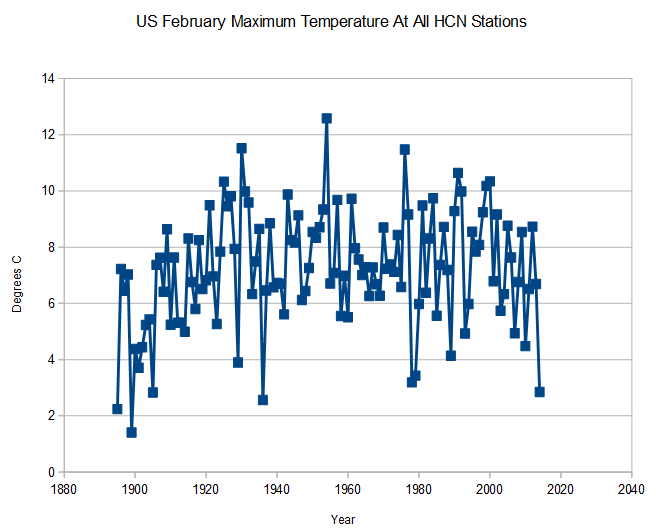
There is a pattern to the weather, but it has nothing to do with a hockey stick. US February maximum temperatures are plummeting, and are the coldest since 1936.
It is maddening to have my tax dollars go to scumbags at NOAA and NASA, so they can be paid to lie to us.
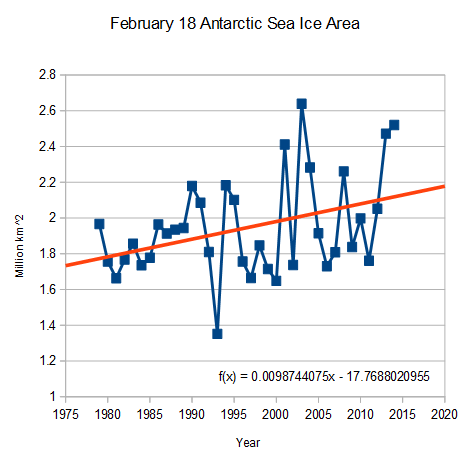
Antarctica is at its summer sea ice minimum now, and ice area is up 15% since 1979.
arctic.atmos.uiuc.edu/cryosphere/timeseries.south.anom.1979-2008
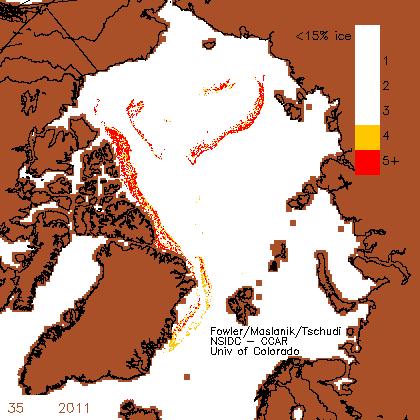
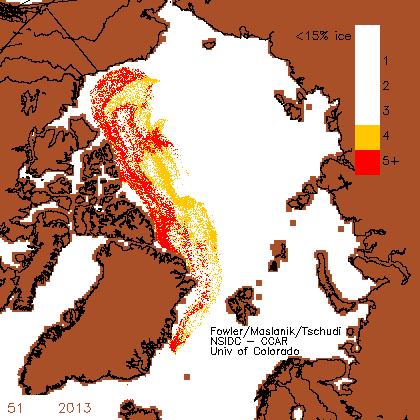
NSIDC graphics showing 4/5 year old ice in week 35, 2011 and week 51, 2013.
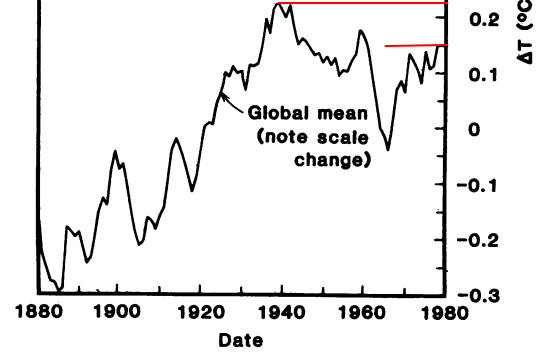
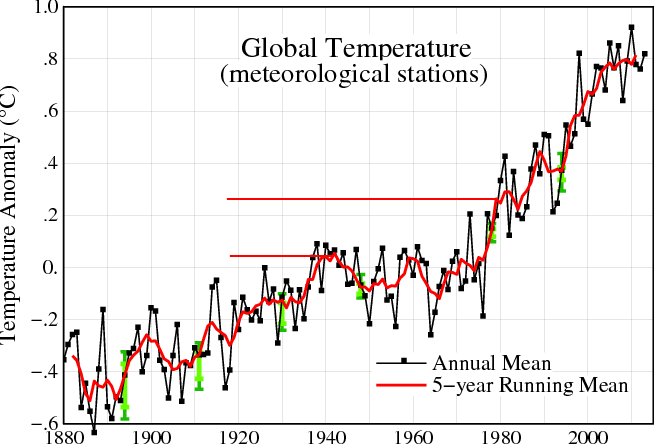
Hansen wrote this in 1981
A remarkable conclusion from Fig. 3 is that the global temperature is almost as high today as it was in 1940.
At the time, he showed 1980 temperatures about 0.15C cooler than 1940.
Now, NASA shows 1980 temperatures about 0.2C warmer than 1940. They made a relative shift of 0.35C, far exceeding Wigley’s hoped for 0.15C
During the early 1980’s I was working on the Safety Analysis Report for the DOE’s Waste Isolation Pilot Plant (WIPP) in southeastern New Mexico. One day my bosses’ boss (a charming gentleman from India) came by and said :
You guys are doing a great job. A really great job. Just make sure you don’t find anything which hurts the project
I quit that job about 15 minutes later. Fast forward to today :
CARLSBAD, N.M. (AP) — The U.S. Department of Energy has appointed a team to investigate the detection of radiation in and near a southeastern New Mexico facility that’s the nation’s only underground nuclear waste repository in operation. The assessment of the Waste Isolation Pilot Plant will be conducted by an accident investigation board consisting of department officials and representatives of health and safety agencies, the department said in a statement released late Wednesday.
Team to probe event at New Mexico nuclear site – DC News FOX 5 DC WTTG
NASA has corrupted the temperature record across the entire planet, in order to create the appearance of warming. The graph below shows US temperatures – Hansen 1999 in blue, and GISS in red. The graphs are normalized to the 1997 five year mean lines.
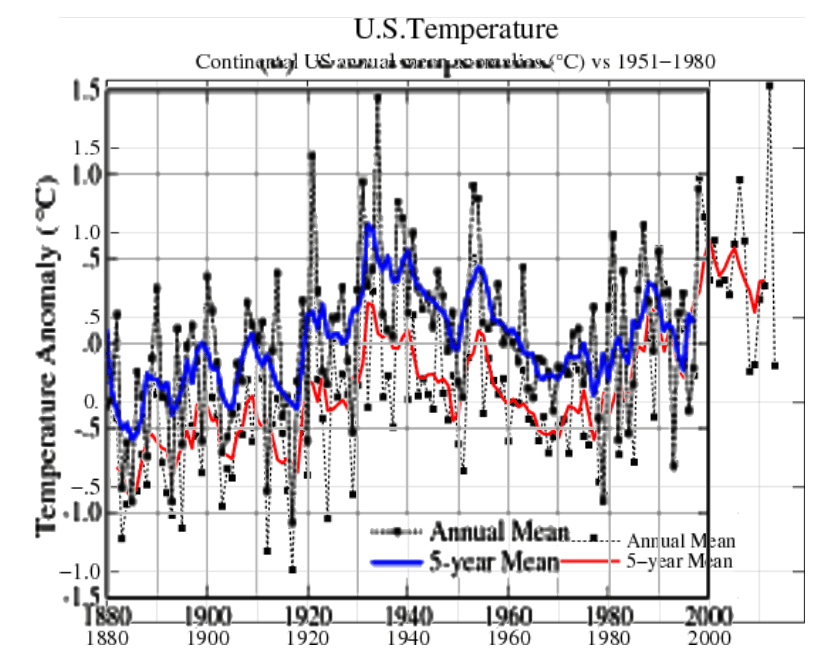
NASA GISS: Science Briefs: Whither U.S. Climate?
Data.GISS: GISS Surface Temperature Analysis: Analysis Graphs and Plots
The next four graphs show how GISS has cooled the past globally, and at all three latitude bands since Hansen 1981.
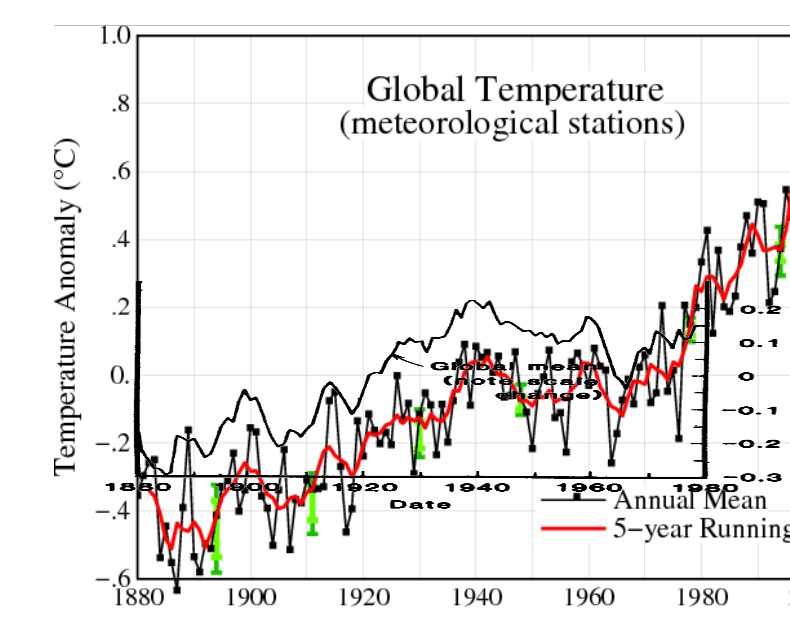
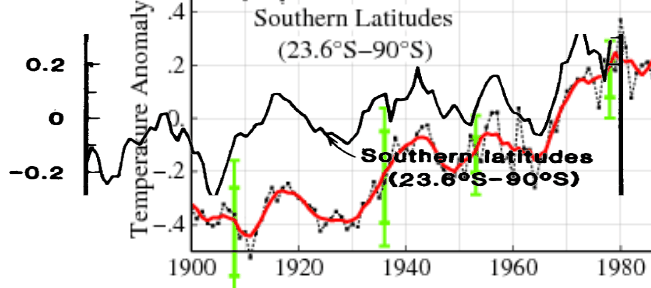
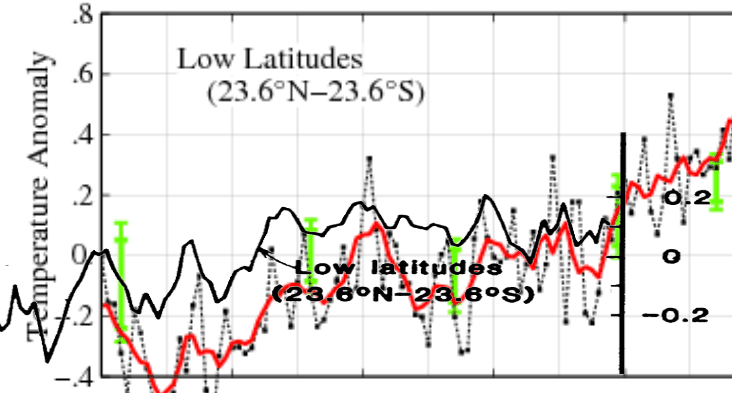
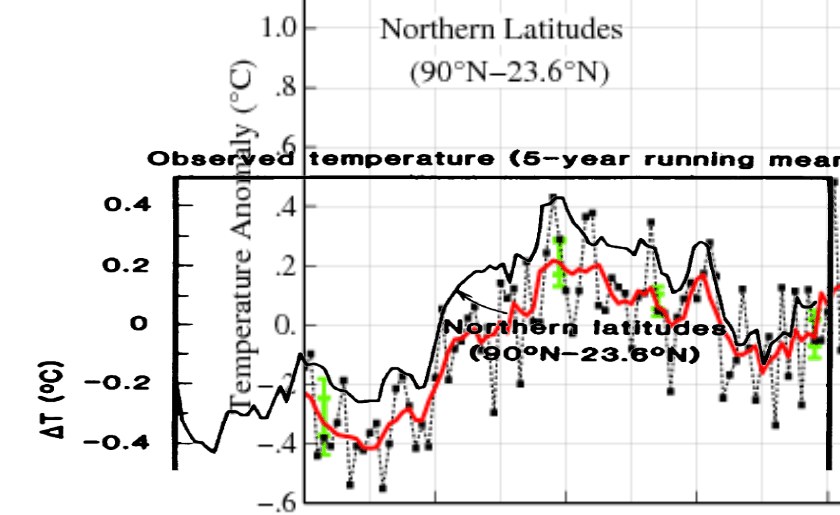
pubs.giss.nasa.gov/docs/1981/1981_Hansen_etal_1.pdf
Similarly, NOAA (red) has cooled the US past since their 1990 report (black)
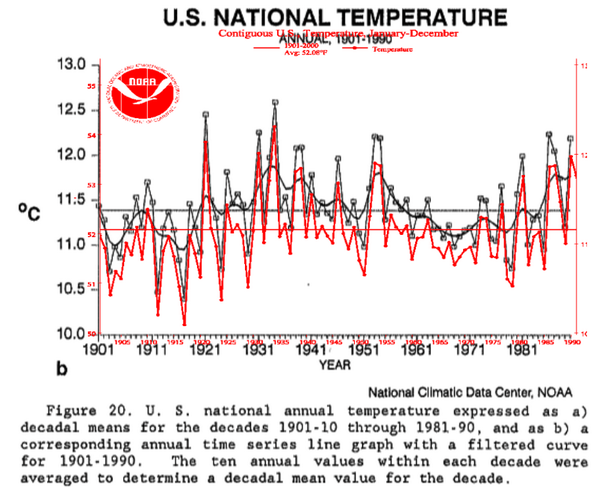
www1.ncdc.noaa.gov/pub/data/cmb/bams-sotc/climate-assessment-1981-1990.pdf
The most damning graph of all though is the one below, showing how NOAA (red) is cooling the past relative to their own thermometer data (blue)
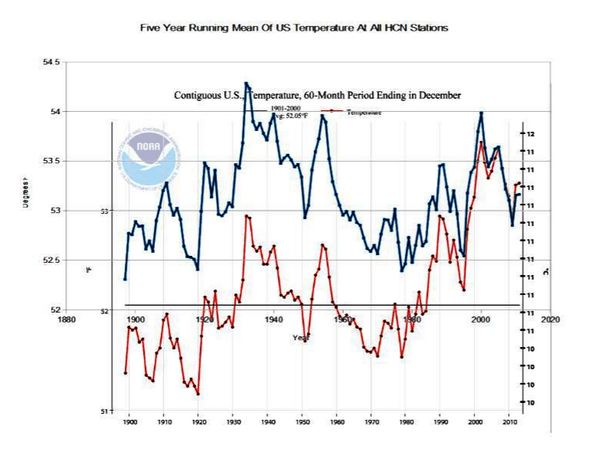
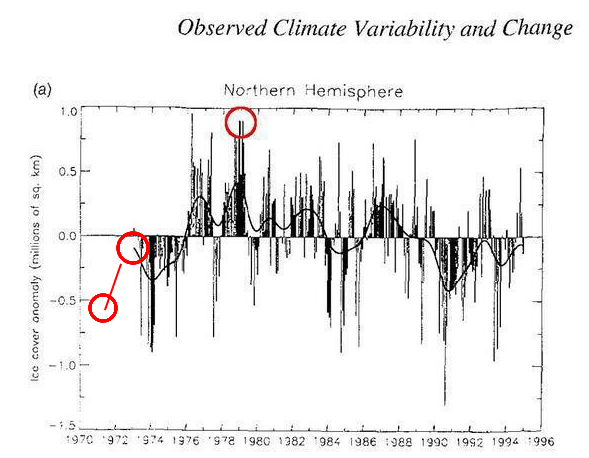
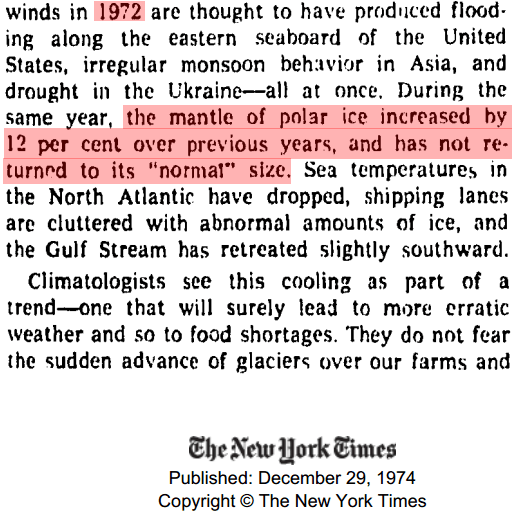
Arctic ice increased 12% in 1972, and did not drop back down to its normal size by late 1974.
Now let’s look at the IPCC SAR Arctic sea ice graph, below. The lowermost circle is an approximation what “normal” ice is, based on the description above. By contrast, climate liars start their graphs in 1979 (uppermost circle) and want people to believe that is normal.