Obama is focused like a laser on jobs, and climate, and golf, and health care, and hijacking Evo Morale’s plane.
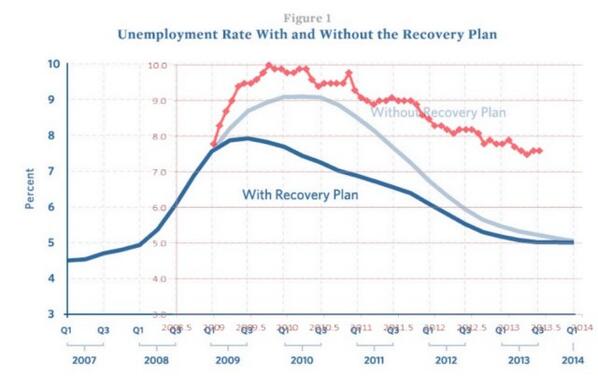
Obama is focused like a laser on jobs, and climate, and golf, and health care, and hijacking Evo Morale’s plane.
I’m going to save the government lots of money by reducing their climate models down to one line of code.
dT = k * dt
Alternatively, in the more sophisticated version
dT = k * dCO2
The enhanced Hansen version is
dT = k * (exp(dCO2)²)³
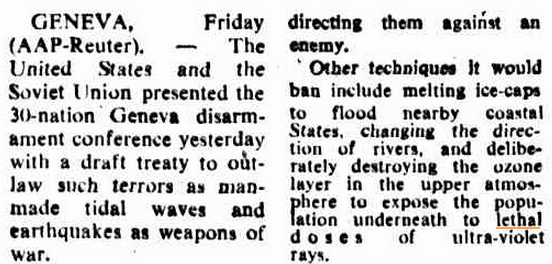
Fred Flintstone’s SUV was a climate killer
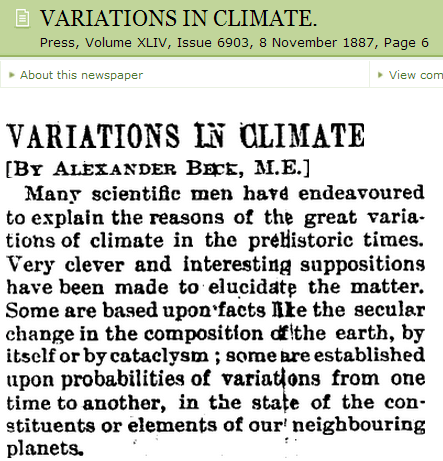
Papers Past — Press — 8 November 1887 — VARIATIONS IN CLIMATE.
“Carbon pollution was going unchecked, which was having severe impacts on our weather,” Obama said
Obama: ‘Unchecked’ Carbon Pollution Before 2009 Had ‘Severe Impacts on Our Weather’ | CNS News
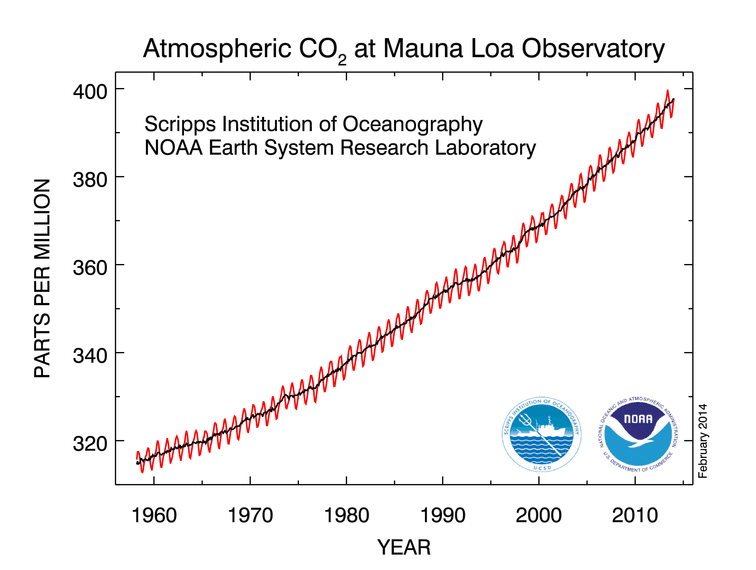
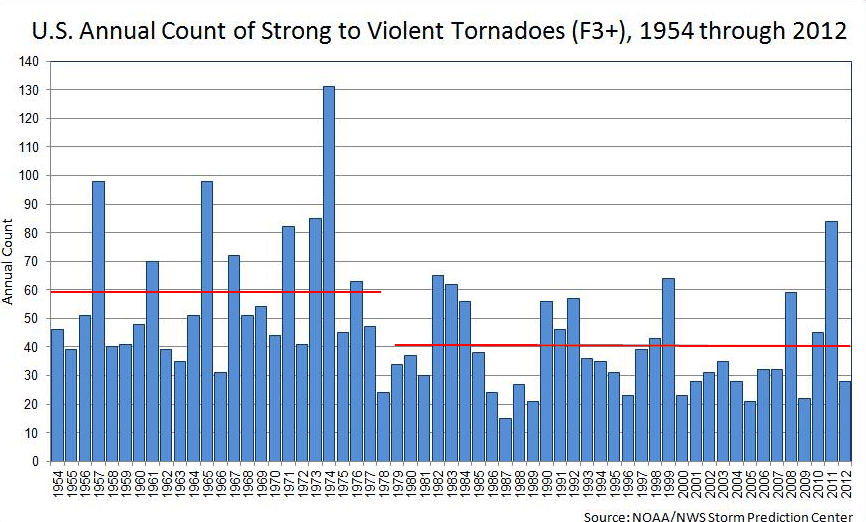
When he wasn’t busy destroying the Constitution and the health care system, Barry was saving the climate by reducing the amount of carbon on Earth. This explains the record low number of tornadoes and hurricanes since 2009. You can see the tremendous progress Obama has made in decarbonizing the planet, in the graph below.
ESRL Global Monitoring Division – Global Greenhouse Gas Reference Network
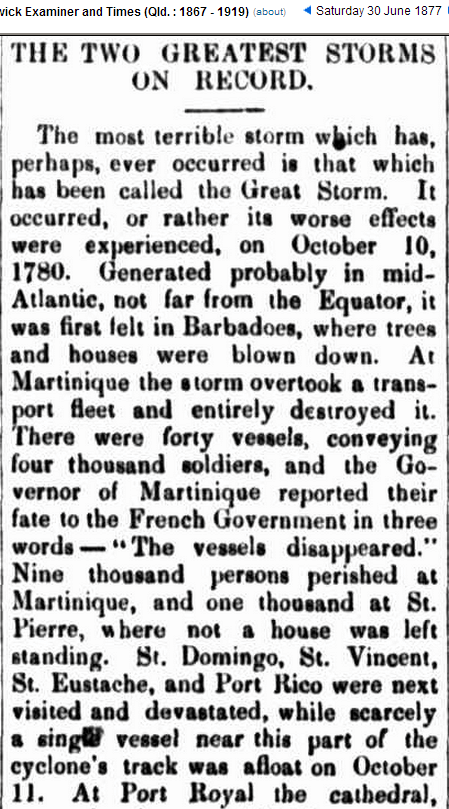
Climate experts say that Mann-made CO2 causes all bad weather, which is why the worst Atlantic hurricane occurred with CO2 at 280 PPM.
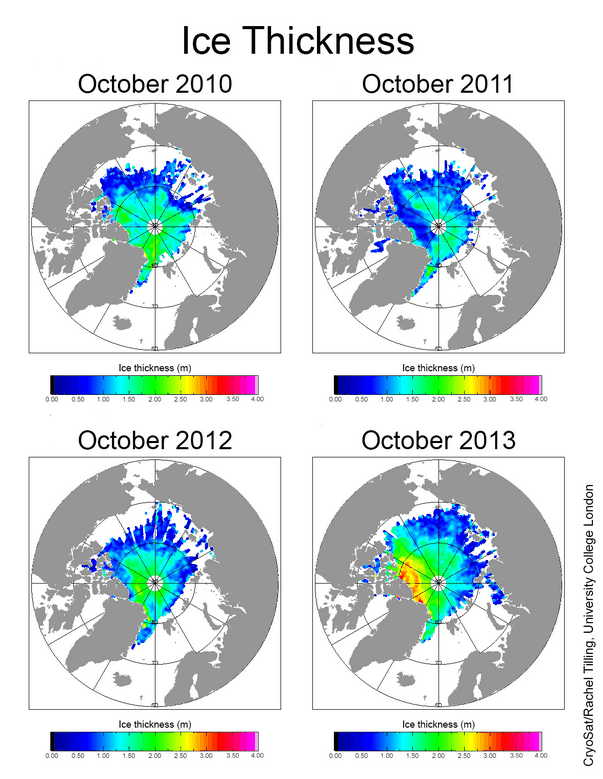
The retention of more sea ice in September 2013 has increased the overall thickness and volume of the ice pack compared to recent years. Antarctic sea ice remains significantly more extensive than average.
Arctic Sea Ice News and Analysis | Sea ice data updated daily with one-day lag
Over the past few years, winter winds have been transporting less ice out of the Arctic than has been forming, so the average age, thickness and volume of ice is increasing. If the recent wind patterns continue, then the amount of ice will continue to increase. It has nothing to do with CO2.
Melting ice is cooking the planet. Shrinking Arctic sea ice means the ocean is absorbing more energy from the sun, and it’s now clear the effect is twice as big as thought – adding significantly to heating from greenhouse gases.
NSIDC just reported a significant increase in Arctic sea ice thickness and volume over the past four years.
Arctic temperatures have risen 2 °C since the 1970s, leading to a 40 per cent dip in the minimum summer ice coverage in the Arctic Ocean. Open water soaks up more sunlight than ice, so as the ice retreats the ocean absorbs more energy, warming it and causing even more melting.
The summer minimum occurs in mid-September, just as the sun sets at the north pole. It has almost no impact on albedo or absorption of sunlight, but open water in September allows heat to escape from the water, cooling the planet.
To measure the effect, Ian Eisenman of the Scripps Institute of Oceanography in La Jolla, California, and colleagues turned to data from NASA’s CERES satellite. They found that the Arctic Ocean’s albedo – the fraction of sunlight it reflects back into space – dropped from 52 per cent in 1979 to 48 per cent in 2011. That may not seem like much, but it means a big rise in energy absorbed – equal to 25 per cent of that trapped by the rise in atmospheric carbon dioxide over the same period.
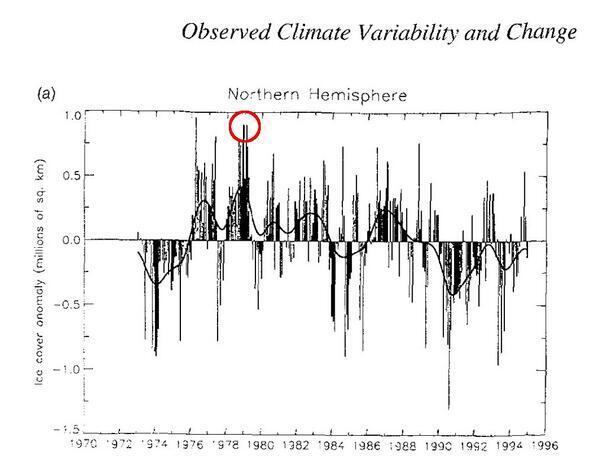
1979 was the peak year for Arctic sea ice. That is why the climate deceivers always use it as a start date. This graph is from the second IPCC report. Had they started their analysis in 1974, there would be nothing scary to report.
In 2009, the world’s top climate scientists were looking for ways to make the 1940’s warming spike disappear.
From: Tom Wigley <[email protected]>
To: Phil Jones <[email protected]>
Subject: 1940s
Date: Sun, 27 Sep 2009 23:25:38 -0600
Cc: Ben Santer <[email protected]>It would be good to remove at least part of the 1940s blip, but we are still left with “why the blip”.
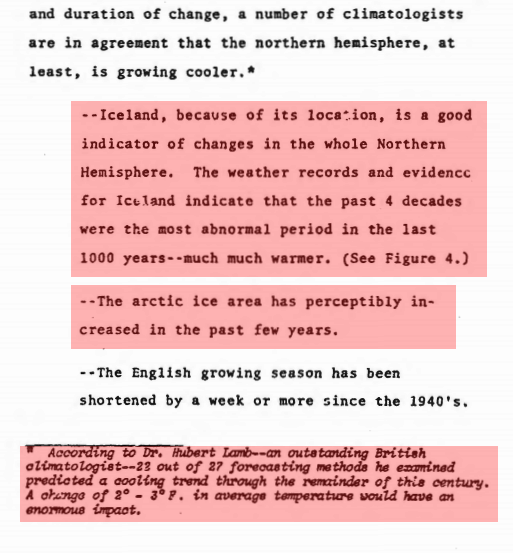
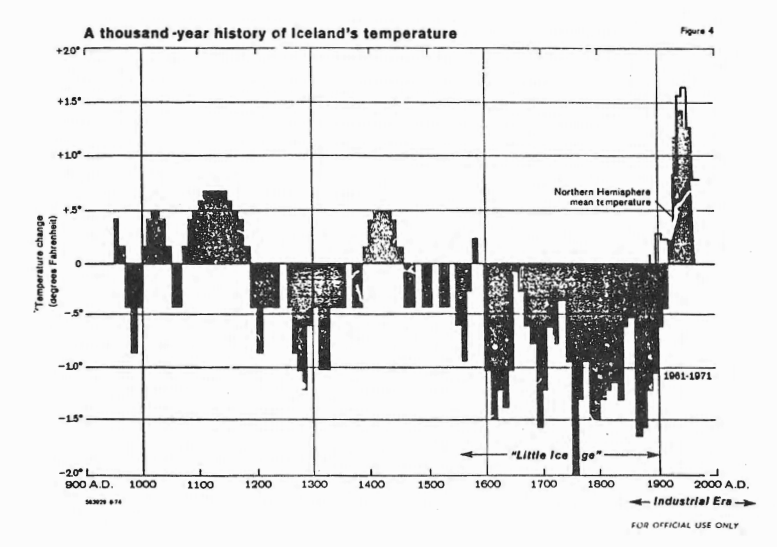
In 1974, the CIA reported that Iceland used to be much warmer.
documents.theblackvault.com/documents/environment/potentialtrends.pdf
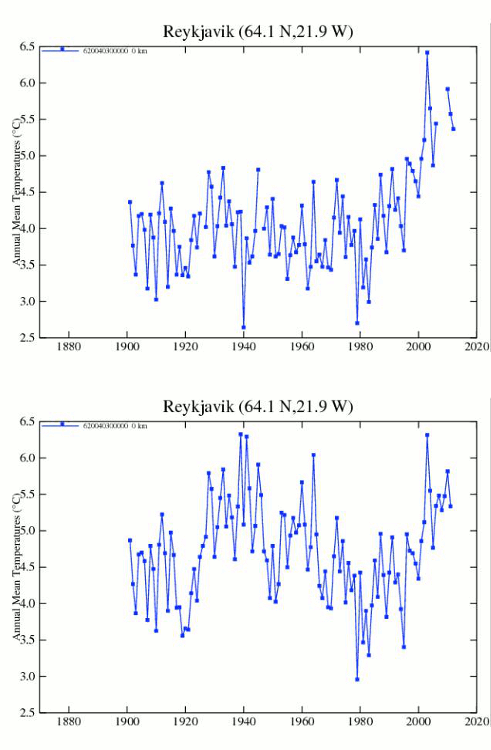
By a fantastic coincidence, the 1940’s spike in Iceland then magically disappeared. The animation below compares 2010 GISS to 2013 GISS.