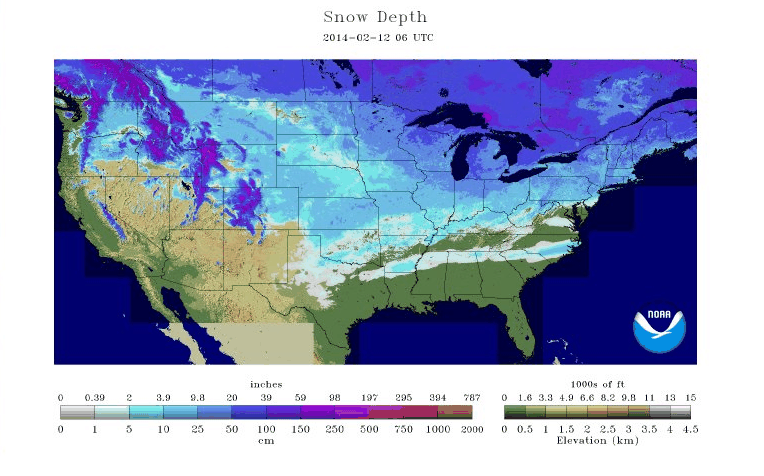
According to USHCN docs, the V2 TOBS adjustment hasn’t changed since V1
This net effect is about the same as that of the TOB adjustments in the HCN version 1 temperature data (Hansen et al. 2001), which is to be expected since the same TOB-adjustment method is used in both versions.
ftp://ftp.ncdc.noaa.gov/pub/data/ushcn/v2/monthly/menne-etal2009.pdf
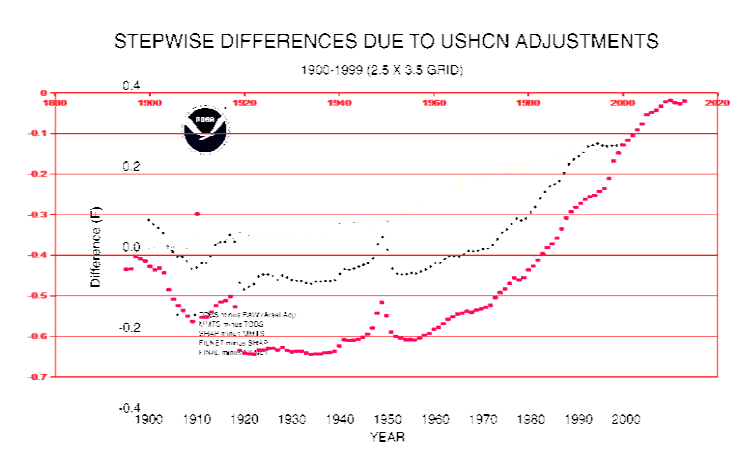
The V1 TOBS adjustment was + 0.3F, and went flat after 1990.
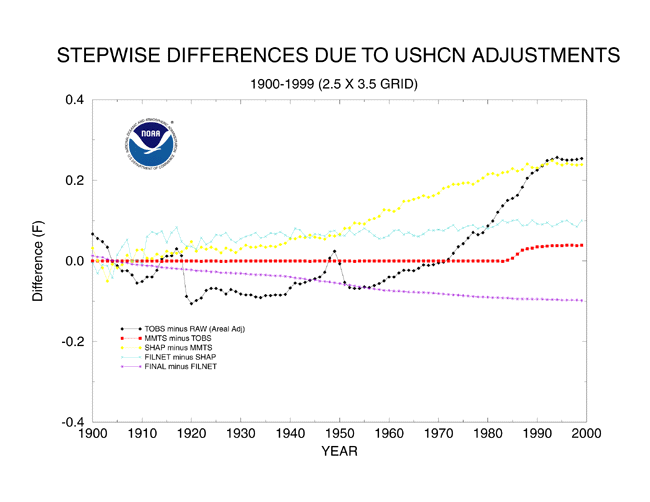
But the V2 adjustment (which is supposed to be the same) is twice as large, and negative.
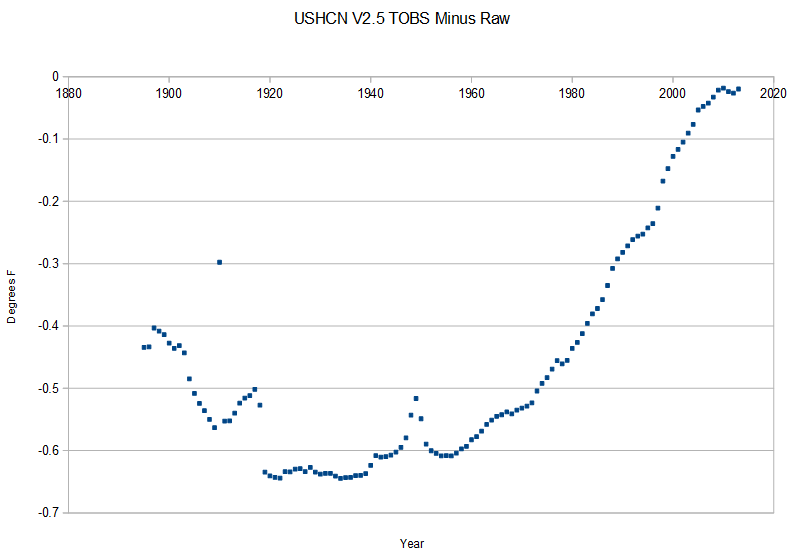
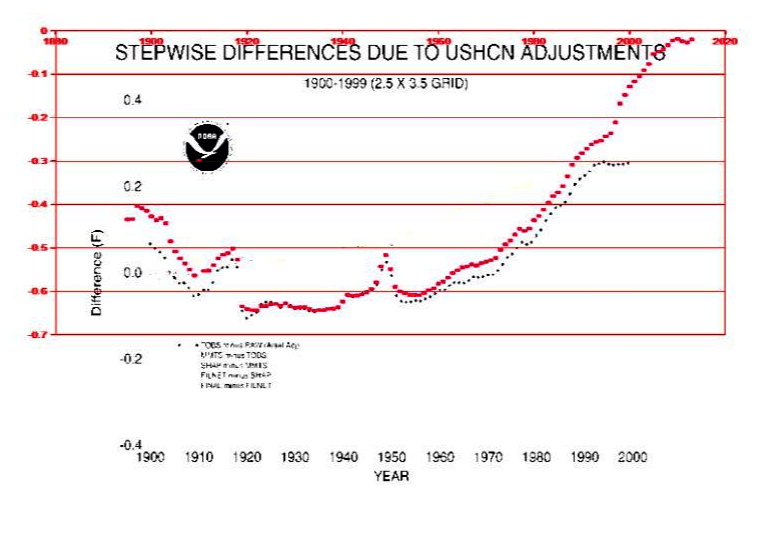
The next graph overlays the V2 adjustments in red, on the V1 adjustments in black. They claim that it is the same algorithm and nearly the same data.
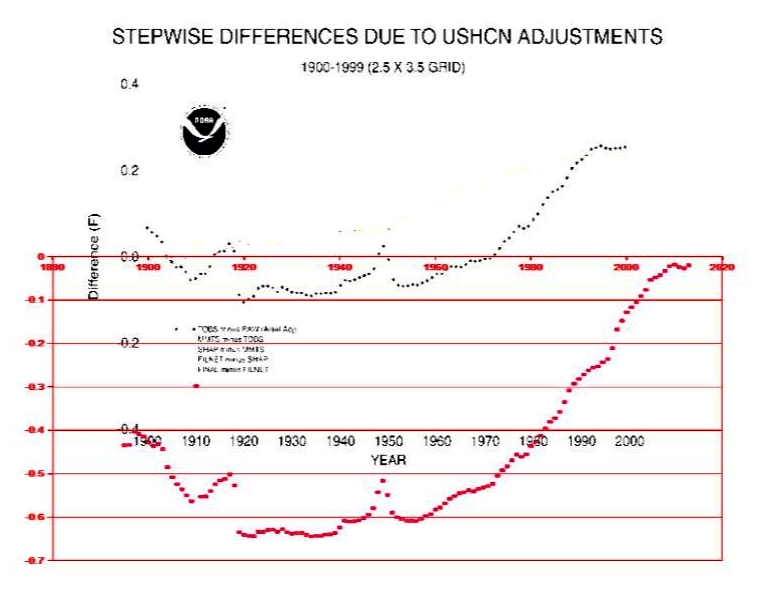
Below, I normalized the two data sets to 1940, and you can see that there is a large divergence between V2 and V1 after 1950, and particularly after 1990. In V1, TOBS goes flat after 1990, but in V2 it rises exponentially.
Here is their claim again.
This net effect is about the same as that of the TOB adjustments in the HCN version 1 temperature data (Hansen et al. 2001), which is to be expected since the same TOB-adjustment method is used in both versions.
One more view shows the adjustments normalized to 1998. As always, cooling the past to create the appearance of warming.