“They struggle on and on in agony until their sufferings become unbearable and they fall by the way, victims of the greatest catastrophe the world has ever seen.”
“ 30,000,000 in Russia Famine Zone having eaten cats, rats and dogs’ are now fleeing from their homes in a desperate search for some place where there is some Food.”
“ Bark is being stripped off the Trees for Food.”
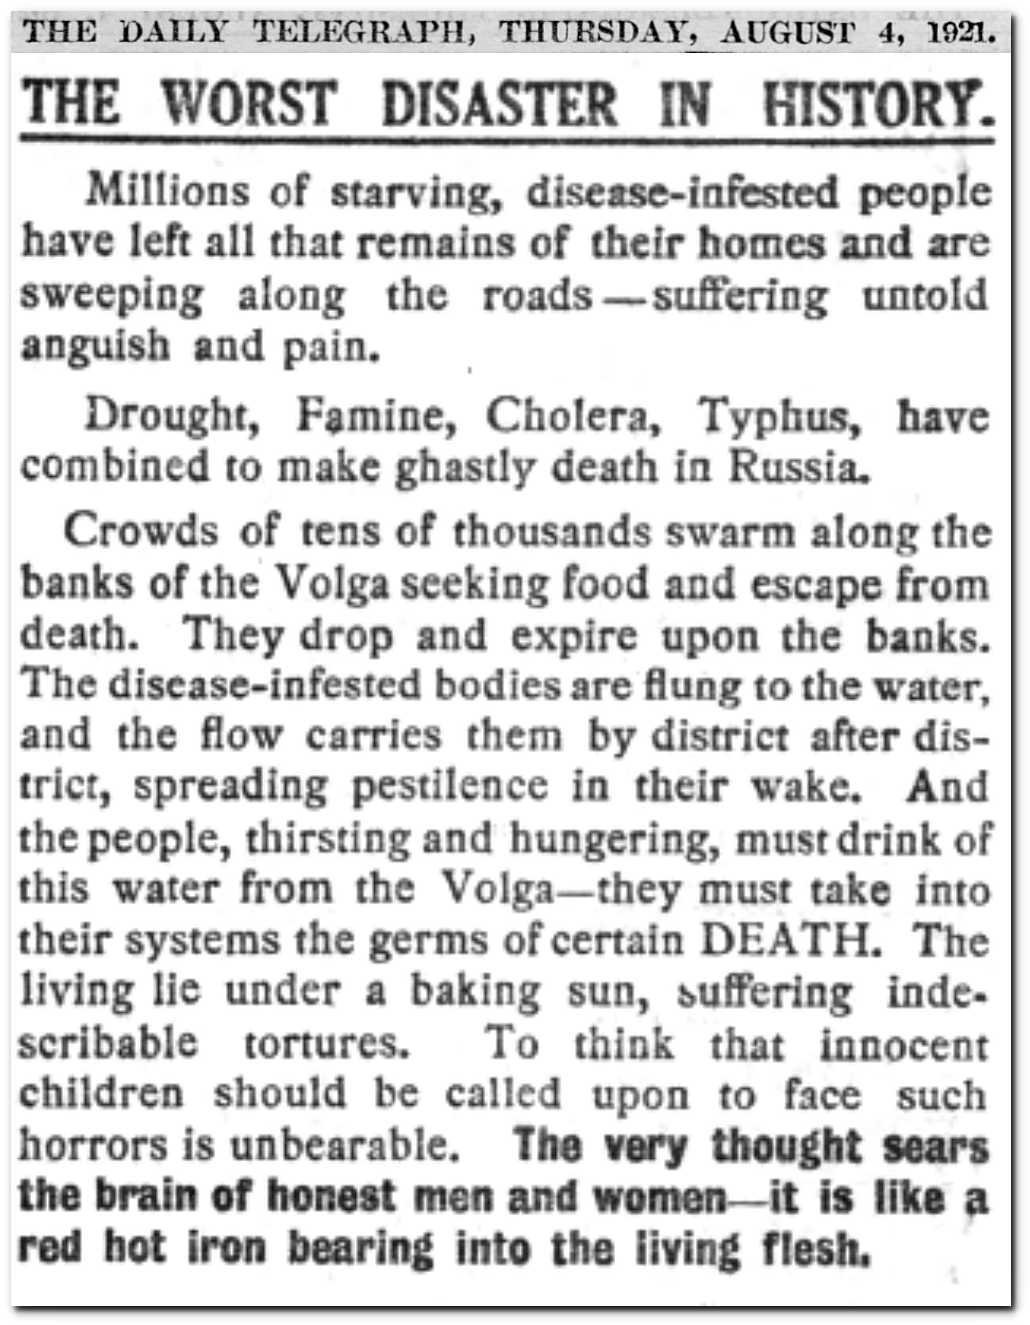

04 Aug 1921, 7 – The Daily Telegraph at Newspapers.com
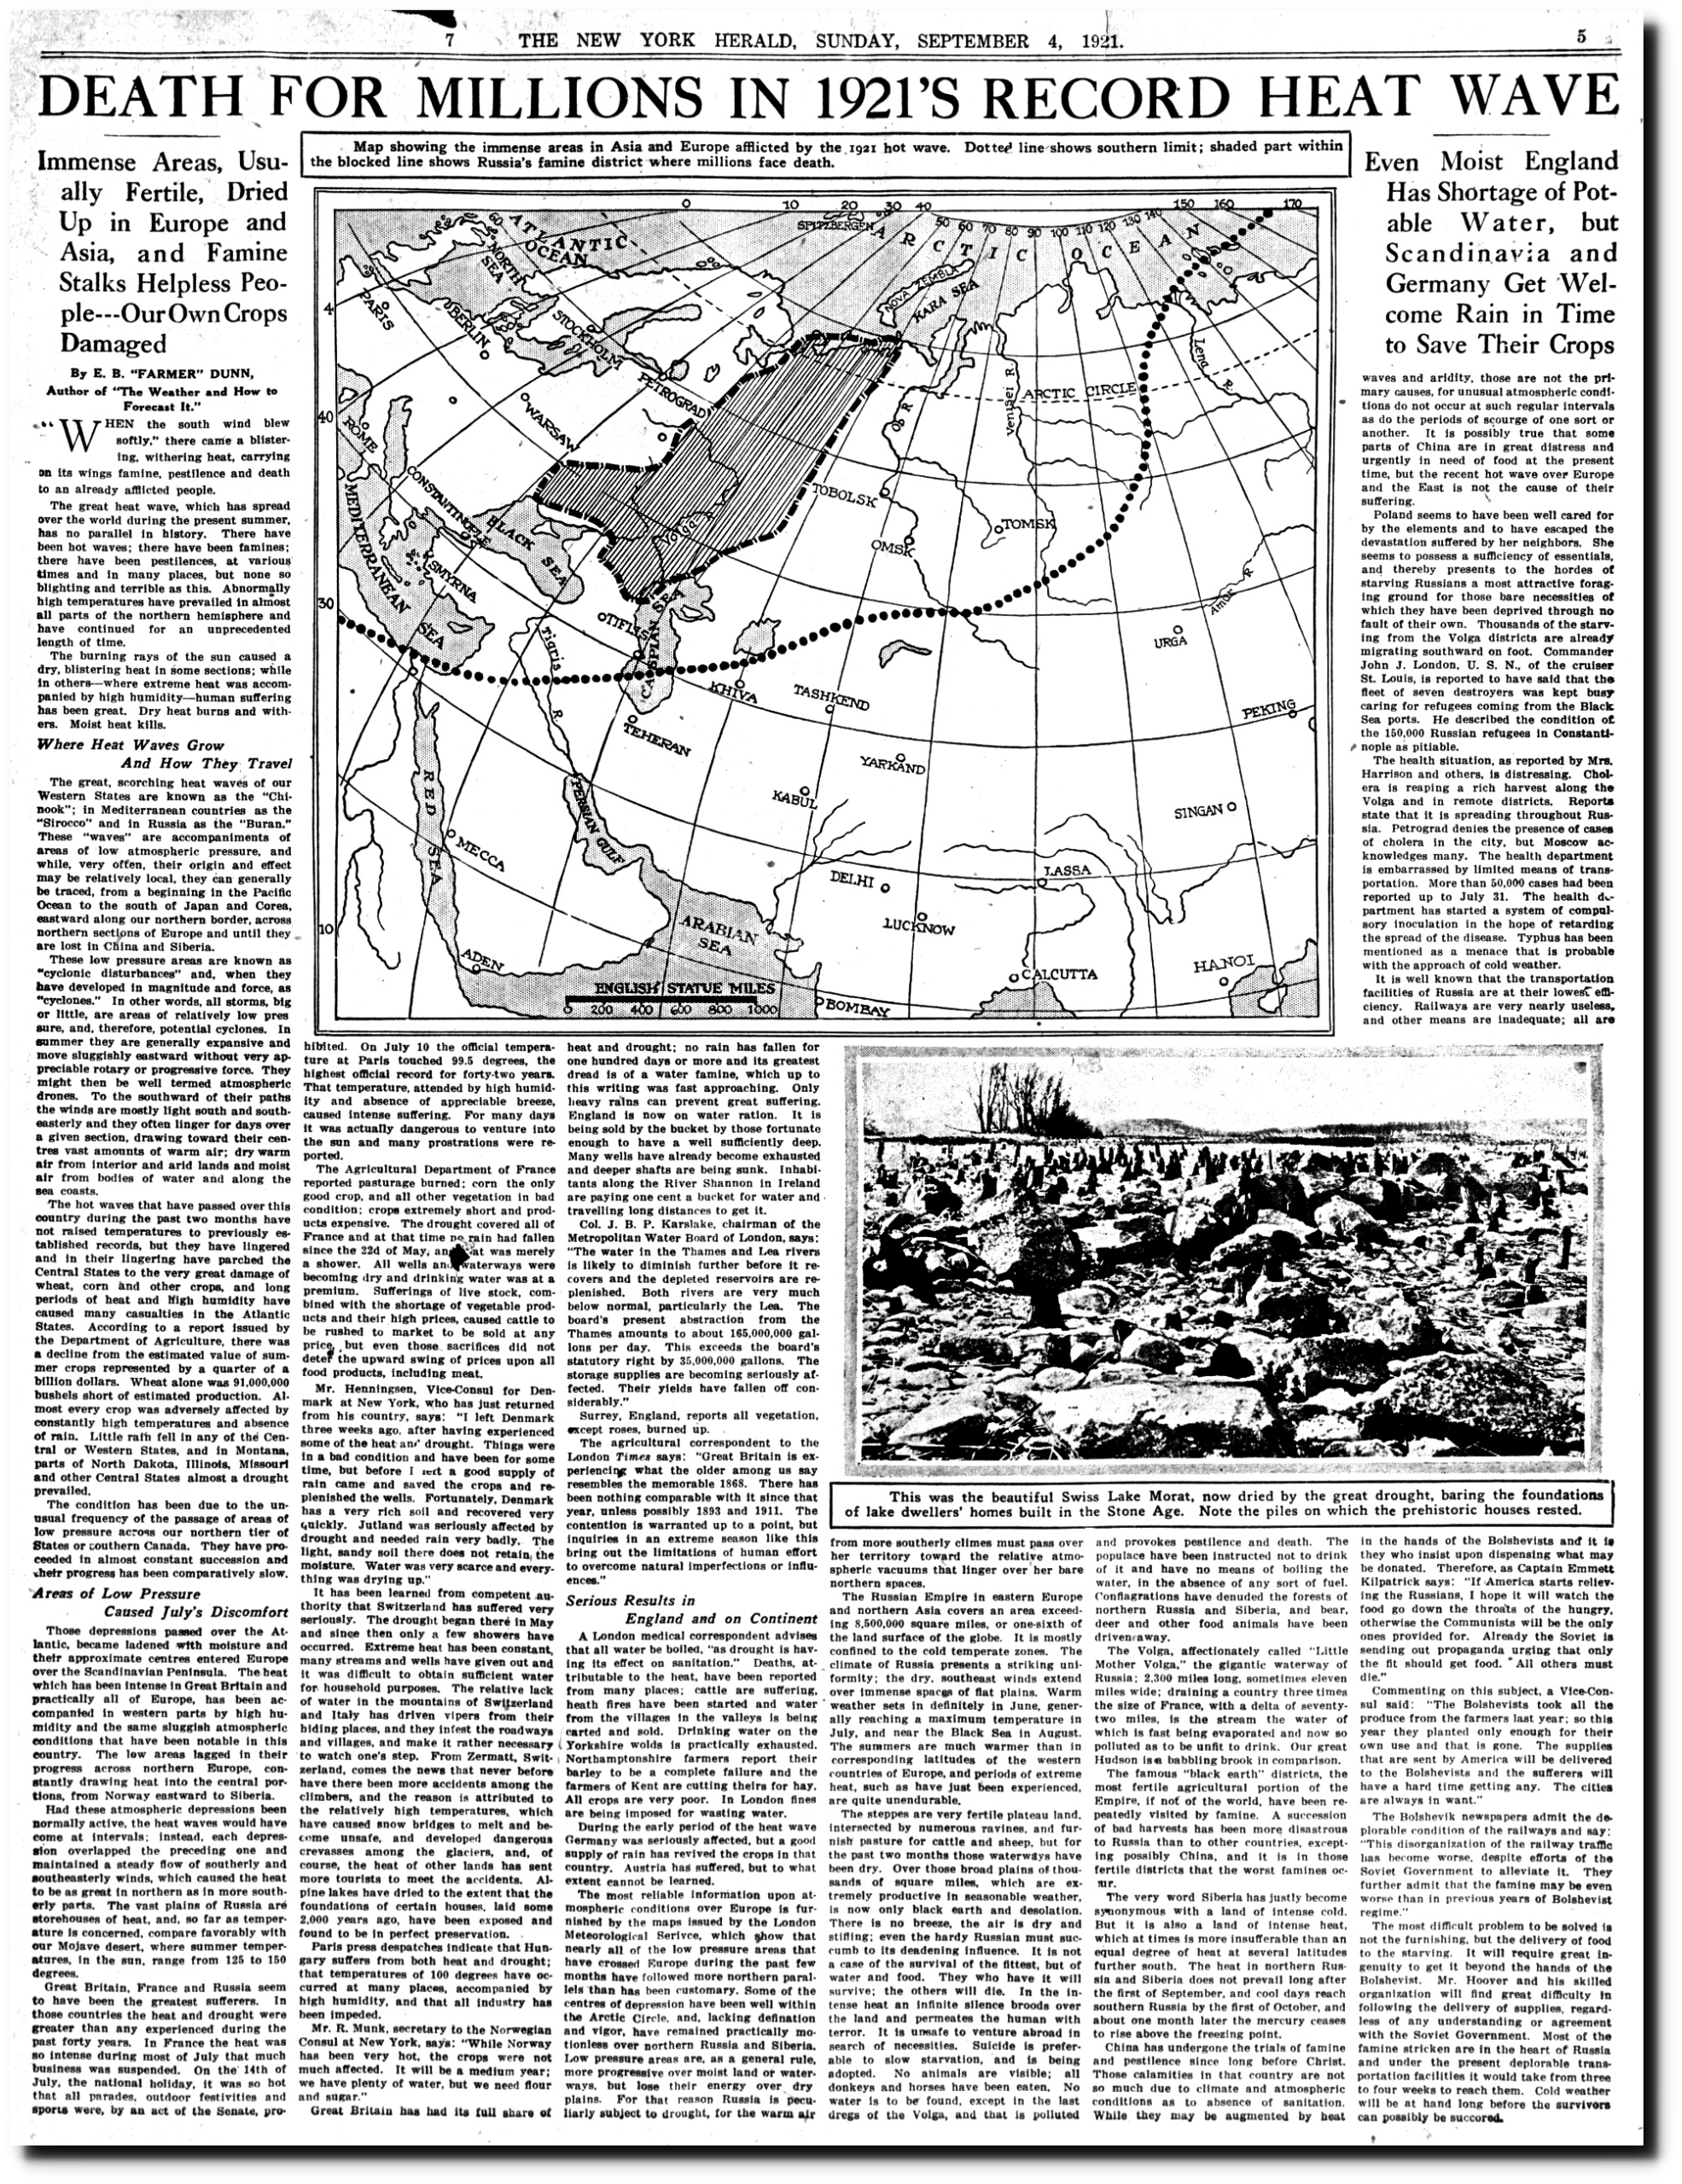
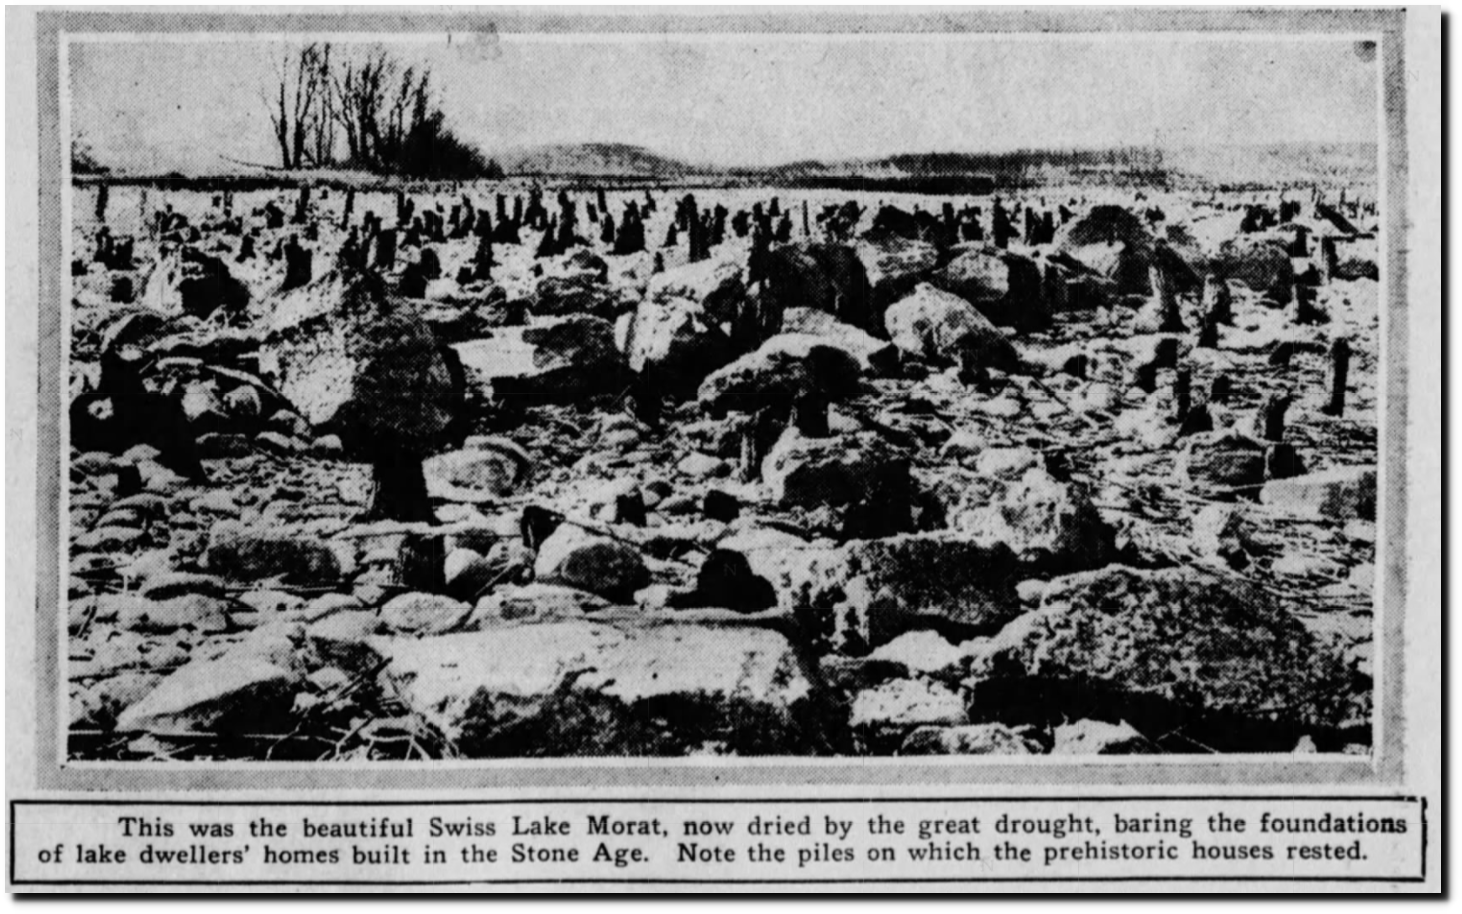
Switzerland’s Lake Morat dried up.
04 Sep 1921, 61 – New York Herald at Newspapers.com
This is what Lake Morat looks like now.

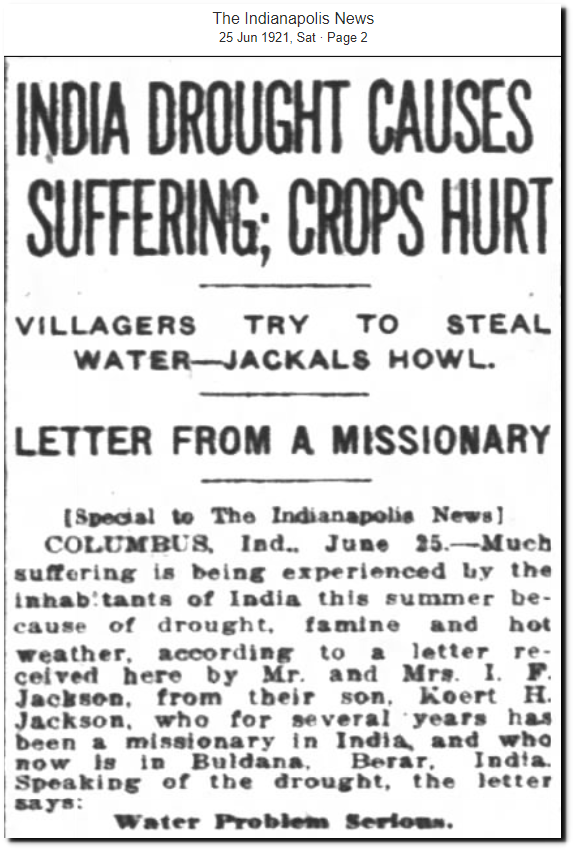
25 Jun 1921, Page 2 – The Indianapolis News at Newspapers.com
There was a large solar storm on May 15 of that year.

The Great Storm of May 1921: An Exemplar of a Dangerous Space Weather Event – Hapgood – 2019 – Space Weather – Wiley Online Library

(PDF) The 1859 space weather event revisited: Limits of extreme activity
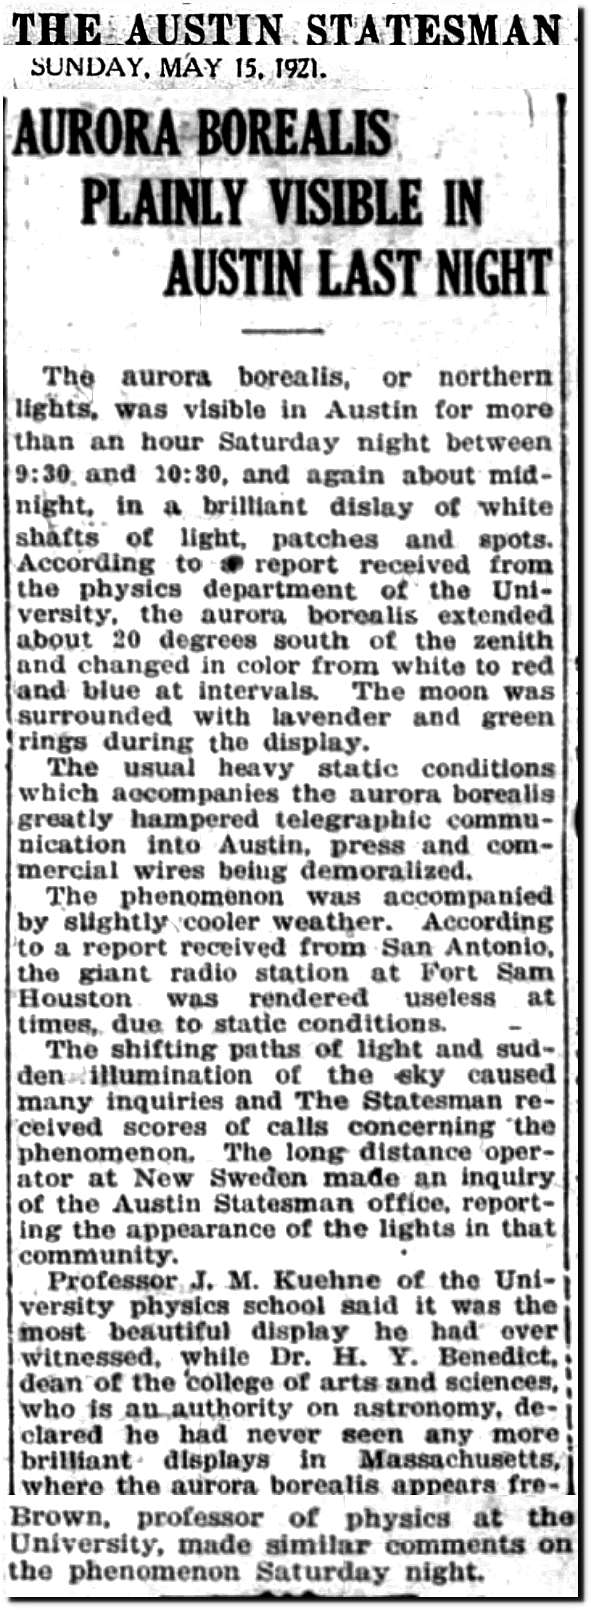
15 May 1921, 7 – Austin American-Statesman at Newspapers.com
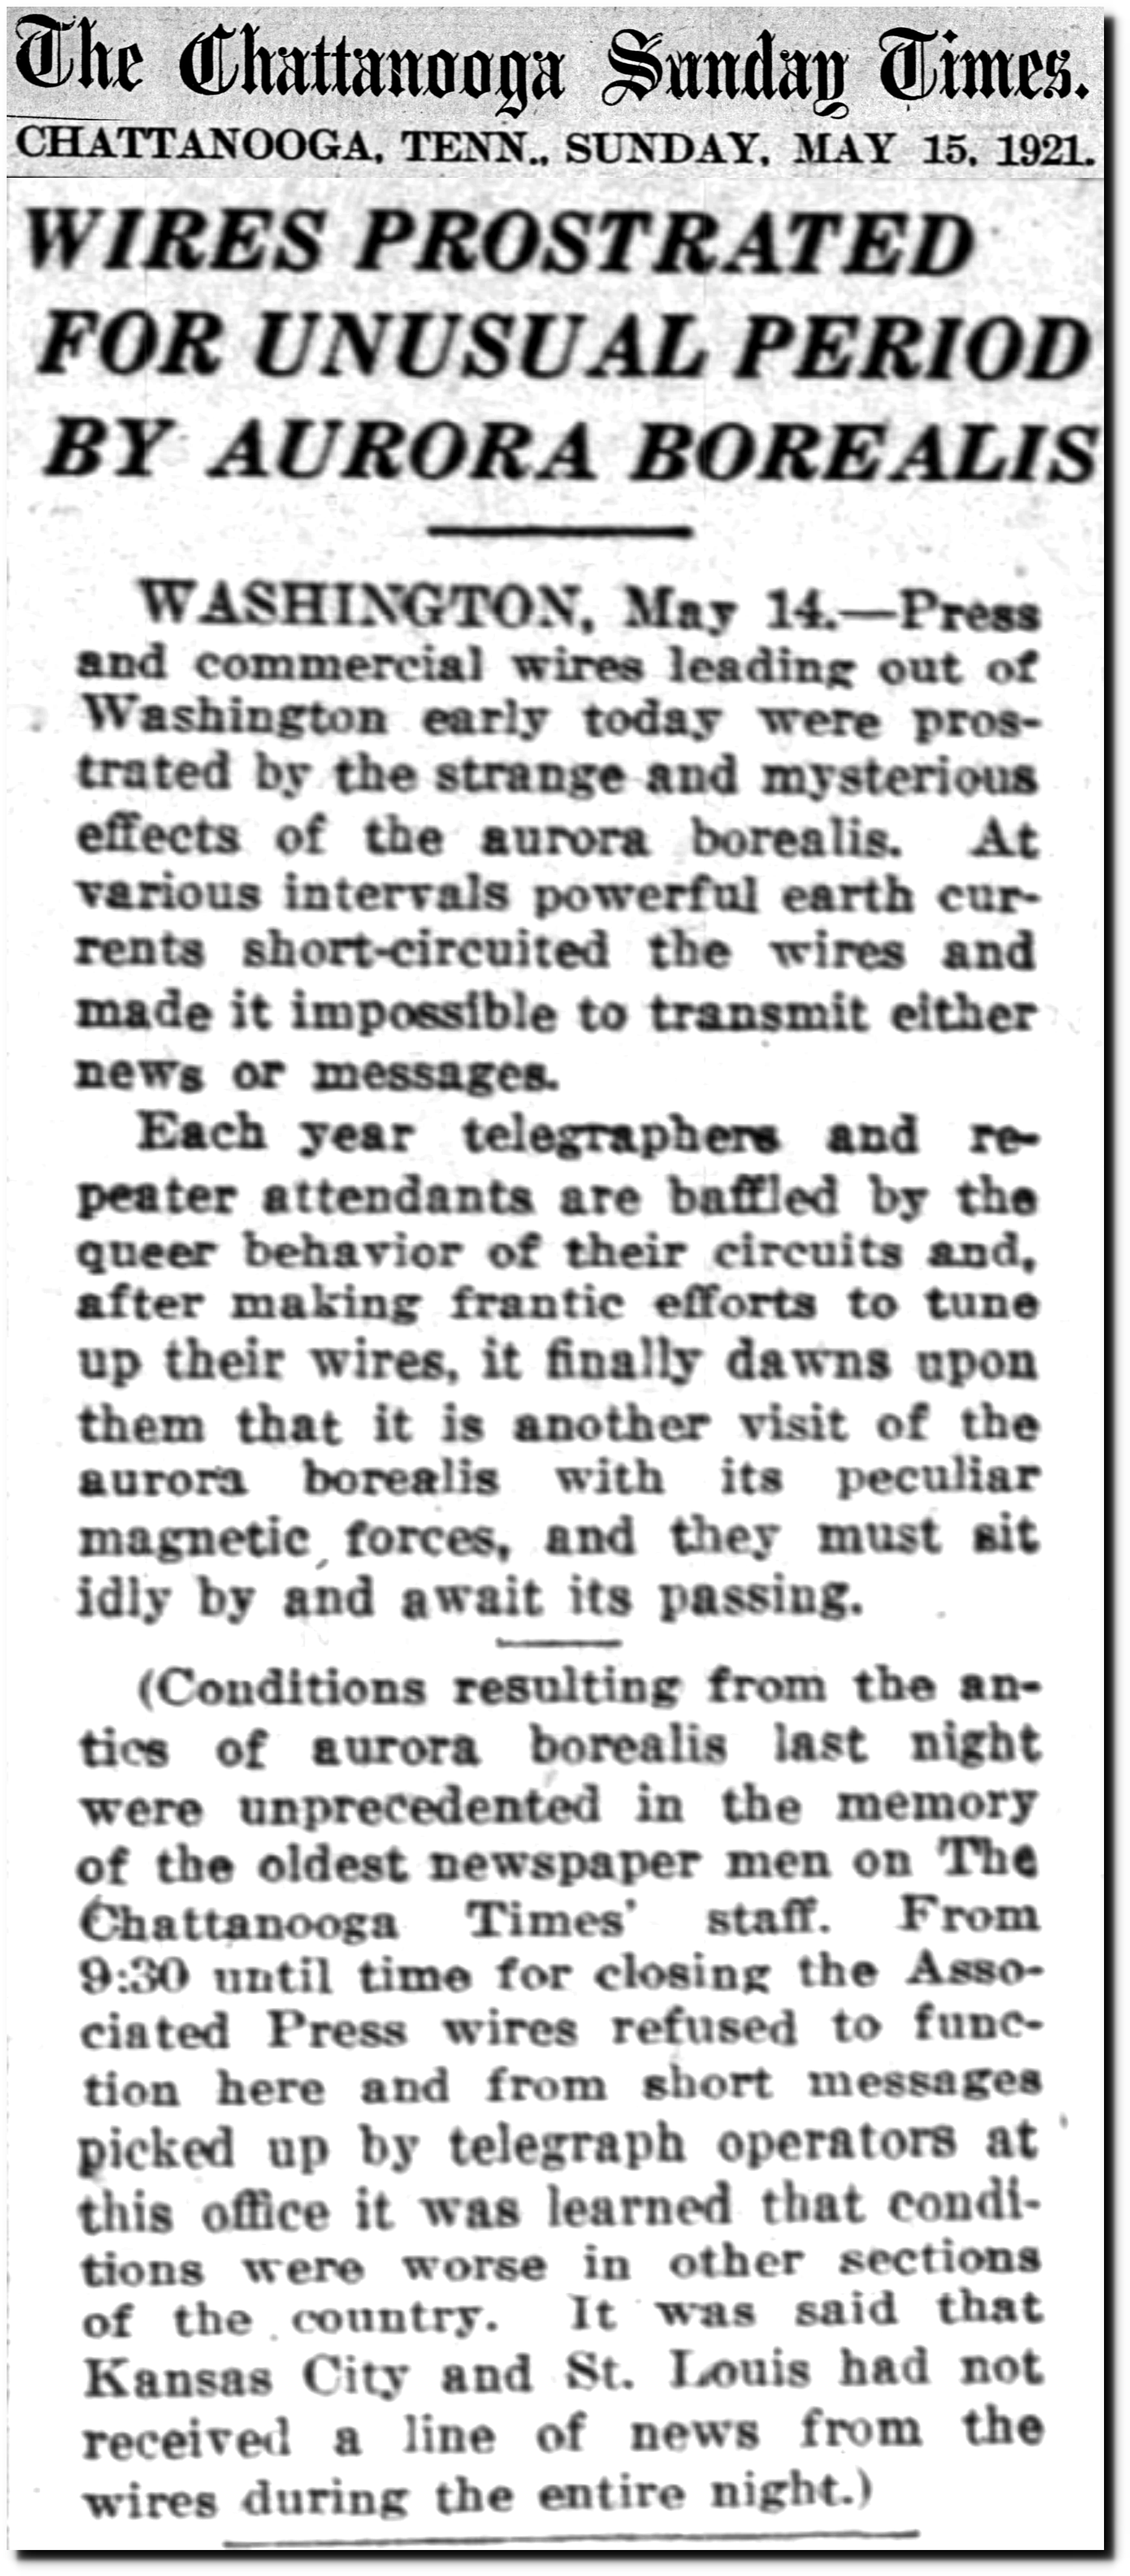
15 May 1921, 1 – Chattanooga Daily Times at Newspapers.com

15 May 1921, 55 – The San Francisco Examiner at Newspapers.com
The San Francisco Examiner devoted three pages to an explanation of how the drought was linked to behavior of the planets and the sun.
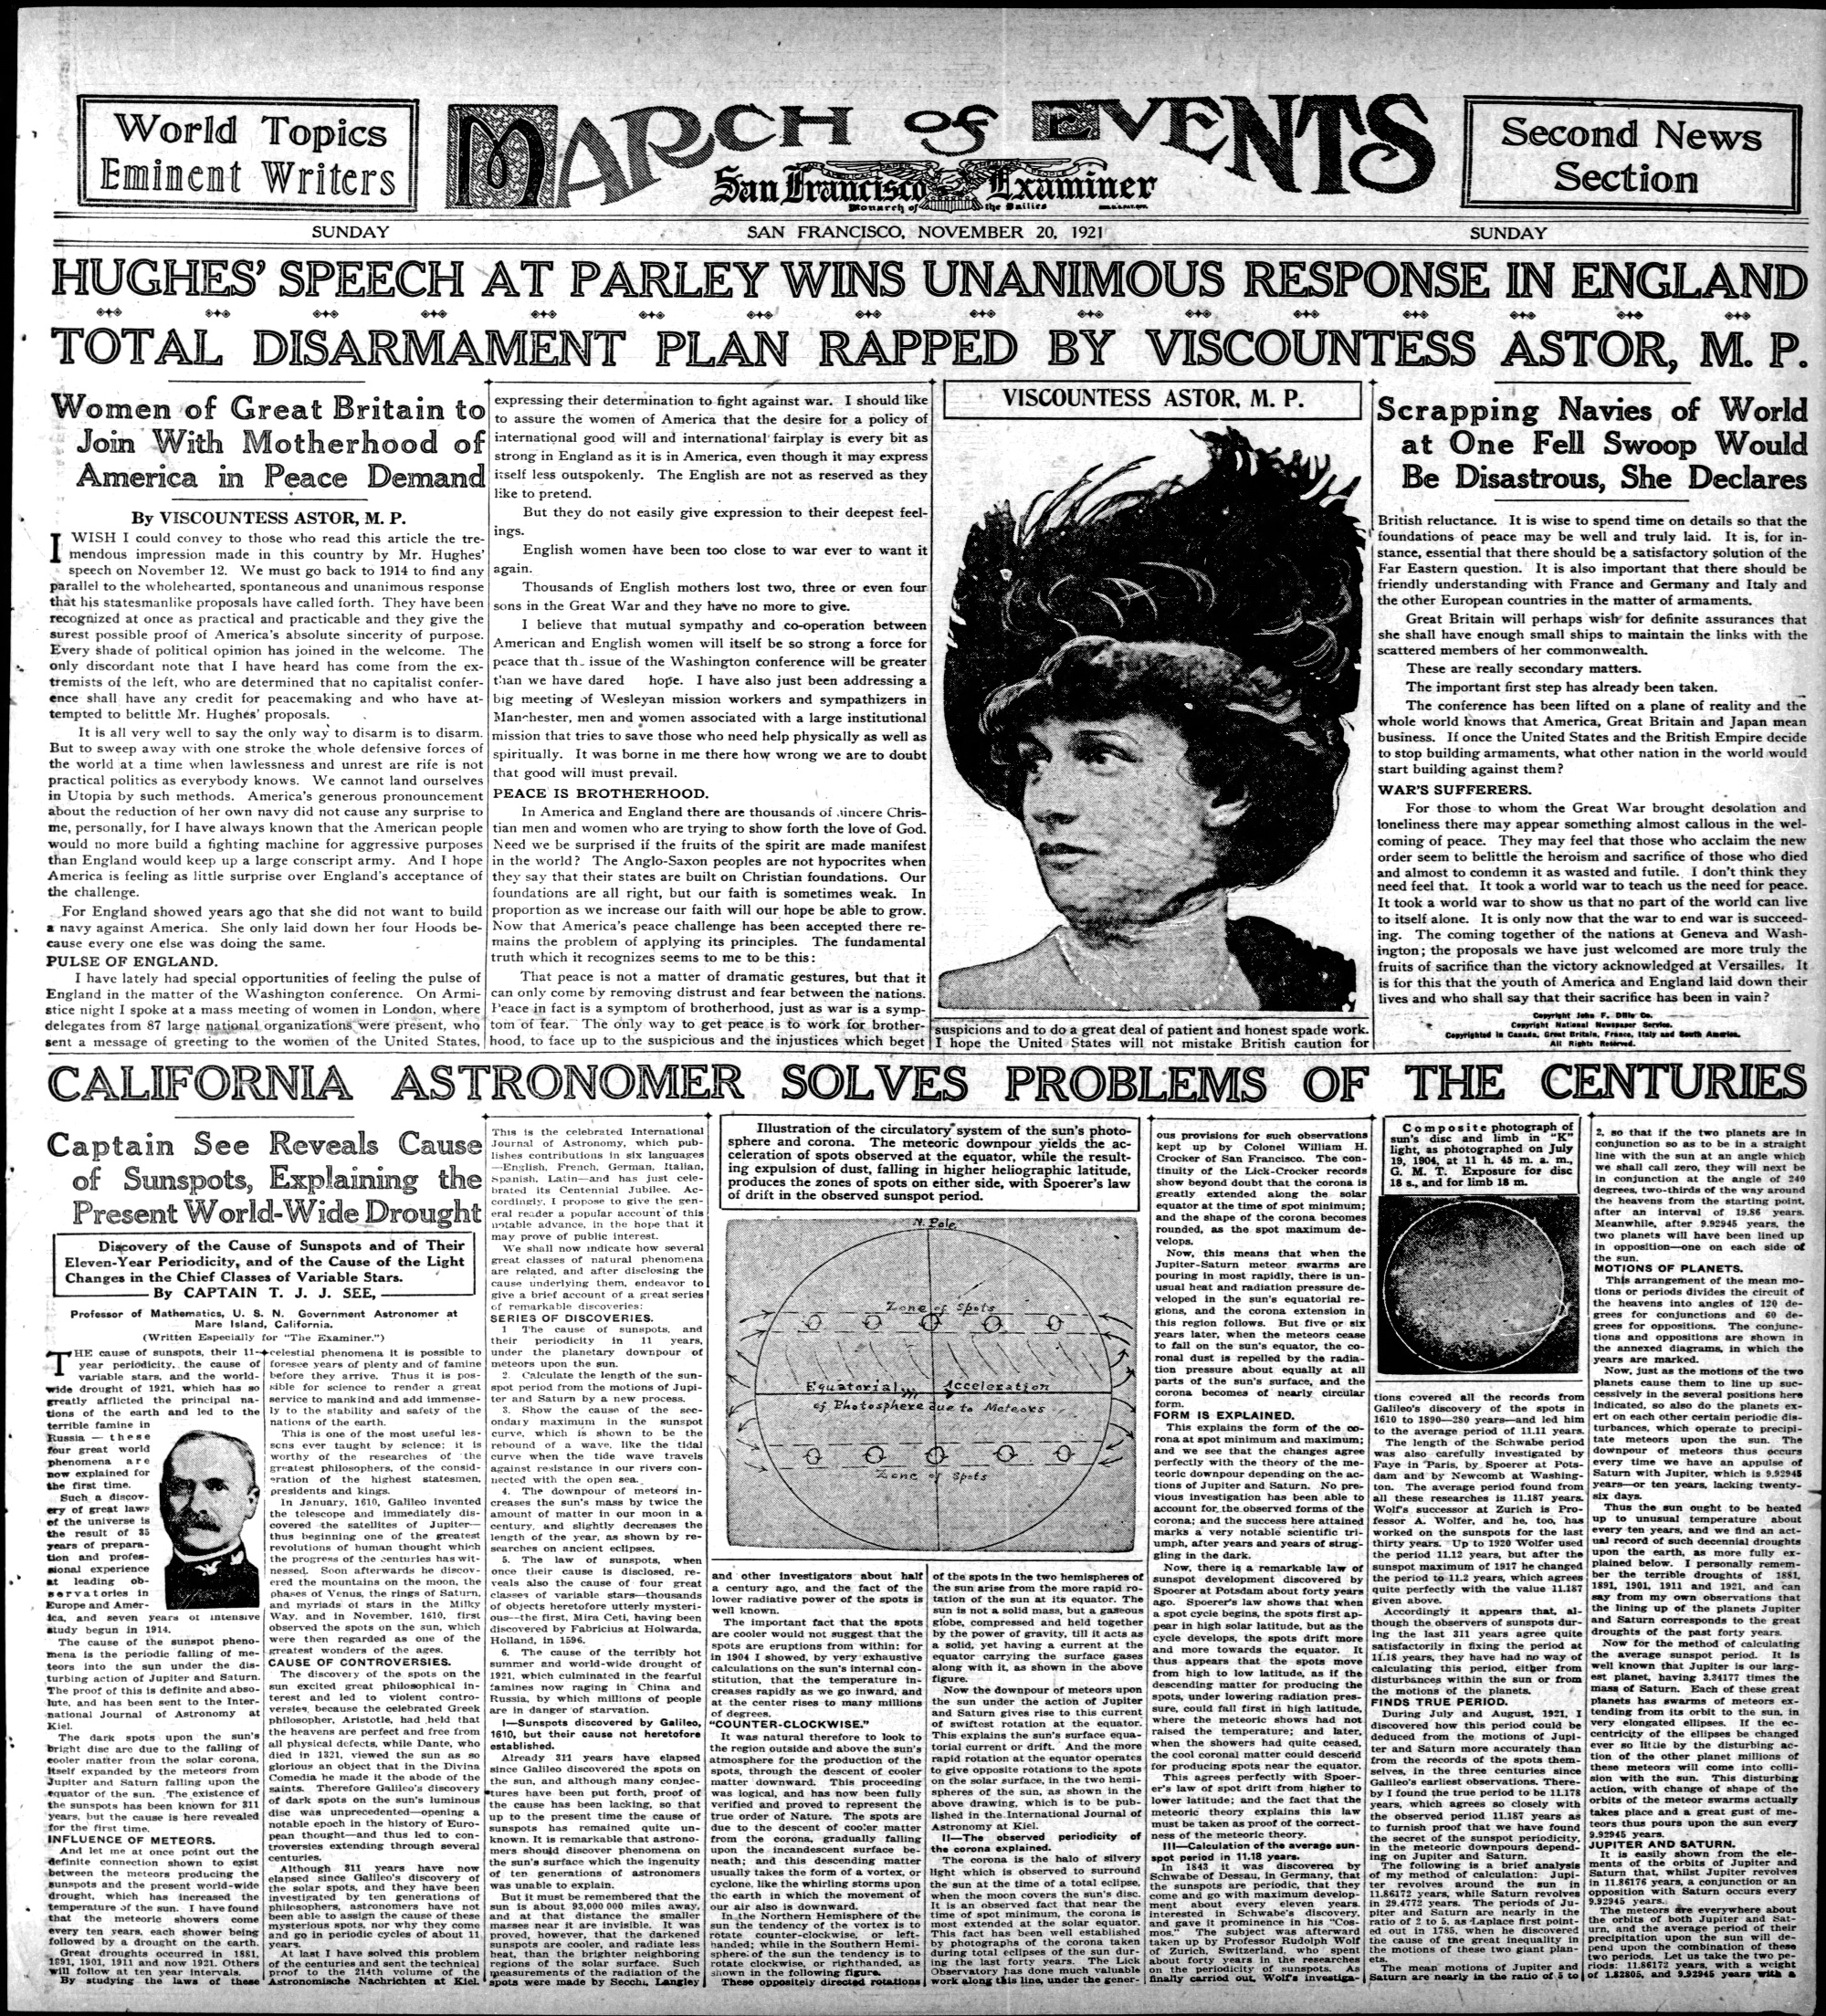

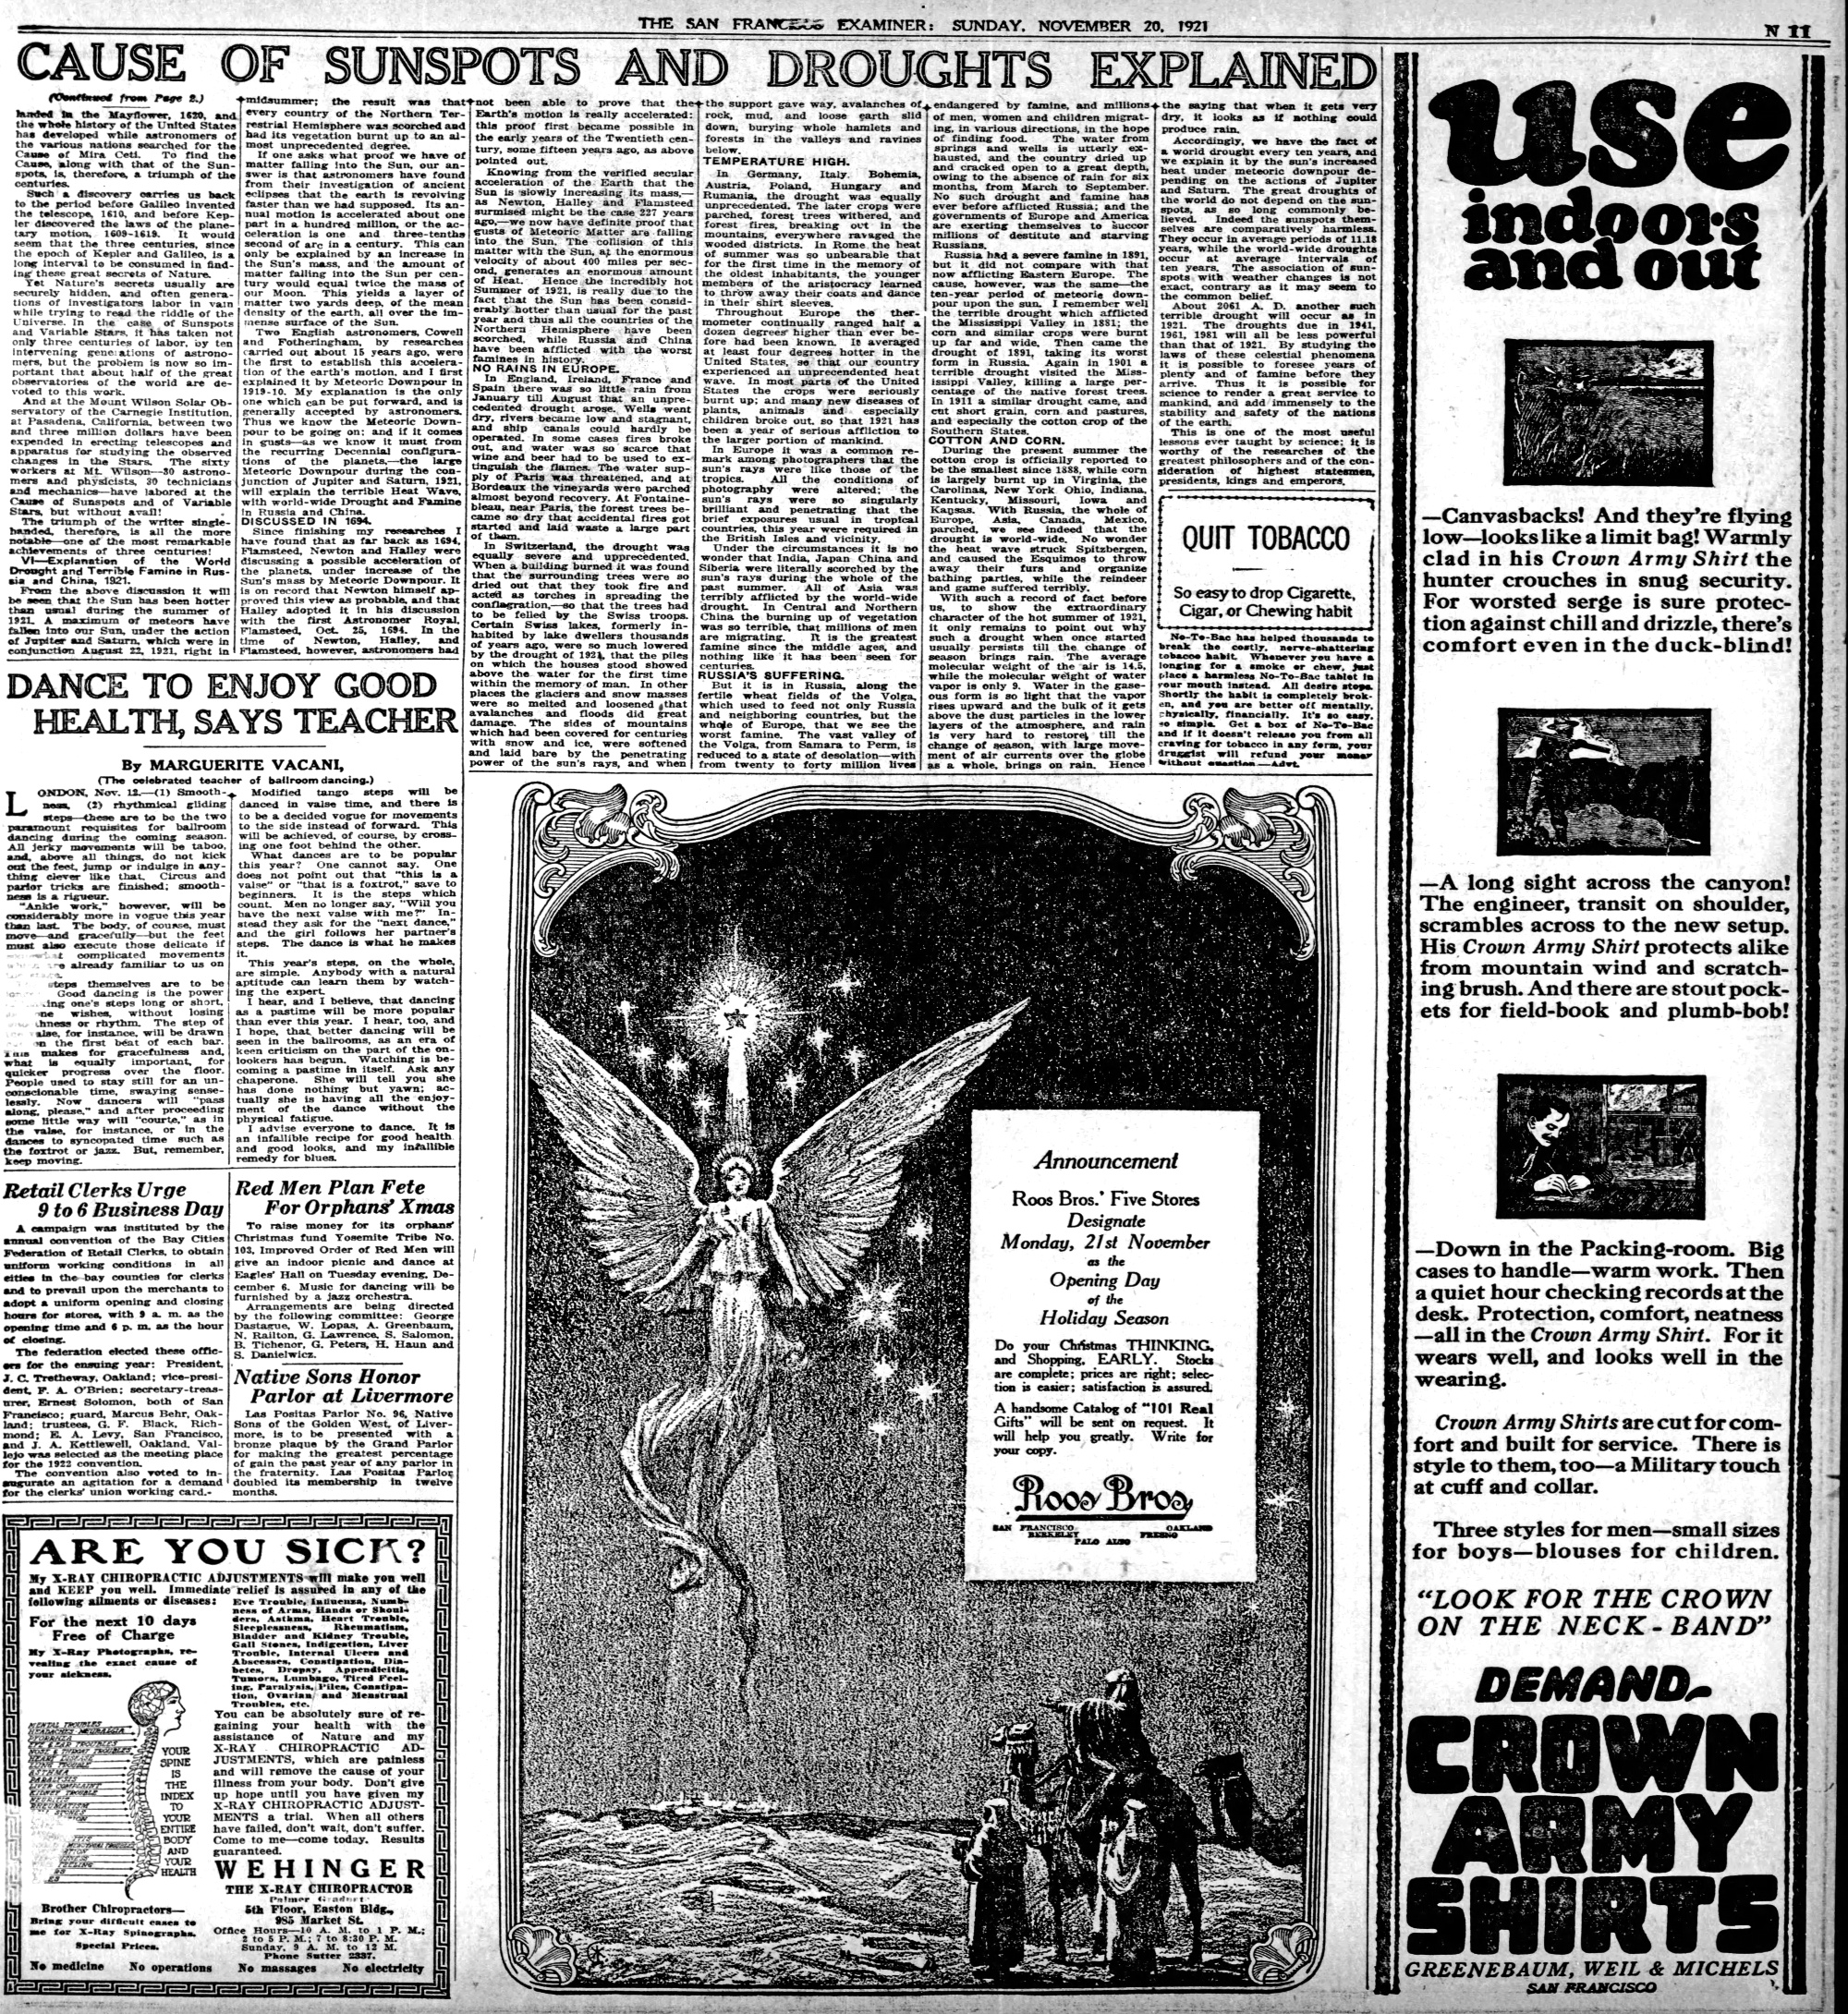
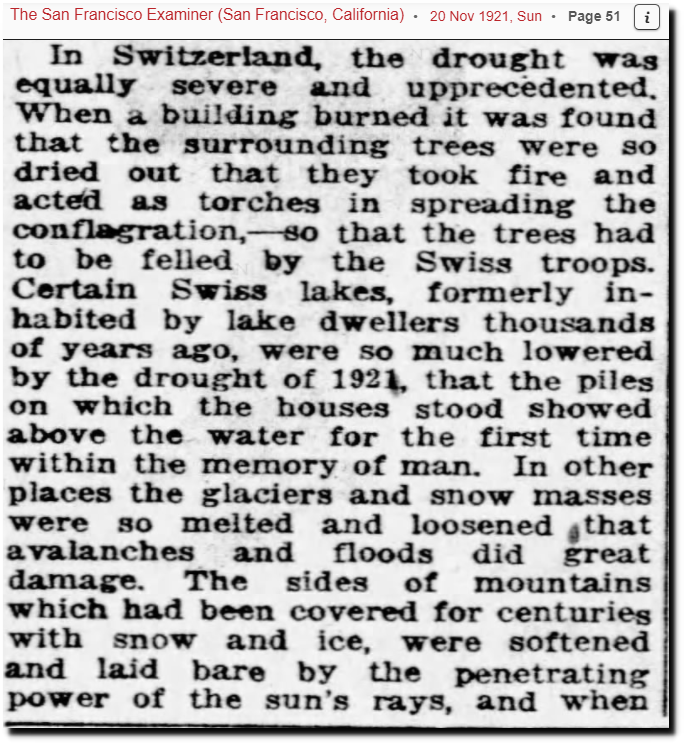
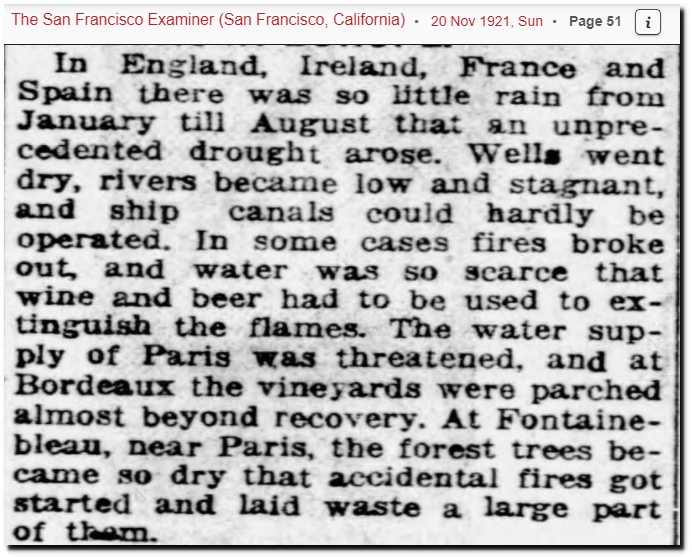
“THE SAN FRANCISCO EXAMINER SUNDAY. NOVEMBER 20, 1921
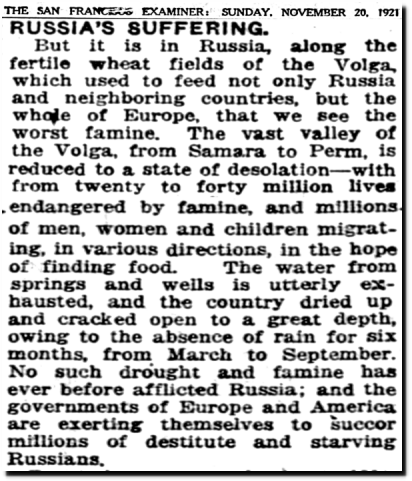
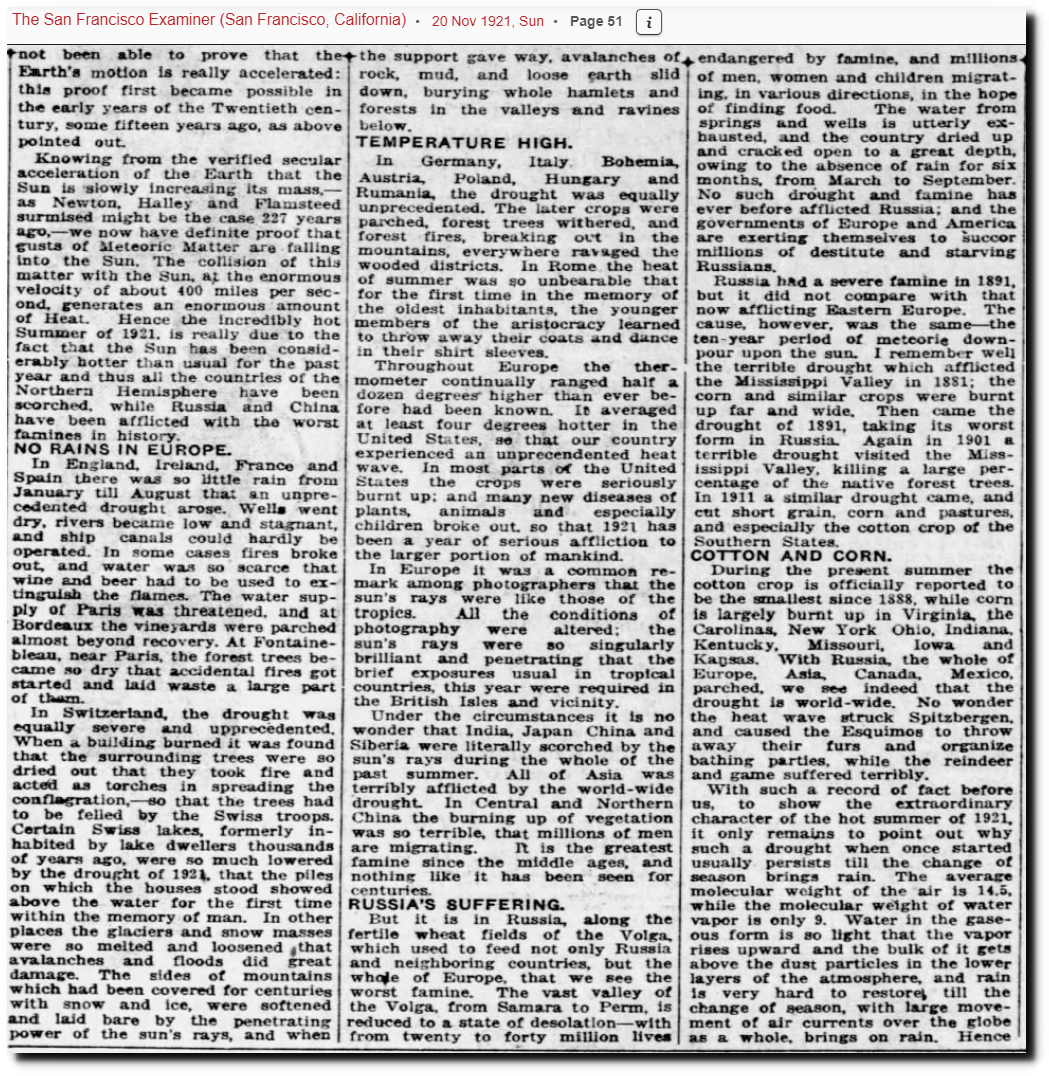
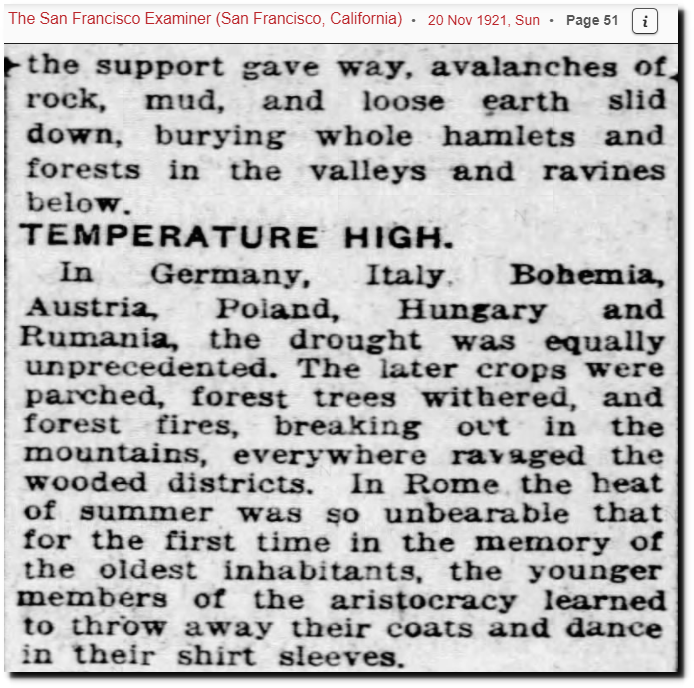
RUSSIA’S SUFFERING. But it is in Russia, along the fertile wheat fields of the Volga, which used to feed not only Russia and neighboring countries, but the whole of Europe, that we see the worst famine. The vast valley of the Volga, from Samara to Penn, is reduced to a state of desolation—with from twenty to forty million lives .endangered by famine, and millions, of men, women and children migrating, in various directions, in the hope of finding food. The water from springs and wells is utterly exhausted, and the country dried up and cracked open to a great depth, owing to the absence of rain for six months, from March to September. No such drought and famine has ever before afflicted Russia; and the governments of Europe and America are exerting themselves to succor millions of destitute and starving Russians.”

20 Nov 1921, 51 – The San Francisco Examiner at Newspapers.com
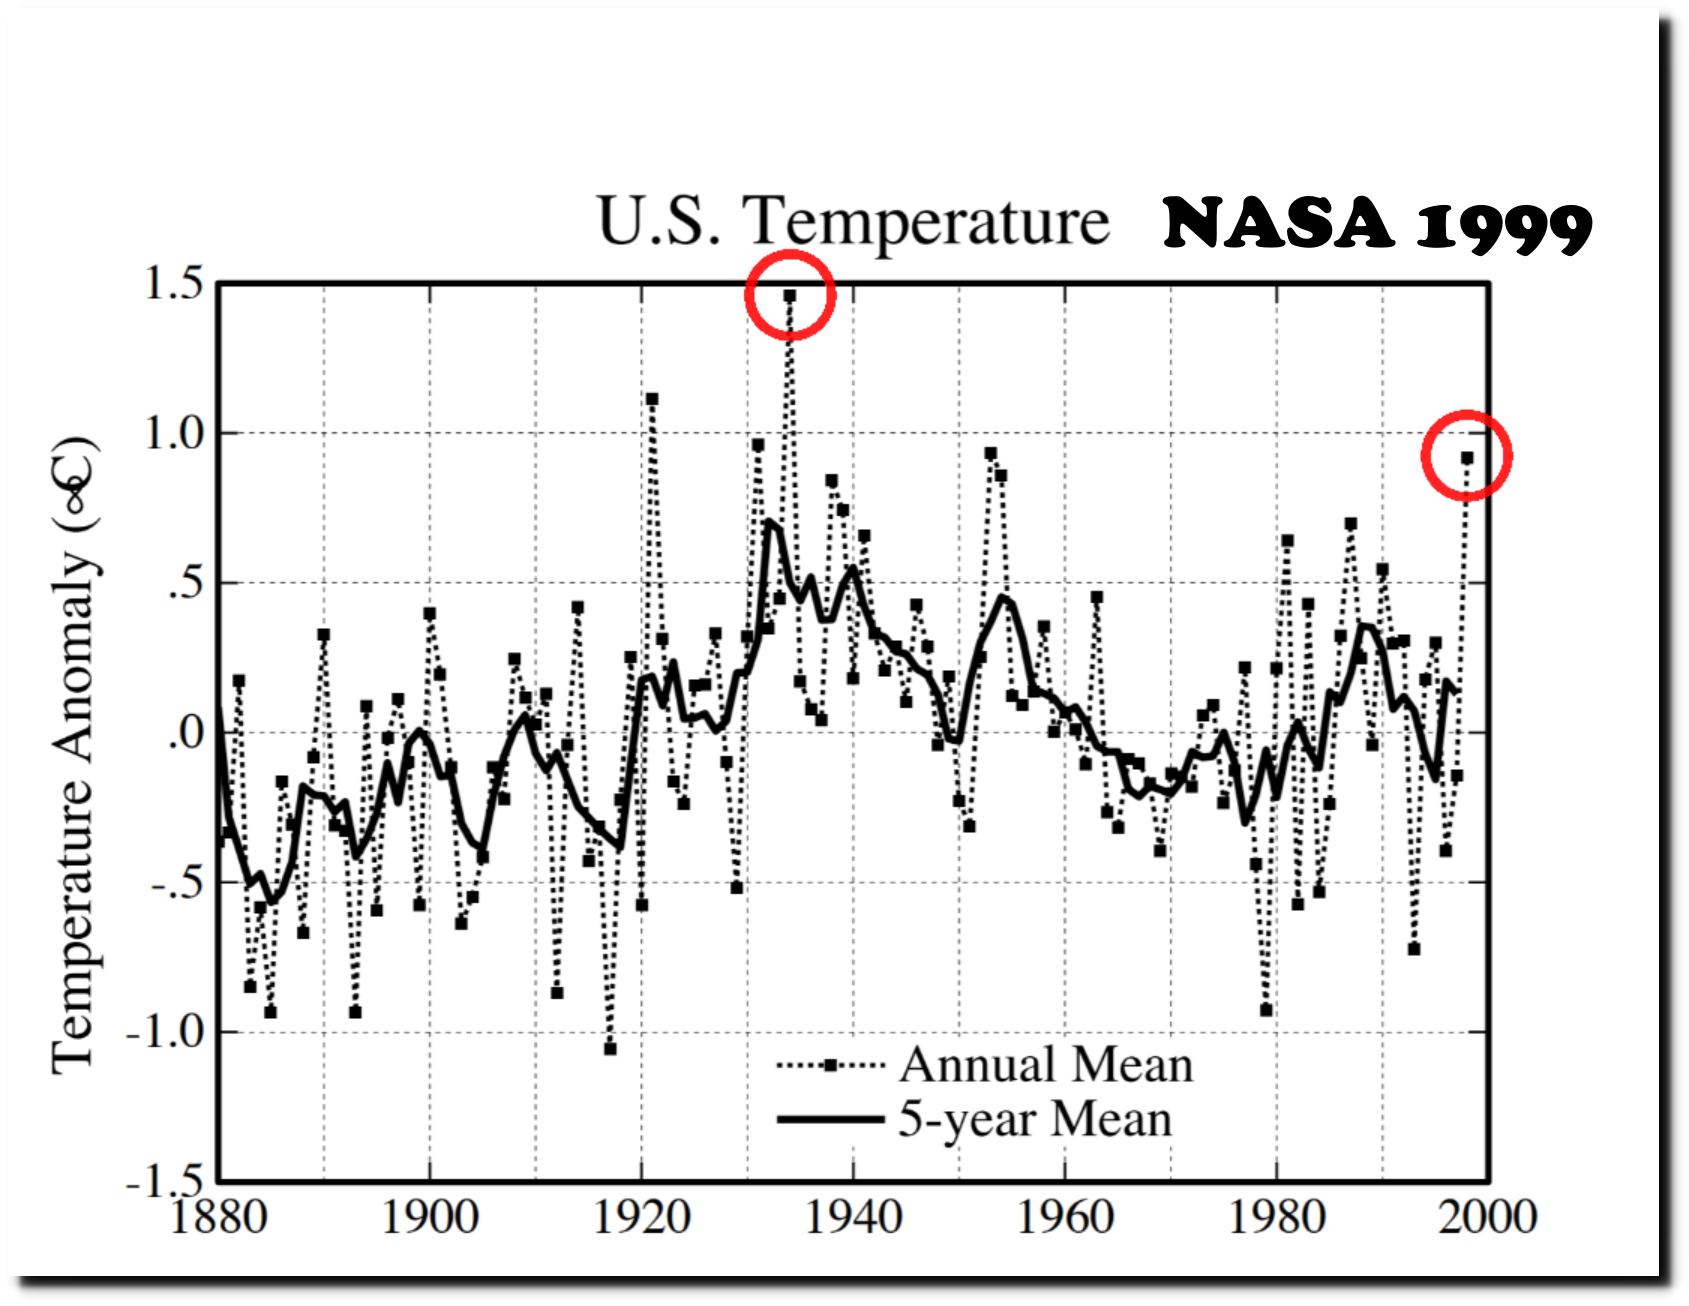
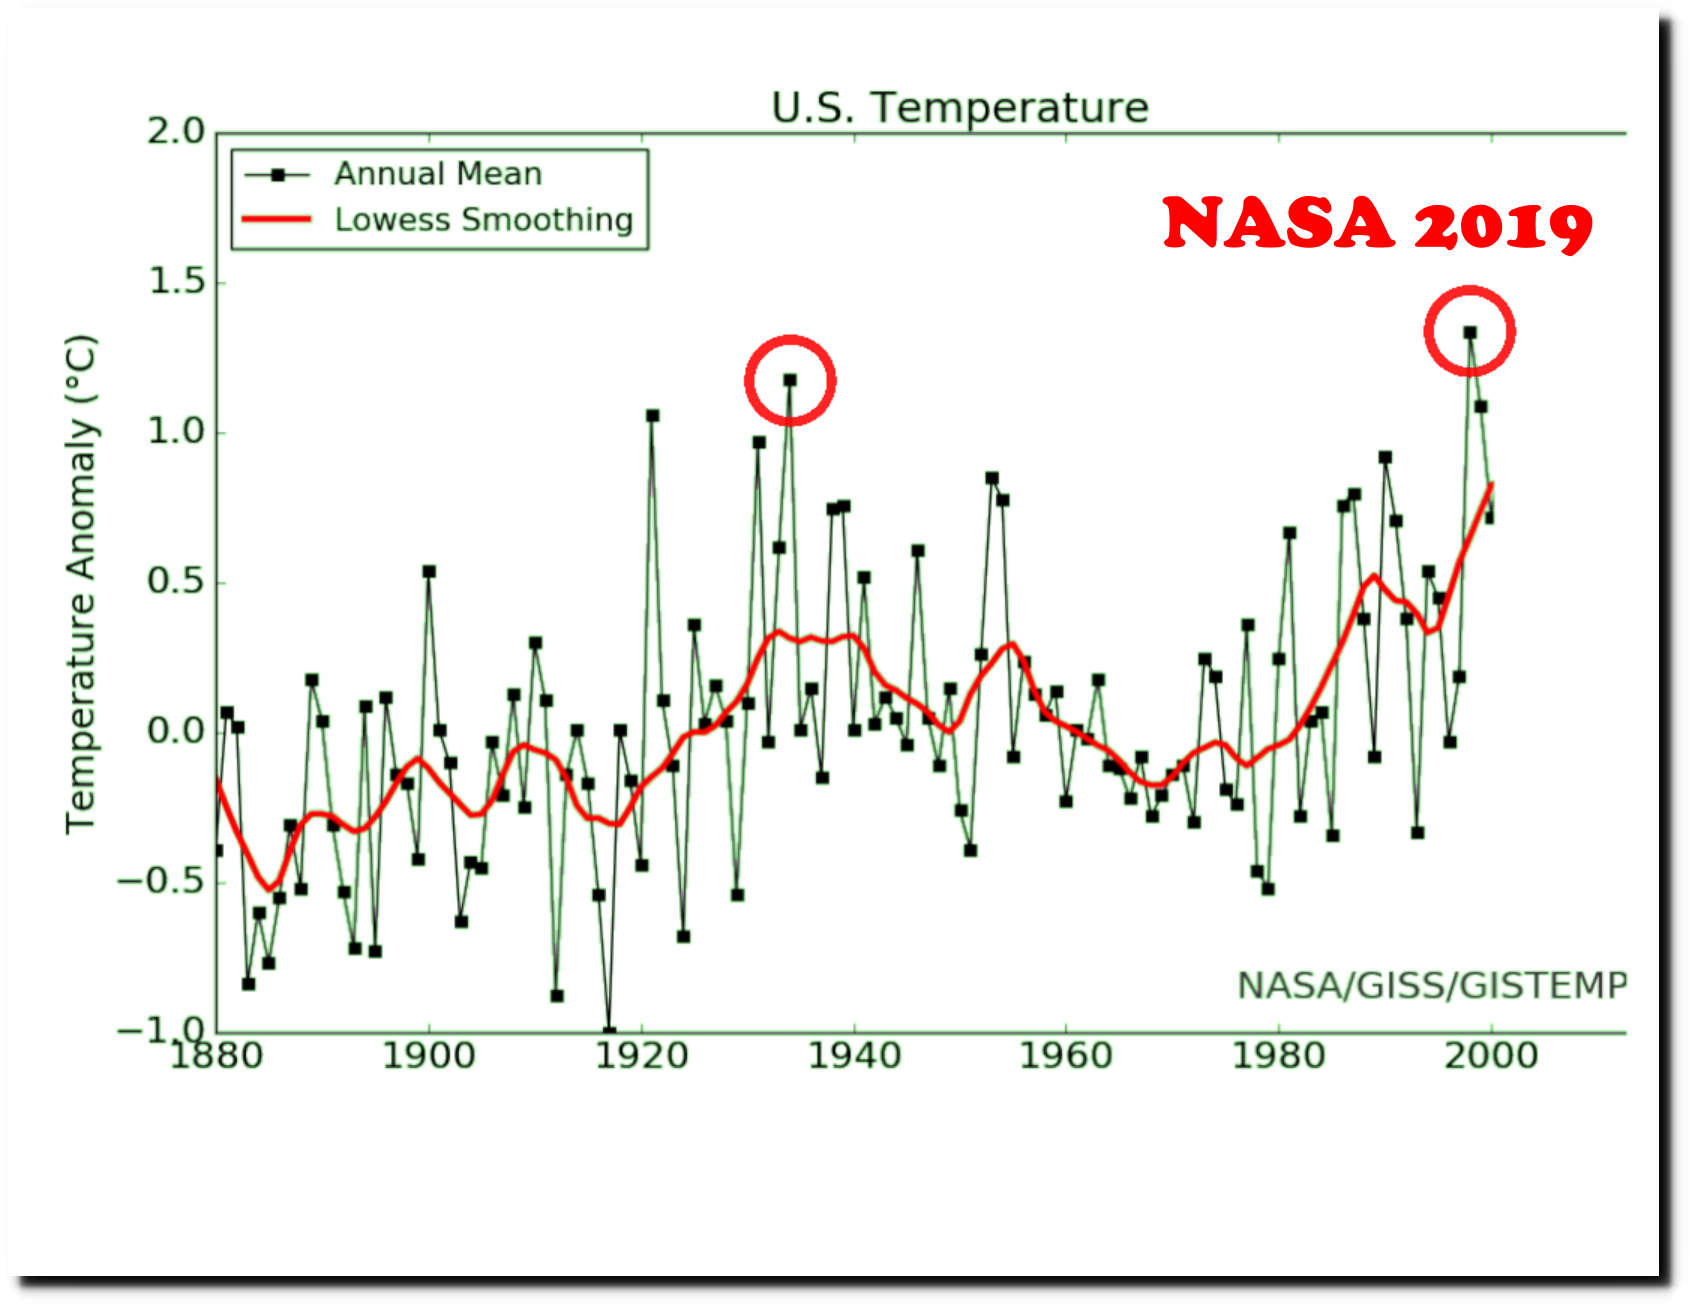
Prior to data tampering by NOAA and NASA, 1921 was the second hottest year in the US.
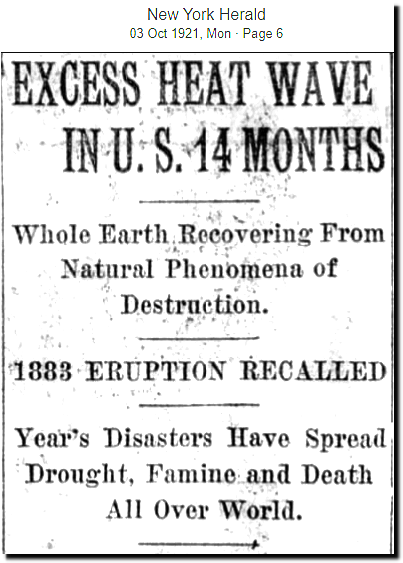
03 Oct 1921, 6 – New York Herald at Newspapers.com


