New York Times Announces Their Support For The Borg

ScreenHunter_91 Mar. 25 09.23

Three Cheers for the Nanny State – NYTimes.com

ScreenHunter_92 Mar. 25 09.30

“Why do you resist? We only wish to raise quality of life for all species.”

Locutus Of Borg
Posted in Uncategorized | 4 Comments

Coldest March In The US Since 1969?

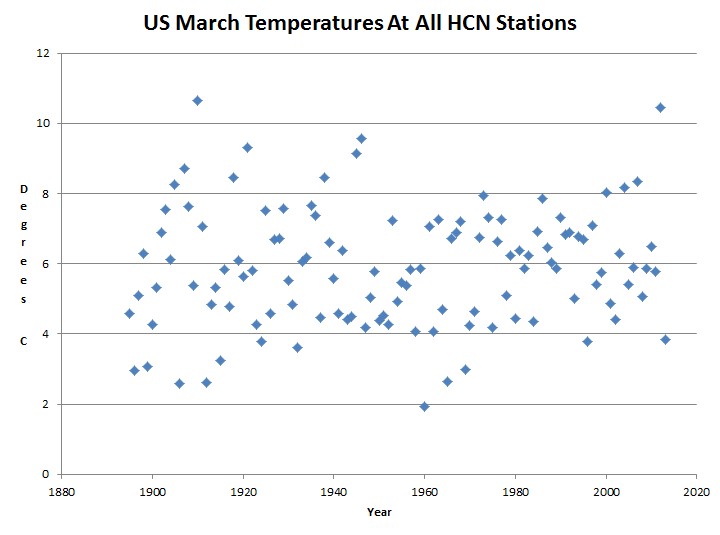
The average March 2013 US temperature has actually been declining over the past week due to very cold weather, and is now just a whisker above being the coldest March since 1969. The warmest March occurred in 1910.

ScreenHunter_90 Mar. 25 09.11

Posted in Uncategorized | 8 Comments

First White Appears On DC Cherry Trees

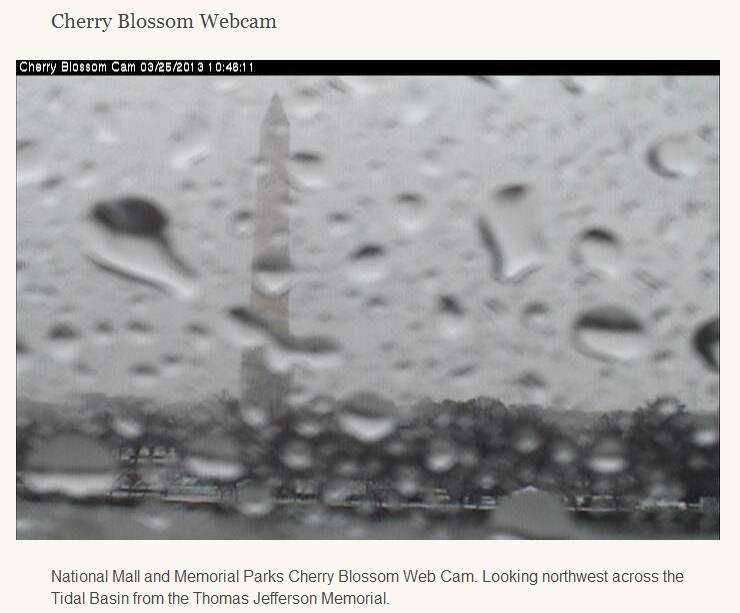
Cherry blossoms are running late this year at the Tidal Basin due to cold weather, but the first white has appeared on the trees – in the form of snow.

ScreenHunter_89 Mar. 25 08.49

National Park Service Webcam

Posted in Uncategorized | 1 Comment

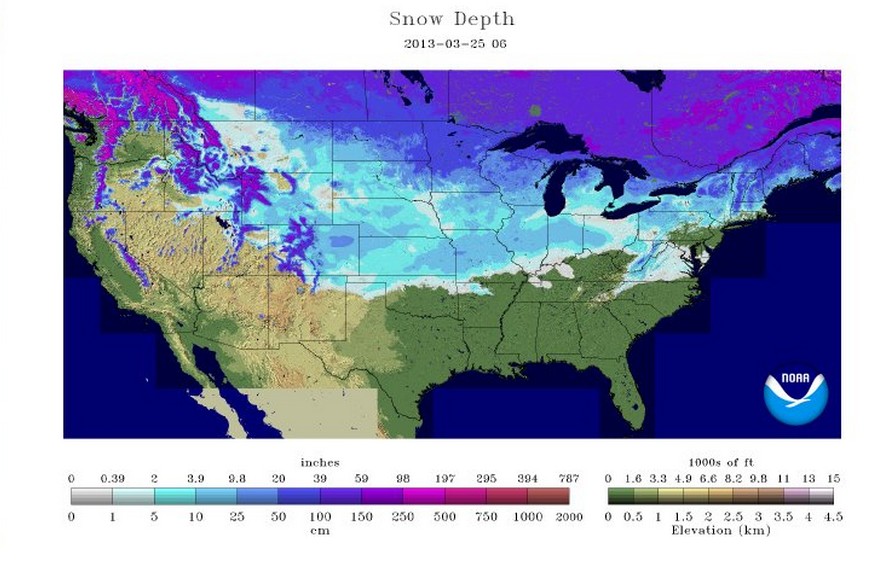
Early Spring Update : Most Of The US Is Covered With Snow

Climate experts have been telling us for years that global warming brings an early spring and declining snow cover. Now they say that a late spring and heavy spring snow cover is consistent with global warming.

ScreenHunter_88 Mar. 25 08.36

National Snow Analyses – NOHRSC – The ultimate source for snow information

As far as I can tell, there is no possible weather event which they would say is inconsistent with global warming. That is the nature of ad hoc politically driven junk science.

Posted in Uncategorized | 9 Comments

NASA’s James Hansen Spreading Misinformation About Heatwaves

NASA’s James Hansen wrote this last year

We conclude that extreme heat waves, such as that in Texas and Oklahoma in 2011 and Moscow in 2010, were “caused” by global warming, because their likelihood was negligible prior to the recent rapid global warming.

US Politics | AMERICAblog News: Quarter to half of species on earth may die from global warming

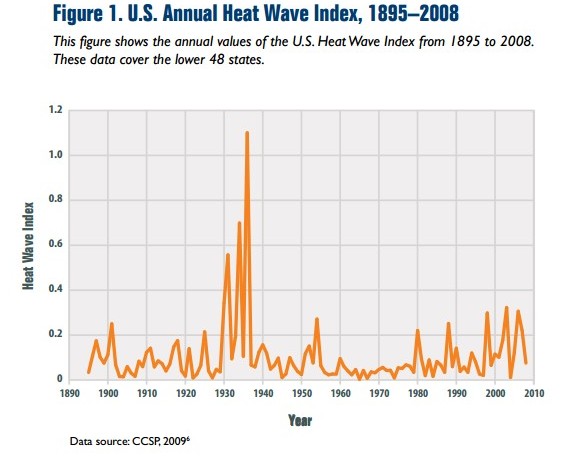
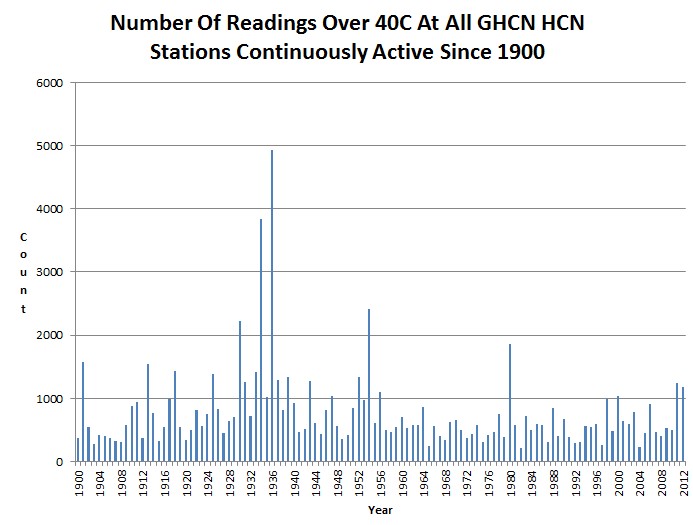
This claim is not supported by the historical record, which shows that the 1930s were much hotter.

The EPA says the exact opposite of Hansen.

Heat waves occurred with high frequency in the 1930s, and these remain the most severe heat waves in the U.S. historical record  (see Figure 1). Many years of intense drought (the “Dust Bowl”) contributed to these heat waves by depleting soil moisture and reducing the moderating effects of evaporation.

• There is no clear trend over the entire period tracked by the index. Although it is hard to see in Figure 1 (because of the extreme events of the 1930s), heat wave frequency decreased in the 1960s and 1970s but has risen since then (see Figure 1).

www.epa.gov/climate/climatechange/pdfs/print_heat-waves.pdf

The US had four times as many 40C readings in 1936 as it did in 2012. The summer of 2012 would have been considered a fairly normal summer prior to 1960.

ScreenHunter_320 Dec. 01 11.30

Posted in Uncategorized | 2 Comments

Bloomberg : “government should infringe on your freedom”

Michael Bloomberg has big plans and big money devoted to destroying the Bill of Rights, and he admitted it yesterday.

“I do think there are certain times we should infringe on your freedom,” Mr. Bloomberg said, during an appearance on NBC.

NYC Mayor Bloomberg: Government has right to ‘infringe on your freedom’ – Washington Times

h/t to Dave G

Posted in Uncategorized | 7 Comments

Biggest Day Since Irene

I’m not sure what is going on, but this blog is getting a huge number of page views today – the most since August 27, 2011 when it had 320,514 views.

Posted in Uncategorized | 14 Comments

All GISS US Warming Is Due To Data Tampering

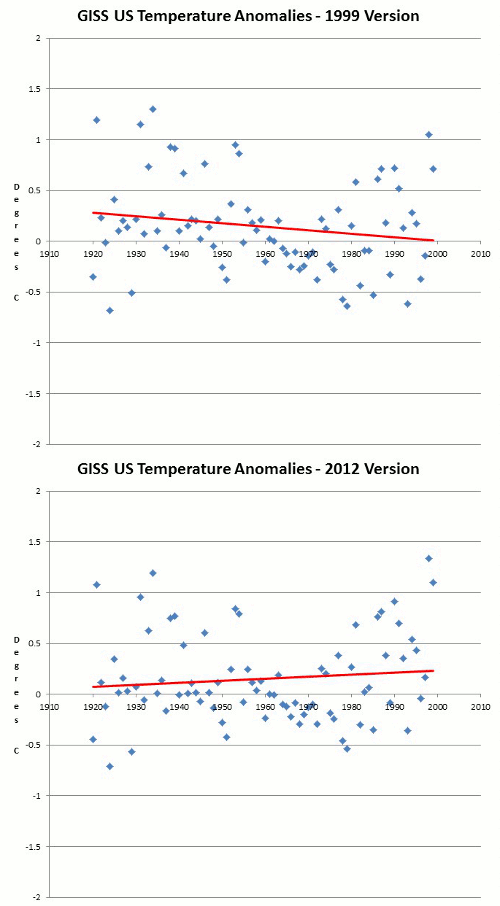
Until about ten years ago, NASA showed the US on an 80 year long cooling trend, with the three hottest years being in the 1920s and 1930s. They have deleted the raw data from their website and blocked archiving, but John Daly captured it. It was originally located at this link :

http://www.giss.nasa.gov/data/update/gistemp/graphs/FigD.txt

and can now be seen here :

http://web.archive.org/web/20120124014257/http://www.john-daly.com/usatemps.006

NASA has since rewritten US history and shows the same period warming – with 1998 as the hottest year.

data.giss.nasa.gov/gistemp/graphs_v3/Fig.D.txt

James Hansen wrote this in 1999, before he decided to alter US history :

Empirical evidence does not lend much support to the notion that climate is headed precipitately toward more extreme heat and drought. The drought of 1999 covered a smaller area than the 1988 drought, when the Mississippi almost dried up. And 1988 was a temporary inconvenience as compared with repeated droughts during the 1930s “Dust Bowl” that caused an exodus from the prairies, as chronicled in Steinbeck’s Grapes of Wrath.

in the U.S. there has been little temperature change in the past 50 years, the time of rapidly increasing greenhouse gases — in fact, there was a slight cooling throughout much of the country

NASA GISS: Science Briefs: Whither U.S. Climate?

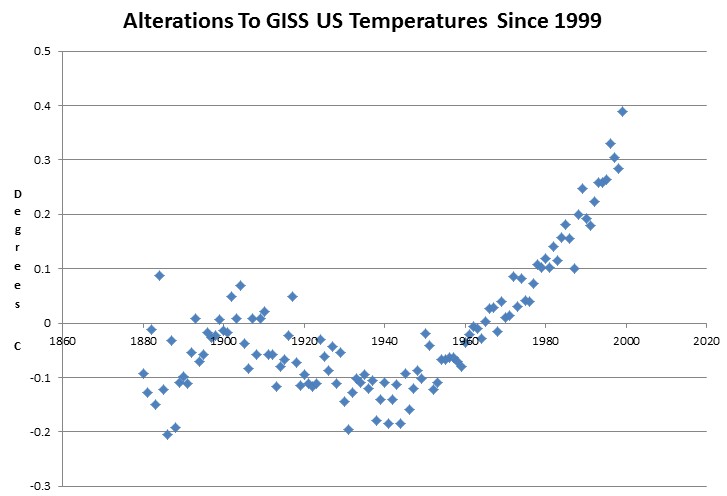
This sort of honest assessment was no use for obtaining funding, so Hansen created a hockey stick of adjustments to cool the past and warm the present.

Posted in Uncategorized | 8 Comments

30% Of GISS Global Warming Is Due To Data Tampering Since 2005

A reader has been saving GISS temperature data every month since 2005, and sent it over to me.

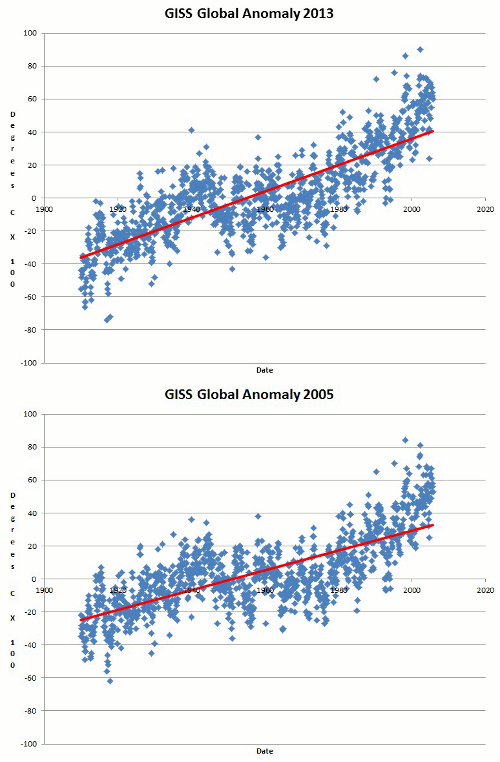
In 2005, Hansen showed about 0.55C warming from 1910 to 2005. Now he shows almost 0.75C warming over that same time interval.

GISSGlobalTamperingSince2005

2005 version   2013 version

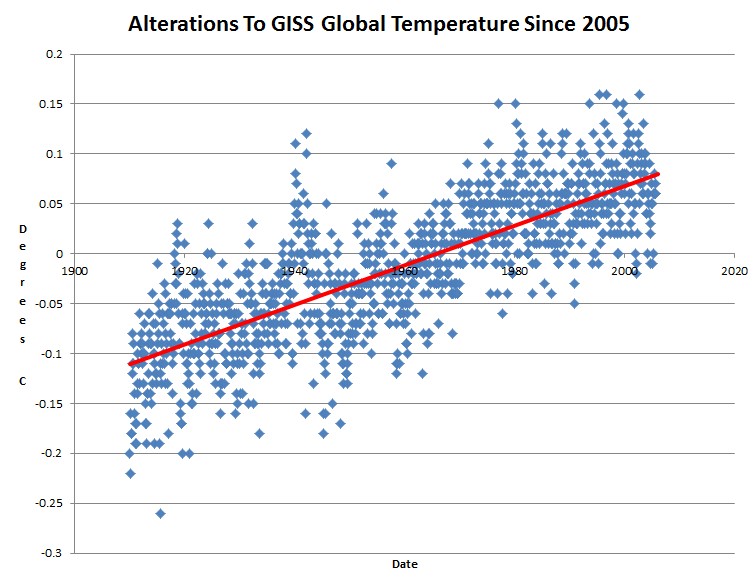
The next graph shows alterations to the data since 2005 – almost 0.2C.

ScreenHunter_79 Mar. 25 06.56

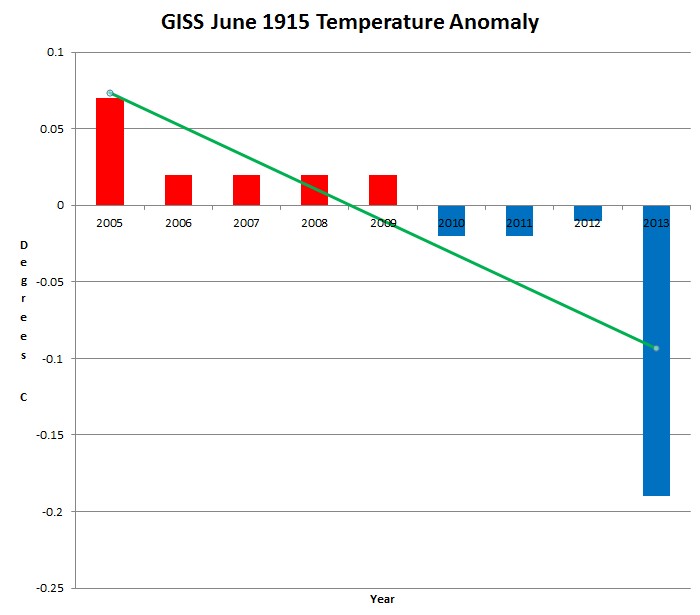
Hansen is trying to create the impression of warming by progressively cooling the past, and progressively warming the present. The graph below shows how he used to adjust June 1915 upwards by 0.07C, but now he adjusts it downwards by 0.19C. Since 2005, he has progressively altered the June 1915 temperature by more than 0.25 degrees.

ScreenHunter_85 Mar. 25 07.20

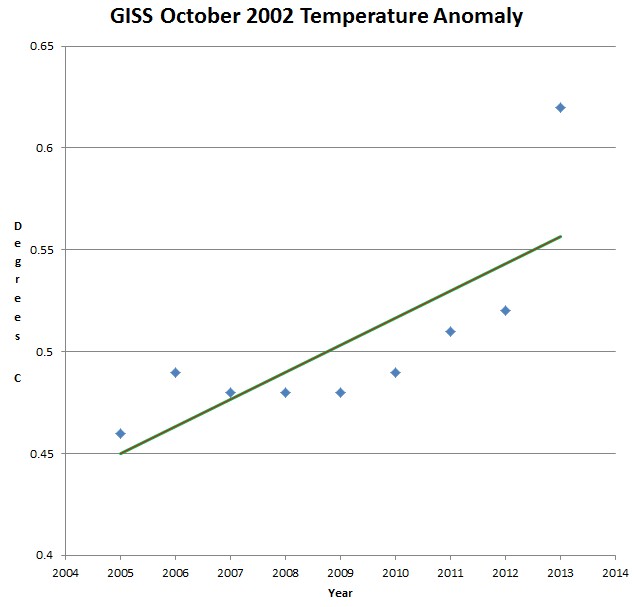
The next graph shows how Hansen has progressively warmed October 2002 in successive versions of the GISS data. In 2005 he showed the anomaly at 0.46C, and now he shows it at 0.6C. There have been five upwards data tampering events since 2005.

ScreenHunter_86 Mar. 25 07.24

It seems safe to assume that there was additional data tampering going on prior to 2005, but we can see that about 30% of current warming is due to post 2005 data tampering by NASA’s James Hansen.

Posted in Uncategorized | 17 Comments

How Cold Will March Be?

Much of the the Northern Hemisphere has been getting pummeled with near record cold during March. It seems likely that satellite temperatures for the month will take another huge plunge, like they did last month.

Posted in Uncategorized | 19 Comments