In 1999, NASA published this graph of US temperatures, which showed a seventy year cooling trend – with 1934 as the hottest year and 1998 almost 0.6C cooler.
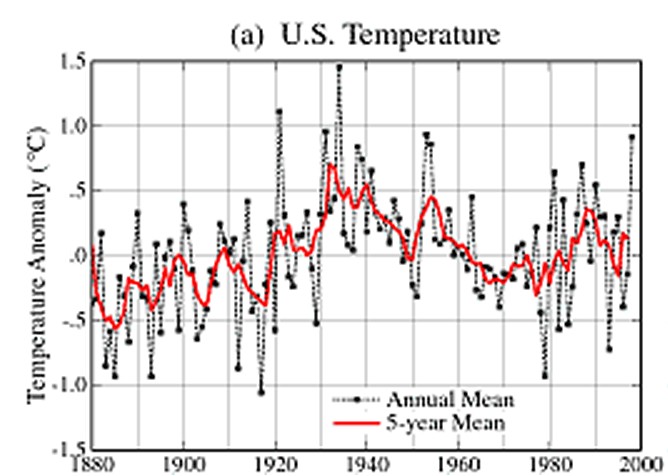
NASA GISS: Science Briefs: Whither U.S. Climate?
Current NOAA graphs look very different, with no cooling trend – and 1998 hotter than 1934.
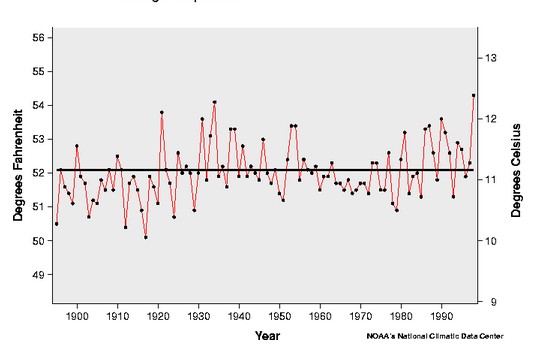
CONTIGUOUS UNITED STATES Climate Summary
NOAA achieved this by tampering with the data. The graph below quantifies the tampering which has gone on since 1999.
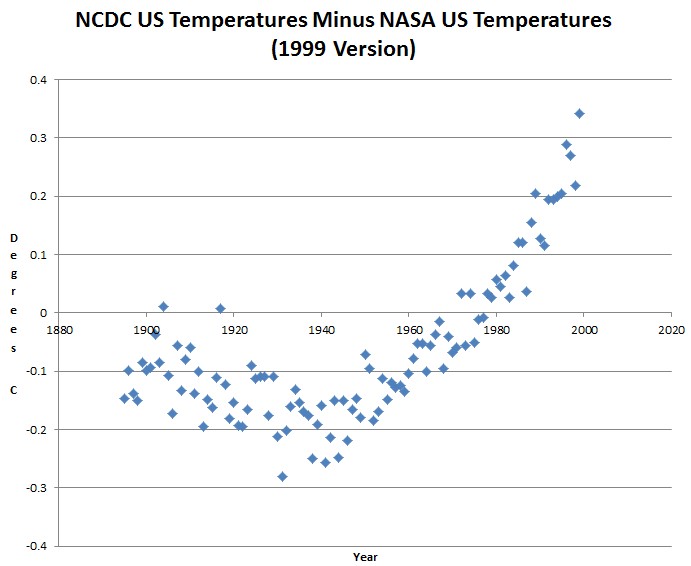
They cooled the 1930s by almost 0.2C, and since 1940 they have been exponentially increasing the tampering – in an obscene hockey stick of scientific fraud.
It is bad enough that they do it, but even worse is that they do not tell the press that they have altered the data. There should be a disclaimer with every NOAA press release saying
US thermometer data shows no warming. The warming trends we are showing you were generated by global warming activists who have infiltrated NOAA and destroyed any hope of honest science.