USHCN has been having to cheat harder and harder every month to create the false impression that the US is warming.
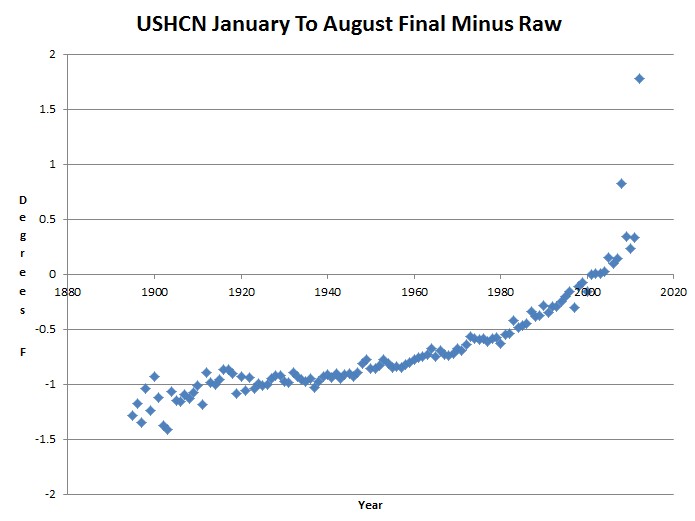
Index of /pub/data/ushcn/v2/monthly
They announced last week a new USHCN 2.5 version, which I predicted would introduce a new cheat.
USHCN deleted their monthly data last week, and apparently are making a transition from version 2.0 to 2.5. My guess about this surprise move is that they are going to make past “raw” data colder, and current “raw” data warmer. This will make their massive adjustments appear smaller.
It will be easy enough to test this, as I have local copies of their old raw data, and will be able to do a direct comparison.
My USHCN 2.5 Forecast | Real Science
They put the USHCN 2.5 data out yesterday, and cheated exactly as I expected – with recent raw temperatures bumped way up, and older temperatures lowered. This is calculated as the yearly average of all “raw average monthly” temperature data for all USHCN stations during all months. I assume a Monte Carlo distribution for missing data.
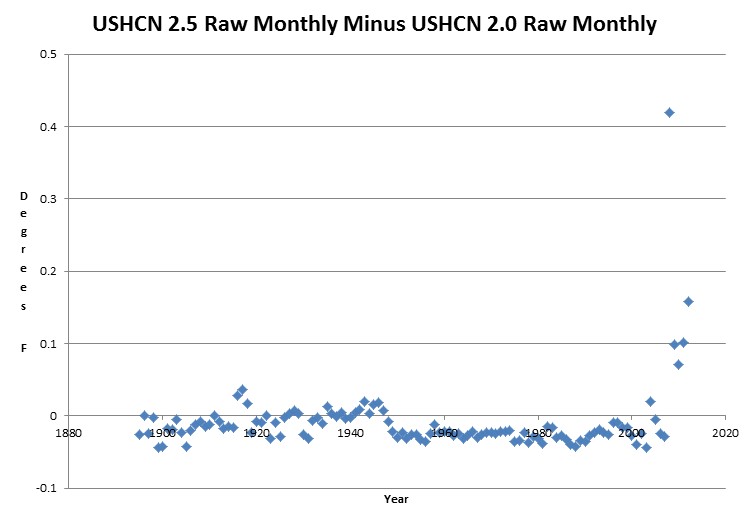
Index of /pub/data/ushcn/v2/monthly
Index of /pub/data/ushcn/v2.5/
But it is worse than it seems. There is an additional hidden cheat, because the monthly data is also adjusted upwards from the daily data – which shows a long-term cooling trend in the US.
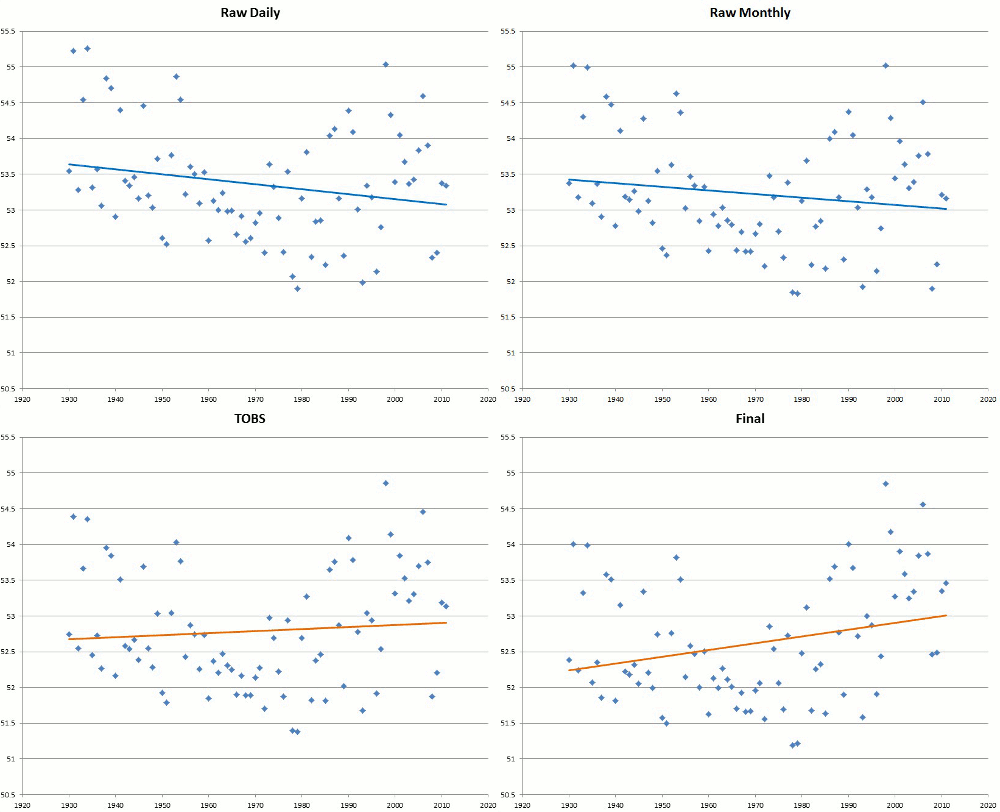
Even after UHI effects, the US is cooling since 1895.