
Hurricanes used to hit Florida about once a year. Now they average about one every other year.
The current stretch of seven hurricane free years is the longest on record.
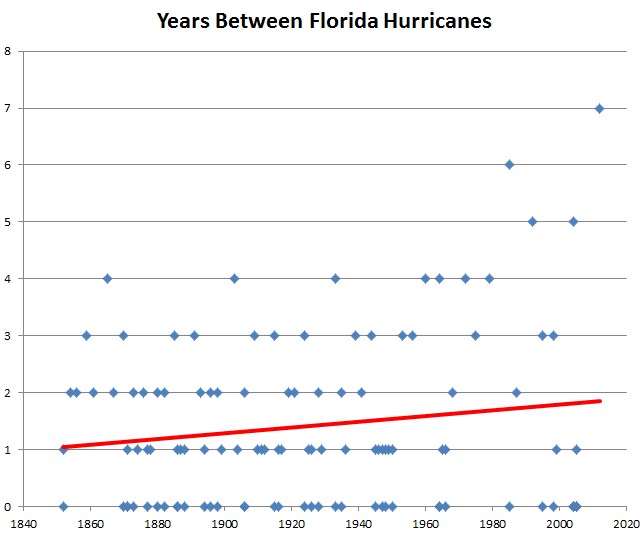
Hurricanes used to hit Florida about once a year. Now they average about one every other year.
The current stretch of seven hurricane free years is the longest on record.
USHCN is increasing their upwards adjustments exponentially every year. They have no checks and balances, and will continue to cheat at a faster and faster rate for as long as they can get away with it.
There is not even any theoretical basis for what they are doing since 1990. They do it because they know they can.
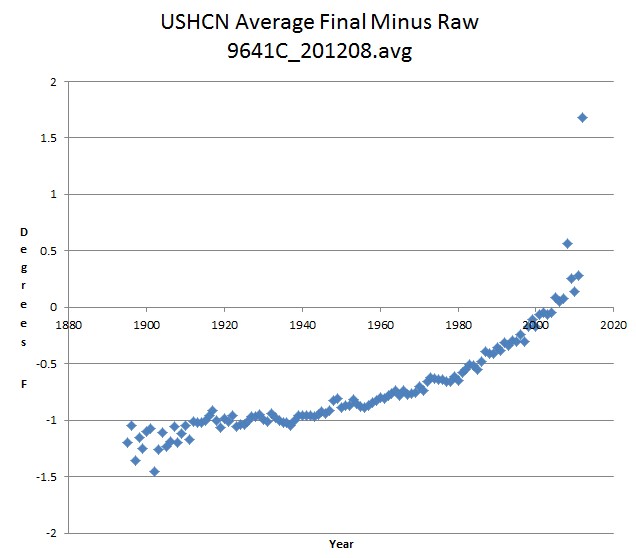
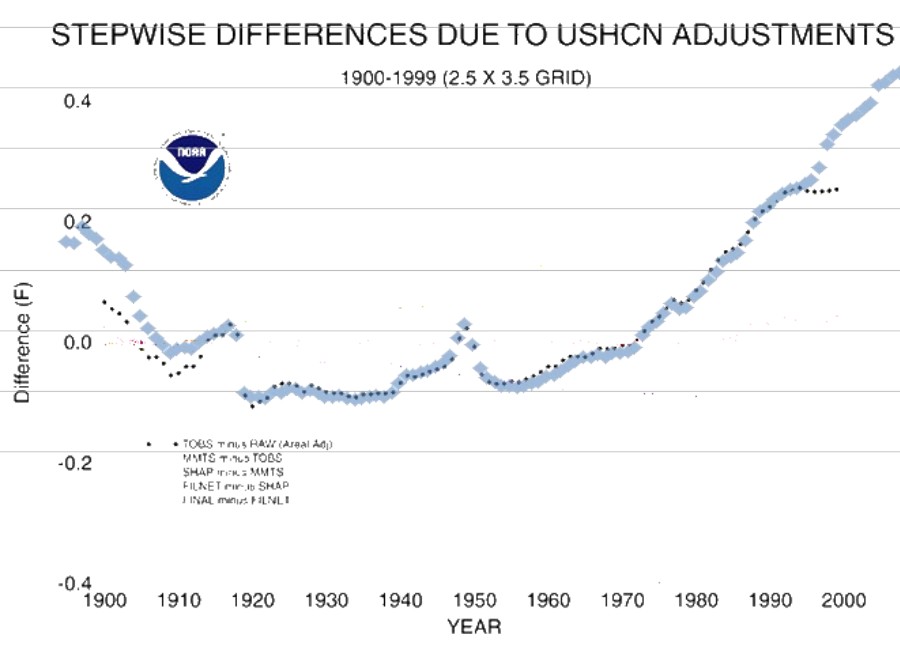
USHCN says that they tamper with data this much
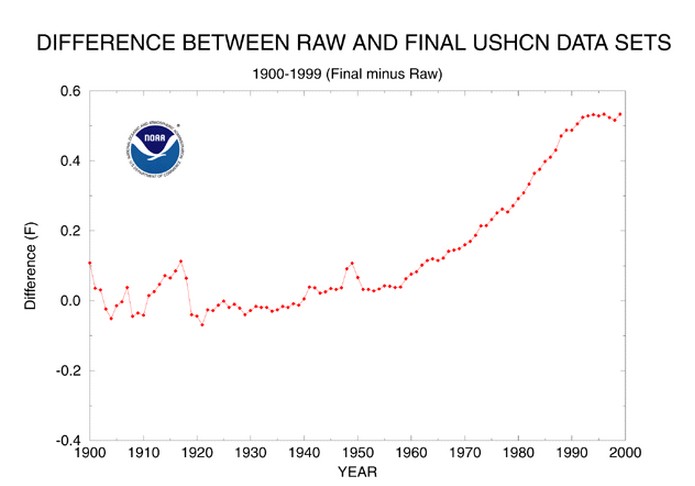
ts.ushcn_anom25_diffs_urb-raw_pg.gif (650×502)
In reality, they do vastly more data tampering than they admit. The graph below overlays the graph above on the current final monthly minus raw.
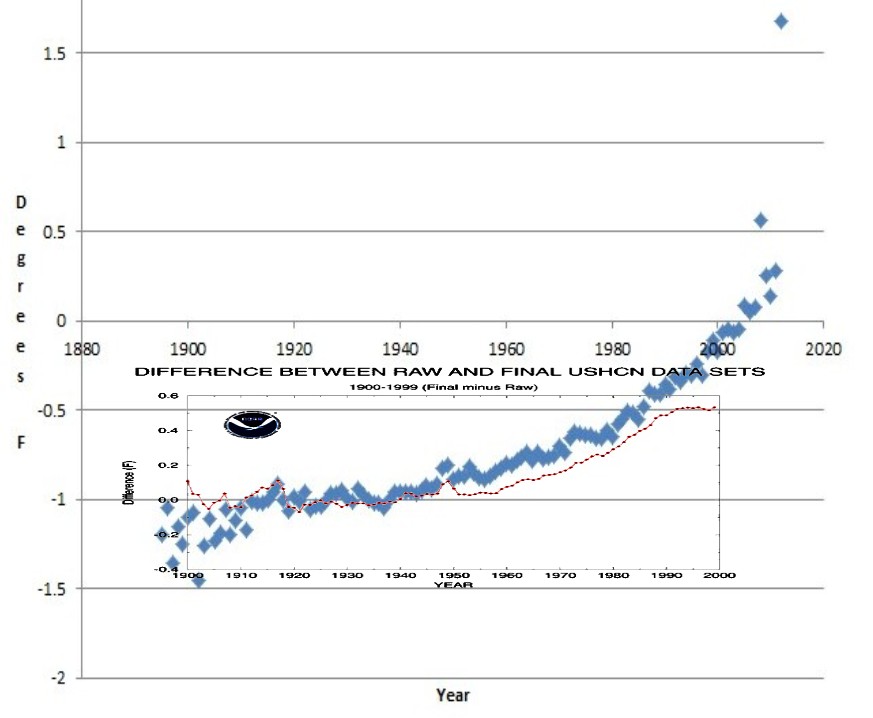
It gets worse though, the final minus daily raw will be even larger than the monthly data. But most disturbing is the TOBS adjustment. According to Menne et al 2009, the TOBS adjustment hasn’t changed from USHCN 1, which showed no increase after 1990. yet now we see continuing TOBS adjustments (blue below) from 1990 to the present.
The 1990s station data hasn’t changed. The algorithm hasn’t changed. Why has the adjustment changed?
None of this makes any sense. They are adding to their adjustments for political reasons, not scientific ones.
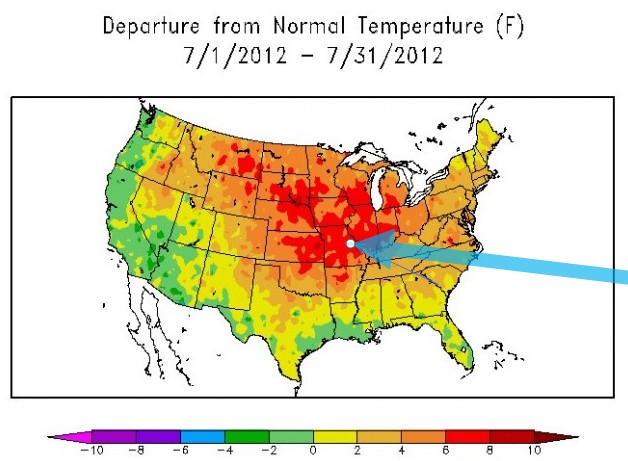
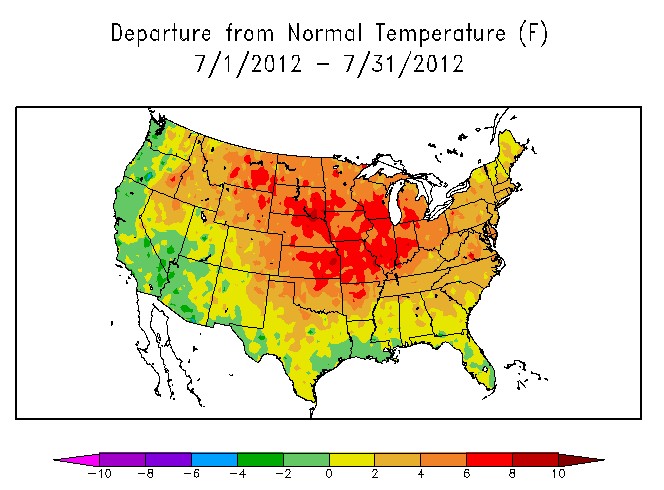
Warrenton, Missouri is located right at the hottest of the hot in July, 2012
Average temperatures in Warrenton during July were six degrees cooler than 1901, 1934 and 1936, and almost one degree cooler than 1954.
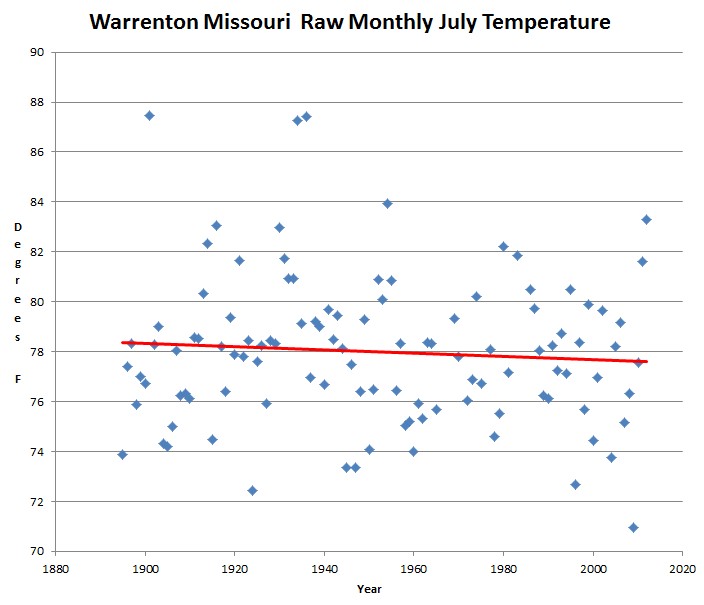
July 2012 wasn’t anywhere near as hot as July 1936.
USHCN has released their end of July temperatures data again, this time without 2008-2012 missing.
The graph below shows the difference between their reported and measured annual data. They are now upwards adjusting 2012 by a world and olympic record 3.13 degrees. This is similar to beating the four minute mile for the first time.
And to make it even more exciting, they have been upwards adjusting later dates relative to earlier dates for 1404 months in a row. The odds against that happening through legitimate science are an astonishing 2^1404 to one.
Anyone who believes that the adjustments shown above are honest objective science, should go purchase the Brooklyn Bridge immediately.
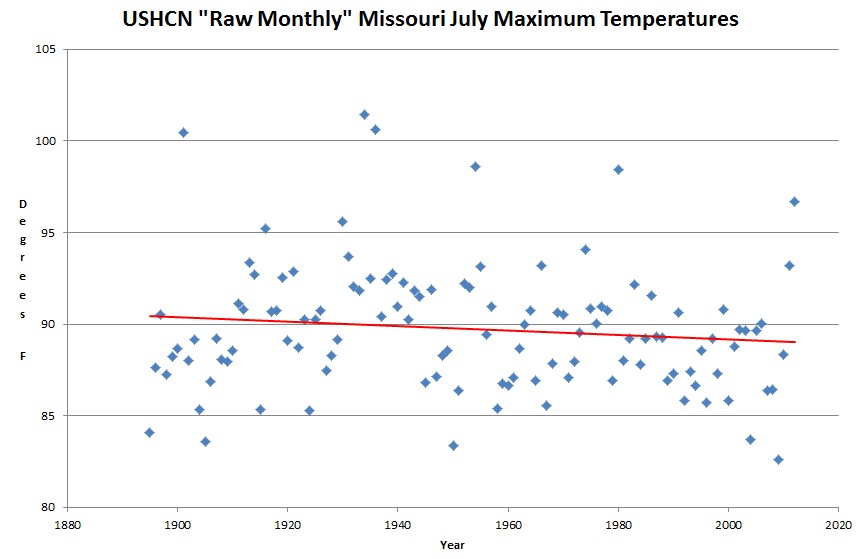
Missouri was the most anomalously hot state in July, yet measured maximum temperatures were only sixth hottest on record – five degrees cooler than 1934.
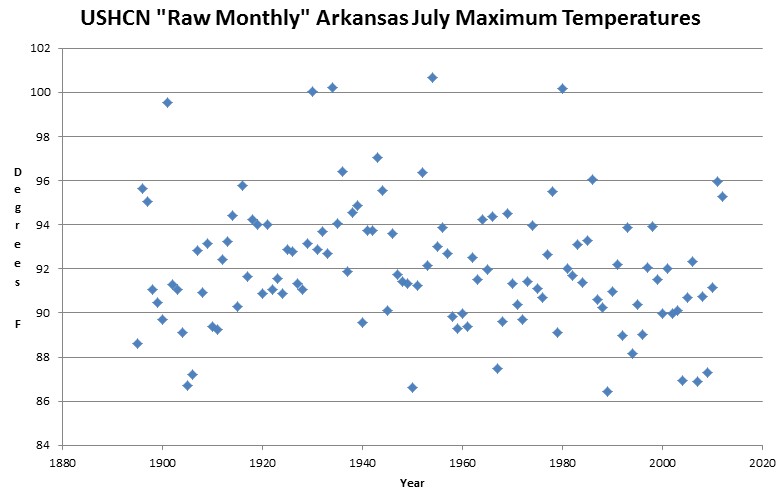
Arkansas was ground zero for the July 2012 “record” heatwave, yet high temperatures were only the 15th hottest.
NOAA’s claim that July was the hottest on record in the US is based on tampered data and is simply not true.
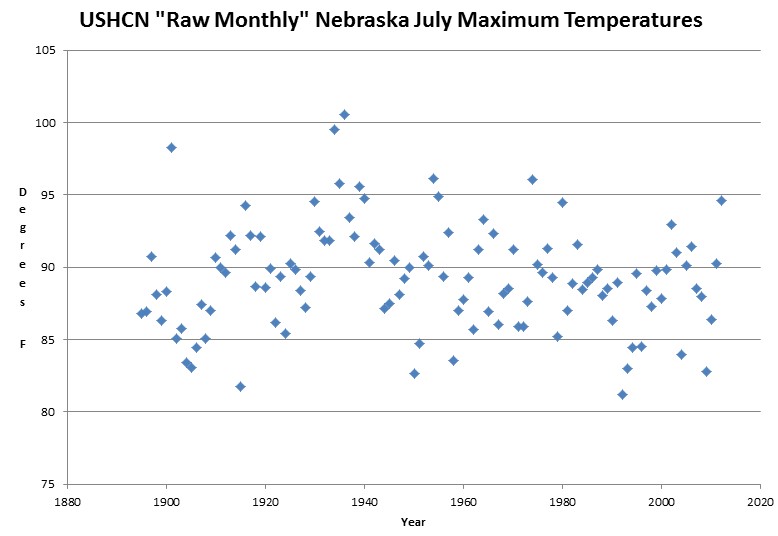
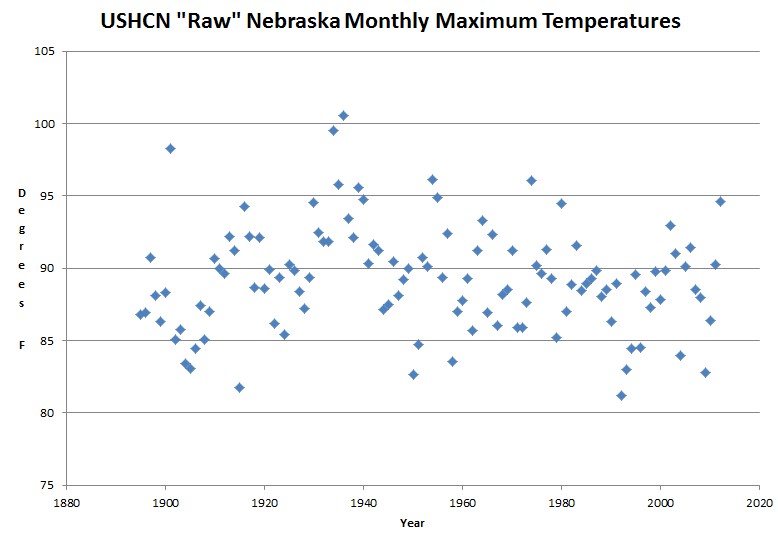
July maximum temperatures averaged six degrees cooler than July, 1936 in Nebraska
July average tops U.S. temperature record, NOAA says
The July heat wave that wilted crops, shriveled rivers and fueled wildfires officially went into the books Wednesday as the hottest single month on record for the continental United States.The average temperature across the Lower 48 was 77.6 degrees Fahrenheit, 3.3 degrees above the 20th-century average, the National Oceanographic and Atmospheric Administration reported. That edged out the previous high mark, set in 1936, by two-tenths of a degree, NOAA said.
U.S. forecasters started keeping records in 1895. The seven months of 2012 to date are the warmest of any year on record and were drier than average as well, NOAA said.
July average tops U.S. temperature record, NOAA says – This Just In – CNN.com Blogs
Complete nonsense. July 1936 was much hotter. Compare the two maps below – it isn’t even close.
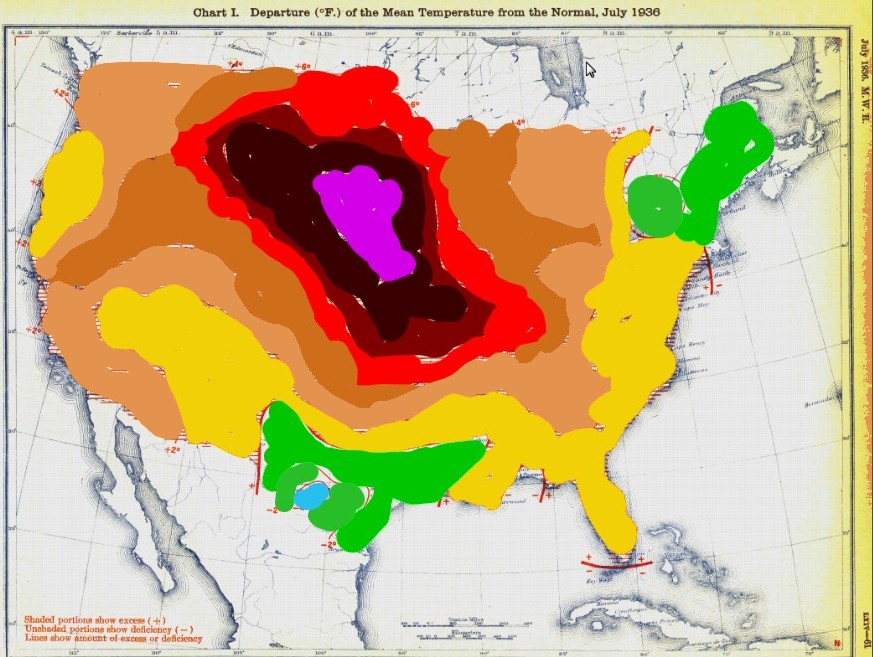
docs.lib.noaa.gov/rescue/mwr/064/mwr-064-07-c1.pdf
The two maps don’t have the same baseline. We know that the second map has a 1981-2010 baseline, which averaged 74.4 degrees. If we guess 1900-1935 for the first map, the baseline was slightly higher at 74.5 degrees. That makes the fraud even worse.


