
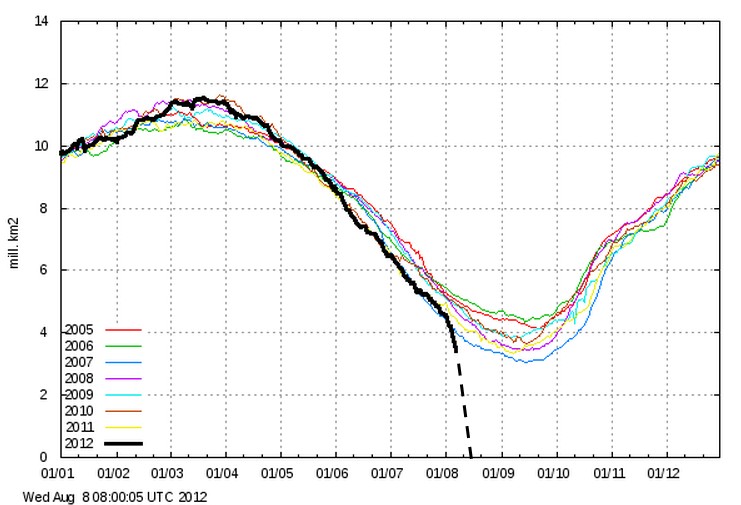
Looks like Zwally was right! All of the ice will be gone in about a week.
COI | Centre for Ocean and Ice | Danmarks Meteorologiske Institut
Looks like Zwally was right! All of the ice will be gone in about a week.
COI | Centre for Ocean and Ice | Danmarks Meteorologiske Institut
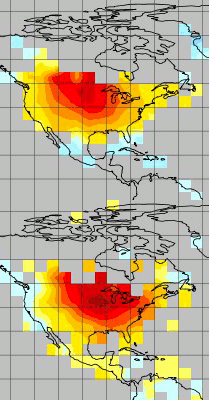
NOAA claims that the extremely nice weather of March 2012 couldn’t have happened without global warming.
The blink comparator above flashes between March 2012 and March 1910. You can tell which is which, because March 1910 was above normal over the entire country – whereas March 2012 was below normal on the west coast.
The percentage of the earth’s land surface covered by extreme heat in the summer has soared in recent decades, from less than 1 percent in the years before 1980 to as much as 13 percent in recent years, according to a new scientific paper.
Extreme Heat Is Covering More of the Earth, a Study Says – NYTimes.com
The map below is the heatwave of July, 1936 – which was the hottest month in US history. It was almost as hot in Russia, and much above normal over much of the rest of the planet.
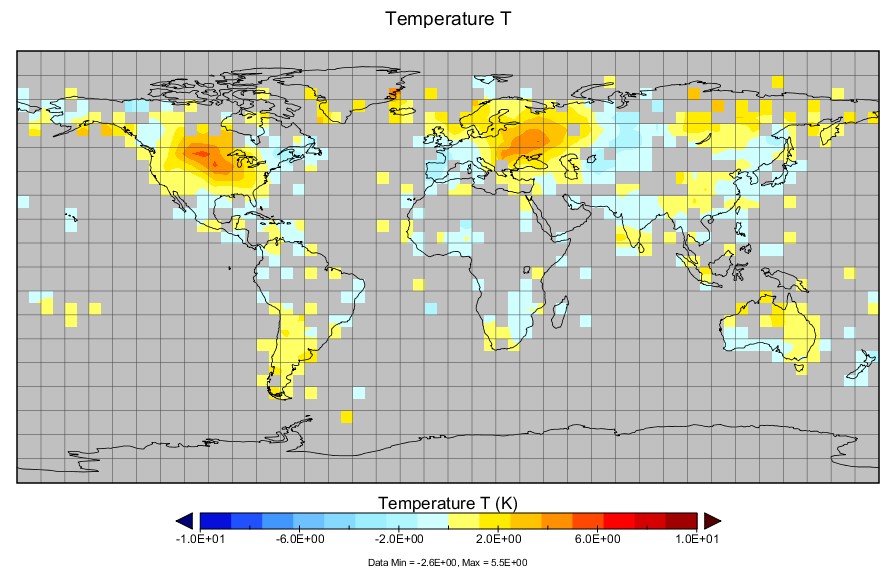
Hansen has absolutely no idea what he is talking about, which is why he is well suited to be a spokesman for the Obama administration.
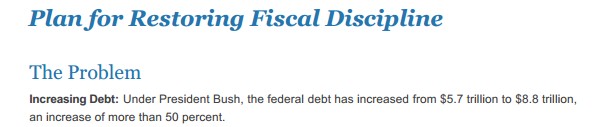
This is what the felon in chief promised four years ago.


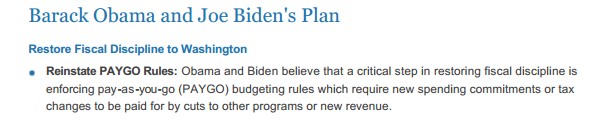

moveleft.org/obamas_promises/www-barackobama-com_issues_fiscal.pdf
Obama complained that the debt increased by 50% under Bush to $8.8 billion, over eight years. Then Obama increased the debt by almost 100% in just four years.

Did Obama burn his brain out on cocaine in college?
There are three million millionaires in the US. In order to raise $4 trillion, he would have to take $1.3 million from each millionaire. Tax rates over 100% might not be considered sound policy, unless he wants to drive unemployment up over 80%.
Besides which, the deficit is $1.1 trillion. How can you lower it by $4 trillion?
Whatever he was doing in college did not involve math or economics. Apparently he majored in Trotsky emulation.
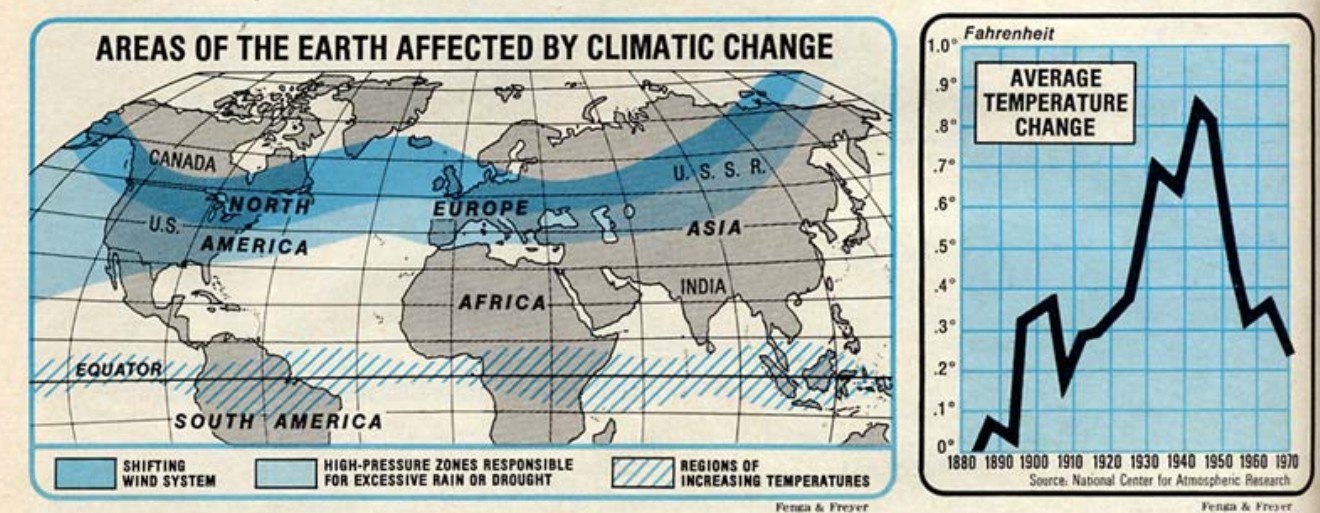
Meteorologists think that they can forecast the short-term results of the return to the norm of the last century. They begin by noting the slight drop in overall temperature that produces large numbers of pressure centers in the upper atmosphere. These break up the smooth flow of westerly winds over temperate areas. The stagnant air produced in this way causes an increase in extremes of local weather such as droughts, floods, extended dry spells, long freezes, delayed monsoons and even local temperature increases – all of which have a direct impact on food supplies.
USHCN makes a huge TOBS adjustment in Ohio between 1979 and 1988, as seen below.
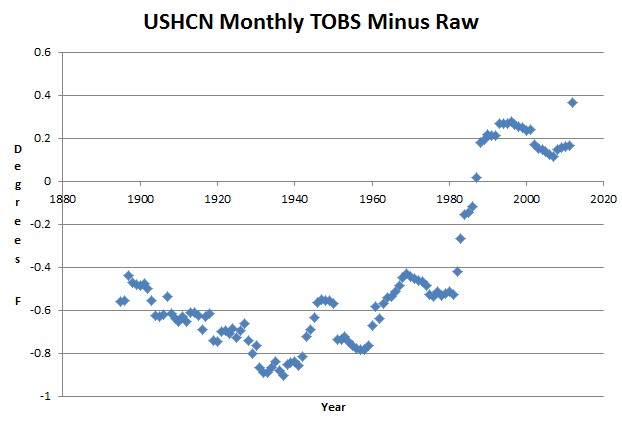
The justification for this is that they claim people in Ohio switched from reading temperatures in the afternoon, to reading them in the morning. That would theoretically push measured temperatures progressively down from 1979 to 1988.
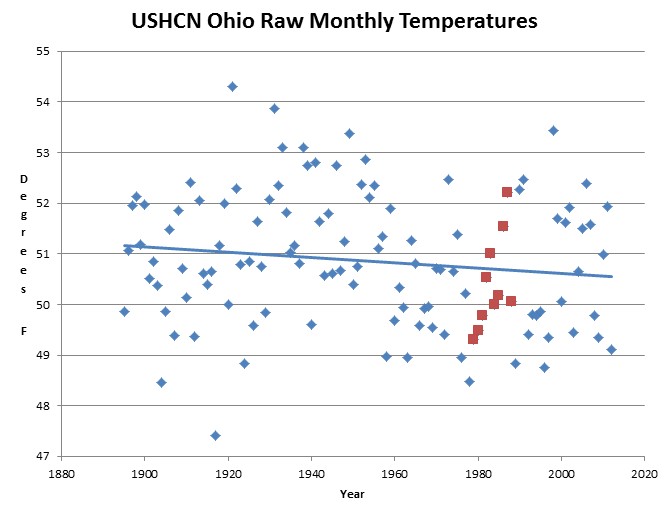
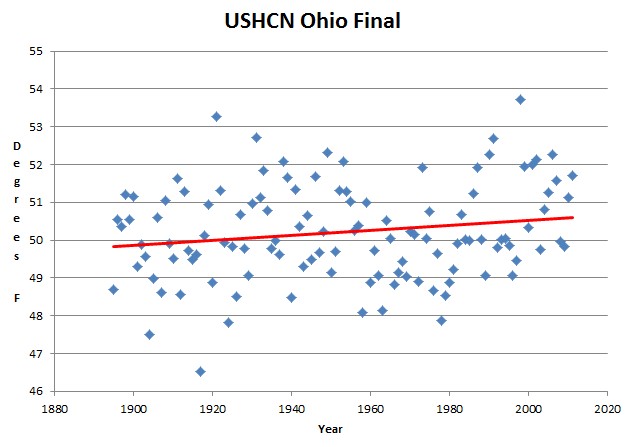
The Ohio raw data does not provide any support for the TOBS theory. In the middle of a long term cooling trend, measured temperatures rose very quickly from 1979 to 1988 – shown in red below. In fact, the thermometers reported the steepest temperature rise in Ohio history.
But it gets worse. The final adjustments are almost three degrees
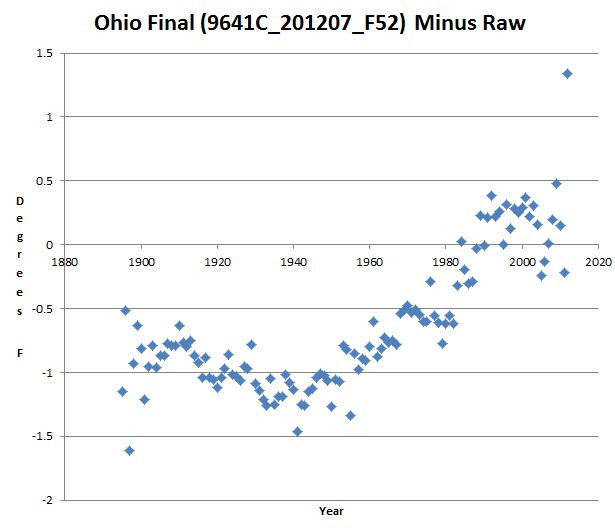
By the time USHCN is done adjusting, they have created a warming trend – which 127 years of Ohio thermometers never saw.
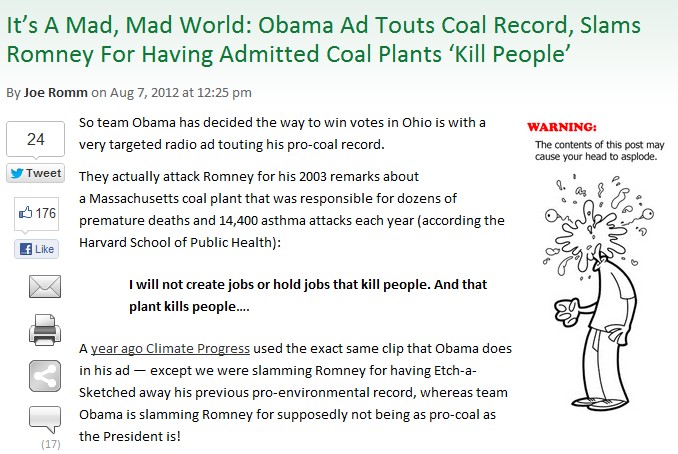
In 2008 he promised to bankrupt the coal industry
[youtube=http://www.youtube.com/watch?v=2cKCXow-F74]
.
Now he needs votes in Ohio and is accusing Romney of being anti-coal industry.
30 July 2012
A new scientific study indicates the turn-of-the-century drought in the North American West was the worst of the last millennium—with major impacts to the carbon cycle and hints of even drier times ahead.
The study, titled “Reduction in carbon uptake during turn of the century drought in western North America,” indicates that the major drought that struck western North America from 2000 to 2004 severely reduced carbon uptake and stressed the region’s water resources, with significant declines in river flows and crop yields. It was published on July 29 in Nature-Geoscience. NSIDC scientist Kevin Schaefer is a co-author on the study, along with Christopher Williams of Clark University. The study was led by Christopher Schwalm of Northern Arizona University (NAU).
Researchers found that the turn-of-the-century drought was the most severe region-wide event of its kind since the last mega drought 800 years ago. “The turn-of-the-century drought may be the wetter end of a new climatology that would make the 21st century climate like mega-droughts of the last millennium,” said Schwalm.
New facts from academia! Eight hundred years is a millennium, and a four year drought is as bad as the 75 year drought which wiped out the Anasazi in the 13th century.
The Arizona megadrought has brought 200% of normal precipitation this summer.
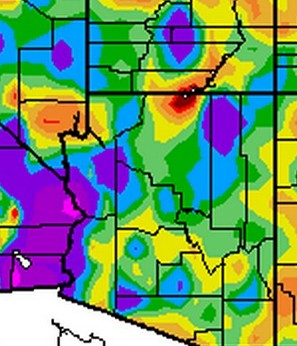
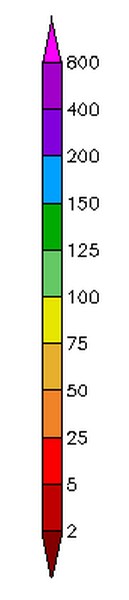
It is the La Nina, stu*id.
The graph below shows the almost two degree US upwards adjustment trend being applied by USHCN between the raw thermometer data and the published monthly data.
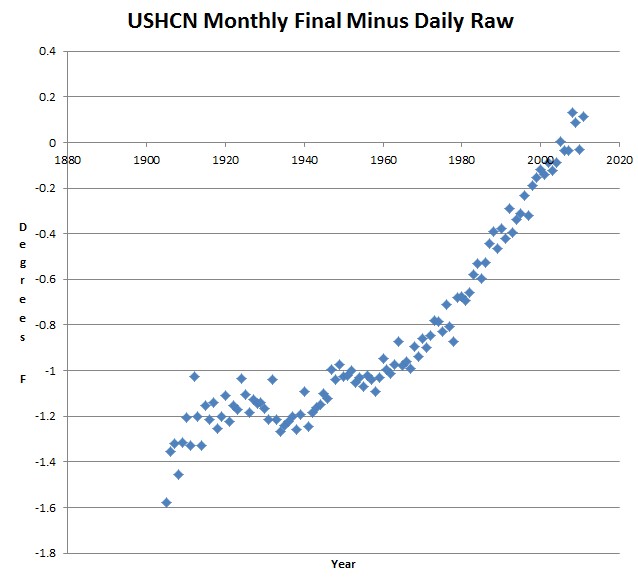
The adjustments they are making are greater than the claimed trend, meaning that all man made US warming is occurring inside ORNL and GISS computers.
There is no legitimate physical explanation would would explain such a regular trend in temperature bias – other than UHI, which has the opposite polarity.
In their literature, they document 0.5F worth of adjustments, not 1.8F . They are delivering data with more than 300% of the adjustments described in Menne et al.




