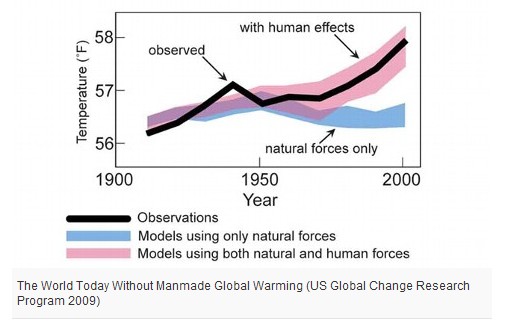
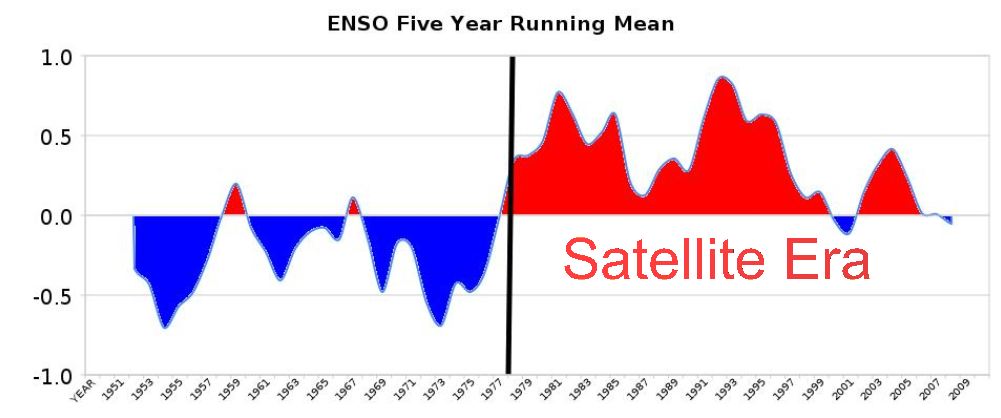
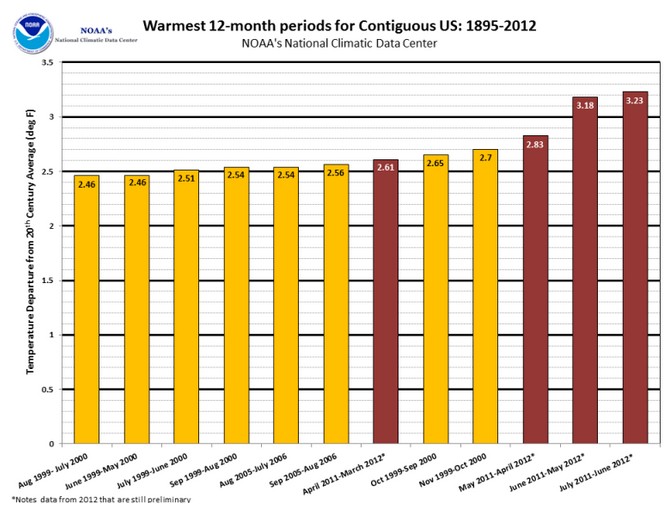
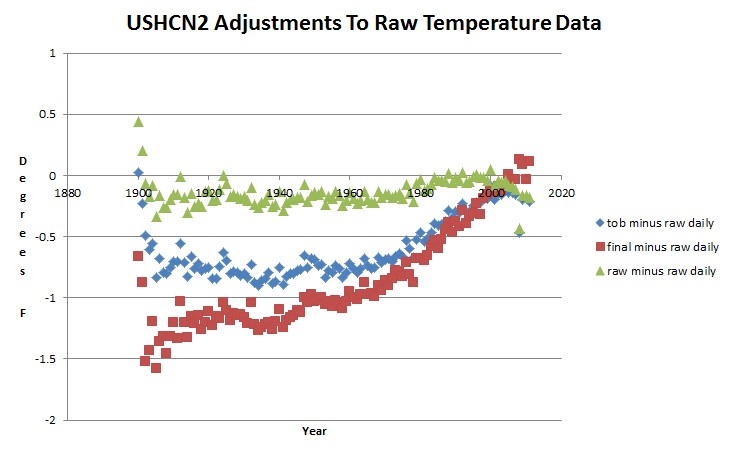
Bookmark this image. It is an important one.
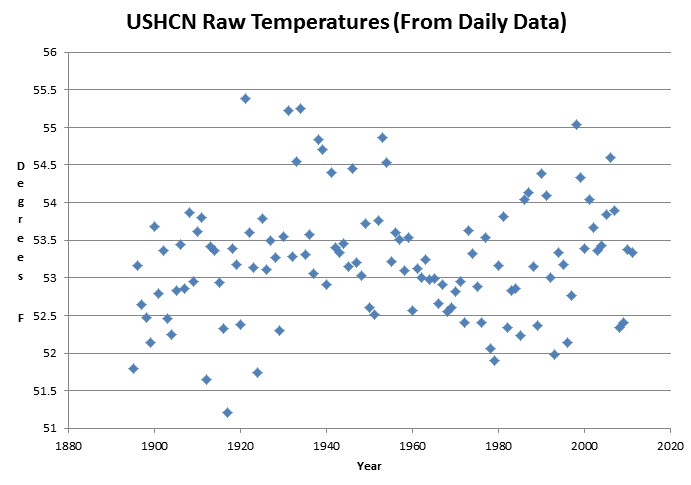
The animation below shows how USHCN turns a measured strong cooling trend since 1930, into a strong computer generated warming trend.
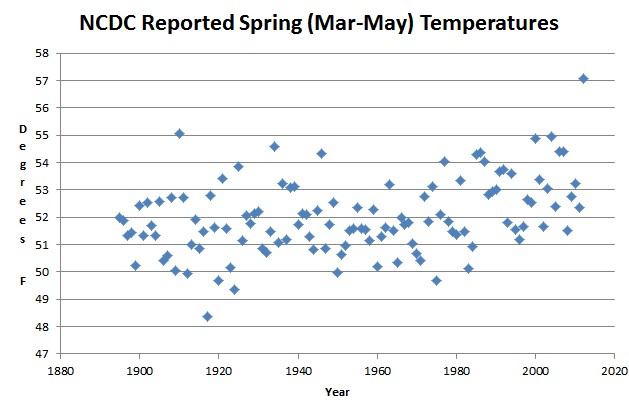
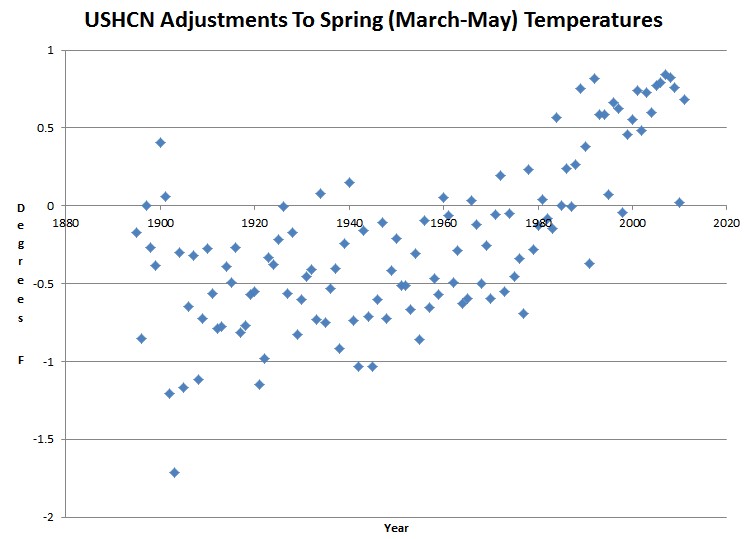
USHCN2 uses a three step process to cool the past and warm the present. Going from the actual measured daily data to “raw monthly” reduces the decline. The TOBS adjustment flips the trend from cooling to warming, and then a final mysterious adjustment creates a strong warming trend.
Whatever the final mysterious adjustment is, it has to include UHI – which would do the exact opposite of what we are seeing.
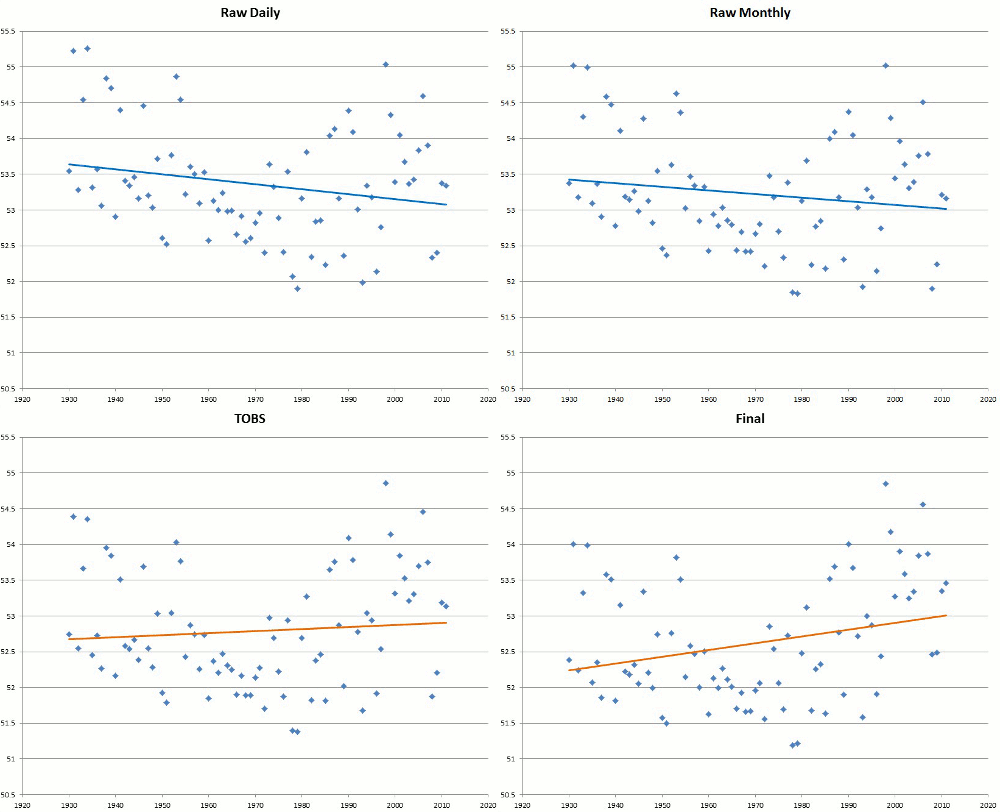
Watch those older temperatures plummet inside Tom Karl and James Hansen’s computer games, which are used to influence critical US government policy decisions.
They cool the 1930s by 1.3 degrees, and then claim that the past decade has been the warmest by a few tenths of a degree. Enron accountants would be proud of such fine data presentation.
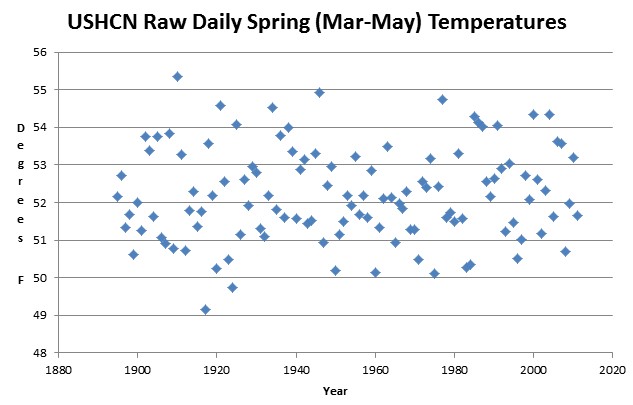
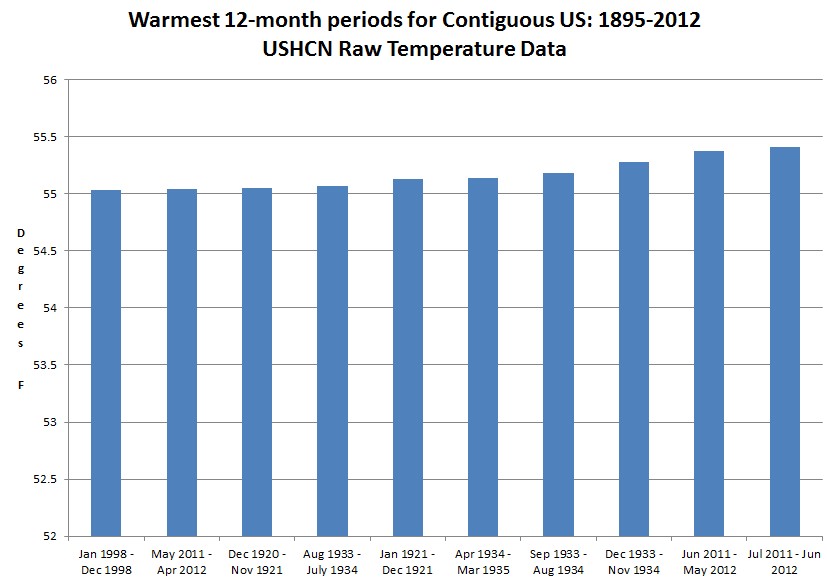
Here is the raw data :
Continue reading →