Oklahoma Was Much Hotter Below 350 ppm

Below are the high temperature records for July 13, at all Oklahoma USHCN stations which were operating in both 1930 and 2011. The year 1954 set the most records, and only one station managed to tie a record since the turn of the century. All but two of these records were set below 350 ppm CO2.

Our friends have been lying about evidence linking US heatwaves to CO2. The evidence simply does not exist. NCDC claims that July 2011 in Oklahoma was the hottest month in US history, but not a single record was set in Oklahoma on July 13, 2011.

Oklahoma
ADA                           7/13 107 : 1954
ALTUS IRIG RSCH STN           7/13 109 : 1923, 1936, 1954, 1998
ANTLERS                       7/13 107 : 1930
ARDMORE                       7/13 107 : 1909, 1917, 1930
BARTLESVILLE MUNI AP          7/13 113 : 1954
BEAVER                        7/13 109 : 1954
BOISE CITY 2 E                7/13 108 : 1913
BUFFALO 2 SSW                 7/13 110 : 1954, 1971
CHEROKEE                      7/13 113 : 1917
CLAREMORE 2 ENE               7/13 112 : 1901, 1954
DURANT                        7/13 108 : 1980
ENID                          7/13 112 : 1917
ERICK                         7/13 110 : 1954, 2001
GEARY                         7/13 112 : 1954
GOODWELL RSCH STN             7/13 108 : 1913
GUTHRIE 5S                    7/13 110 : 1917, 1954
HENNESSEY 4 ESE               7/13 112 : 1954
HOBART MUNI AP                7/13 111 : 1933
HOLDENVILLE 2SSE              7/13 108 : 1954
HOOKER                        7/13 108 : 1913
JEFFERSON                     7/13 114 : 1954
KINGFISHER                    7/13 113 : 1954
LAWTON                        7/13 109 : 1917
MANGUM                        7/13 111 : 1933
MEEKER 5 W                    7/13 110 : 1954
MIAMI                         7/13 115 : 1954
MUSKOGEE                      7/13 114 : 1954
MUTUAL                        7/13 114 : 1917
NEWKIRK 1NW                   7/13 114 : 1954
OKEENE                        7/13 112 : 1917
OKEMAH                        7/13 112 : 1954
OKMULGEE WTR WKS              7/13 109 : 1954
PAULS VALLEY 4 WSW            7/13 108 : 1954
PAWHUSKA                      7/13 112 : 1954
PERRY                         7/13 111 : 1954
STILLWATER 2 W                7/13 112 : 1954
WEATHERFORD                   7/13 110 : 1917

July 14 was the same story
Continue reading →

Posted in Uncategorized | Leave a comment

Aggie Joke : Antarctica Threatened By Global Warming

Having just passed the one year anniversary of the Dessler permanent Texas drought, another Aggie throws his hat in the ring.

Washington, July 13 (ANI): An international team of researchers has warned that the continent of Antarctica is at risk from human activities and other forces, and suggested environmental management is needed to protect the planet’s last great wilderness area.

Texas A and M University oceanographer Mahlon “Chuck” Kennicutt II, who was included in team, said Antarctica faces growing threats from global warming, loss of sea ice and landed ice, increased tourism, over-fishing in the region, pollution and invasive species creeping into the area.

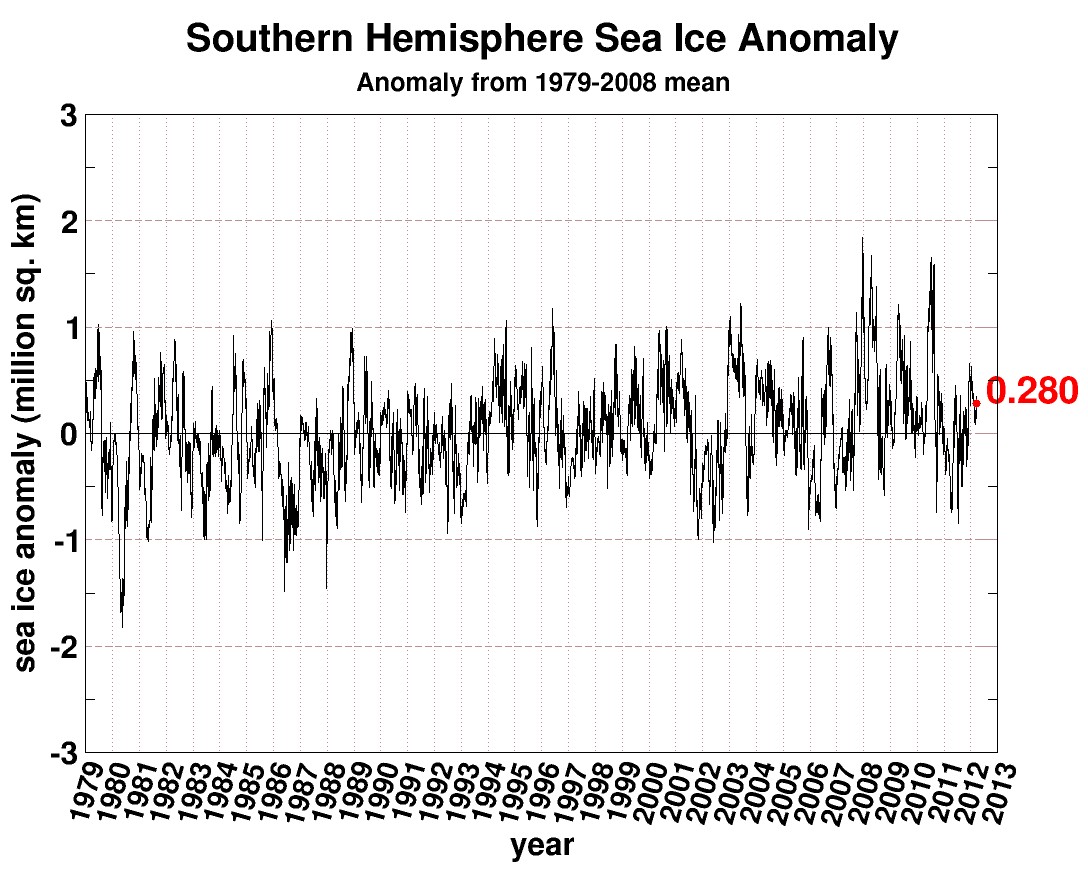
Antarctica faces growing threats from global warming and human activities

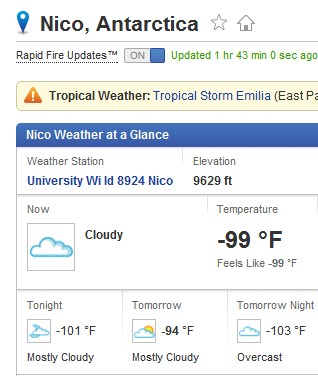
Weather Forecast Nico, Antarctica | Nico Weather | Wunderground

seaice.anomaly.antarctic.png (1122×912)

Posted in Uncategorized | 9 Comments

NCDC : June 2012 Was 15th Hottest In US History

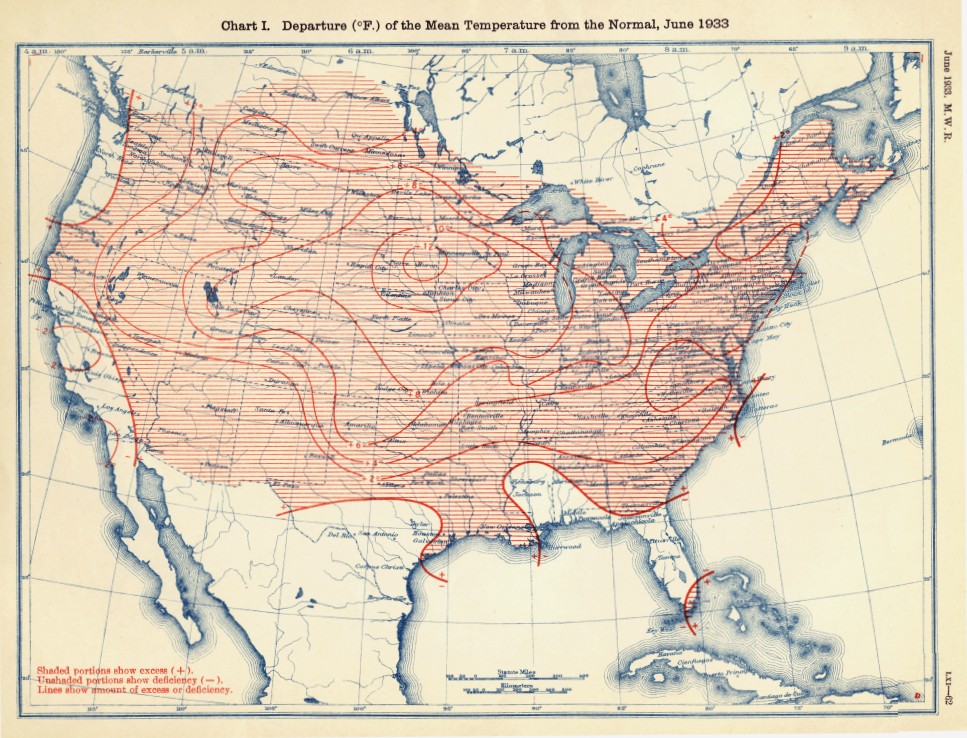
The official numbers are out from NCDC, and it turns out that the record hot June of 2012 was cooler than 1933, 1918, 1952, 1931, 1934, 1911 1936. and a number of other years.

And this was after they adjusted the temperatures upwards by more than a degree!

http://www.ncdc.noaa.gov/oa/climate/research/cag3/na.html

The hottest June in US History was 1933. Temperatures on the South Dakota/Minnesota border were 12 degrees above normal. The 1930s is what global warming looked like

docs.lib.noaa.gov/rescue/mwr/061/mwr-061-06-c1.pdf

Posted in Uncategorized | 39 Comments

Condi For VP

Romney picking Condoleeza Rice for VP would be a brilliant move.

It would defuse Obama’s race and gay baiting rhetoric, and force Obama to talk about the complete crap job he has done as interloper in chief. Condi is also very bright, unlike the current  #2 clown. Besides, she is from Colorado.

Kudos to Mitt for having the courage to win the election.

Posted in Uncategorized | 33 Comments

How The Hockey Stick Works

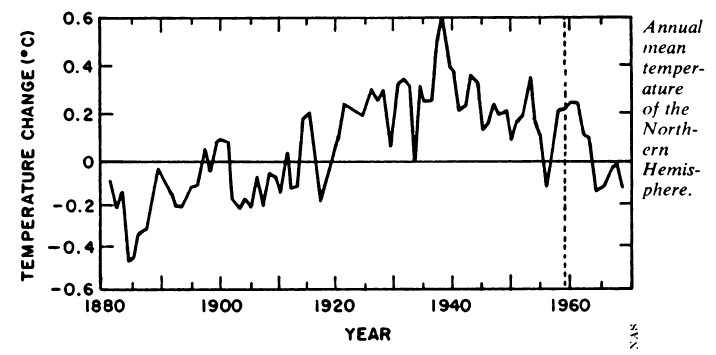
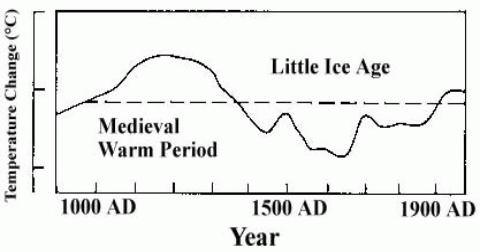
Like Briffa’s trees, the National Academy Of Sciences 1975 report showed that temperatures were plummeting since 1940.

www.sciencenews.org/view/download/id/37739/name/CHILLING_POSSIBILITIES

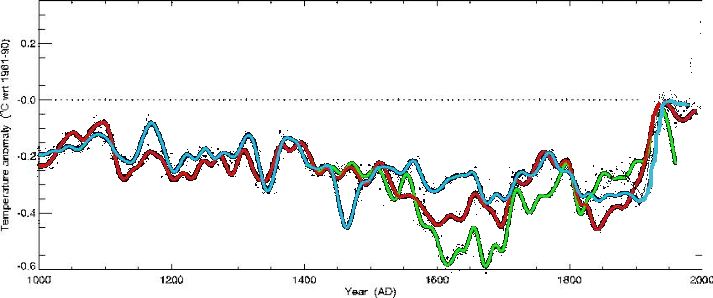
Briffa’s trees in green below.

The 1990 IPCC report showed that temperatures were warmer during the MWP, and had been flat since 1940.

Even Hansen said in 1999 that there wasn’t much going on.

Empirical evidence does not lend much support to the notion that climate is headed precipitately toward more extreme heat and drought.

NASA GISS: Science Briefs: Whither U.S. Climate?

But the year 2000 breathed new life into the global warming charlatans. Hansen adjusted the temperatures upwards, and then Mann overwrote the tree ring data with Hansen’s phony temperatures.

After obliterating the temperature record and all sense of scientific integrity, they went on a speaking tour. And it was bad.

Posted in Uncategorized | 3 Comments

New Study : 97% Of People Want To Keep Their Jobs

A new study has shown conclusively that 97% of people who make their living studying global warming want to keep their jobs.

Posted in Uncategorized | Leave a comment

97% Of Scousers Believe That You Will Never Walk Alone

Where you stand depends on where you sit

[youtube=http://www.youtube.com/watch?v=Xfgqi-UahE8]

Posted in Uncategorized | 3 Comments

What A Bunch Of Crooks

NOAA adjusts temperatures upwards by 1.4F relative to 1940, and then has the audacity to announce every month that temperatures have been above normal for X months

Posted in Uncategorized | Leave a comment

Another Smoking GISS/USHCN Nuke

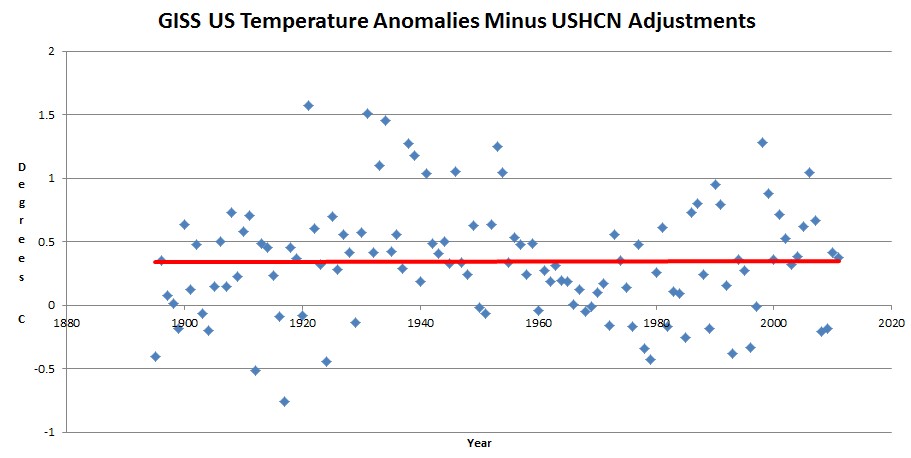
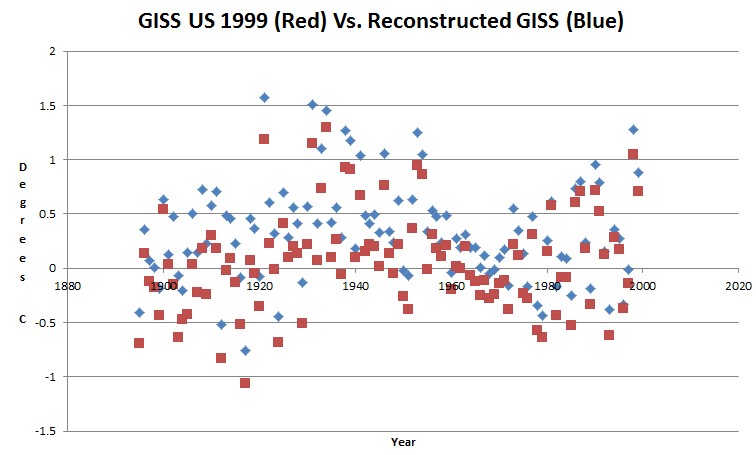
In my previous GISS/USHCN post I reconstructed what current GISS US should look like by calculating the USHCN yearly adjustments and subtracting them from the current GISS data. I came up with this.

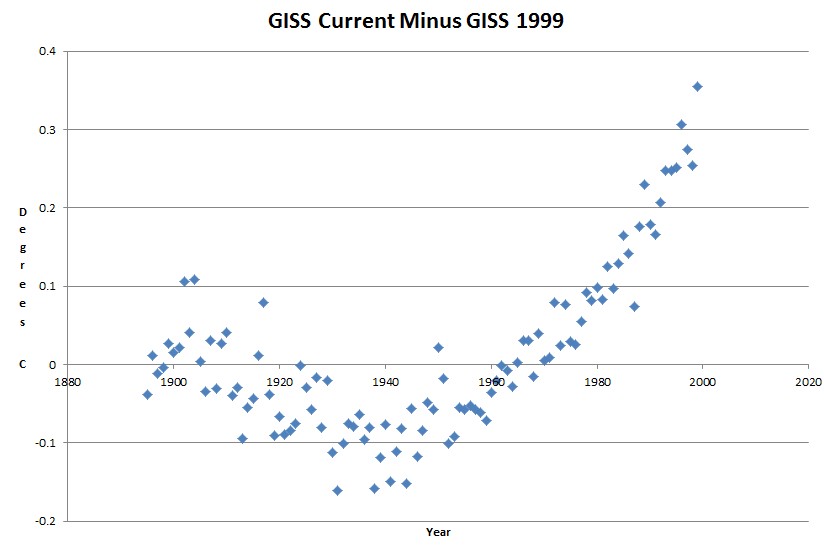
Then I remembered that John Daly saved off a version of GISS US temperatures in 1999.

The graph below plots 1999 GISS  and my reconstructed GISS

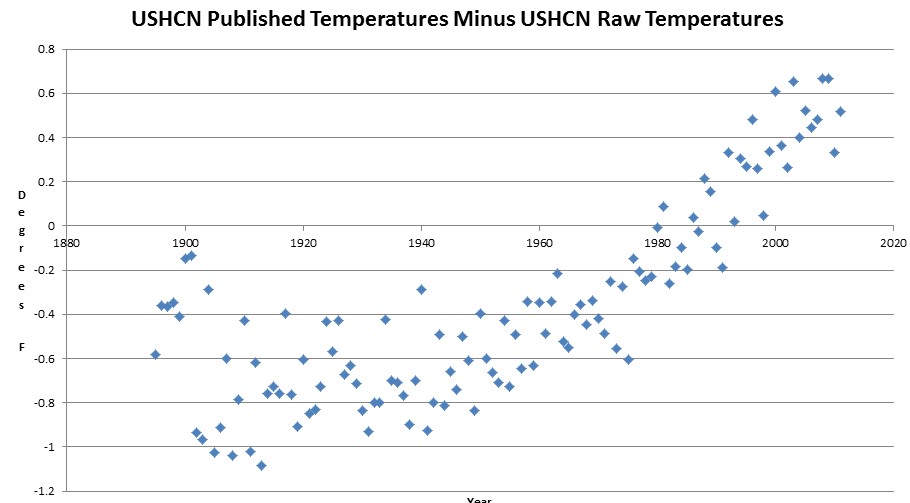
Bingo, we have a pretty good match!. This proves that the post 2000 USHCN adjustments are much larger (more than 200%) than they are publishing. Game over. They show 0.5F, when the real adjustments are closer to 1.2F

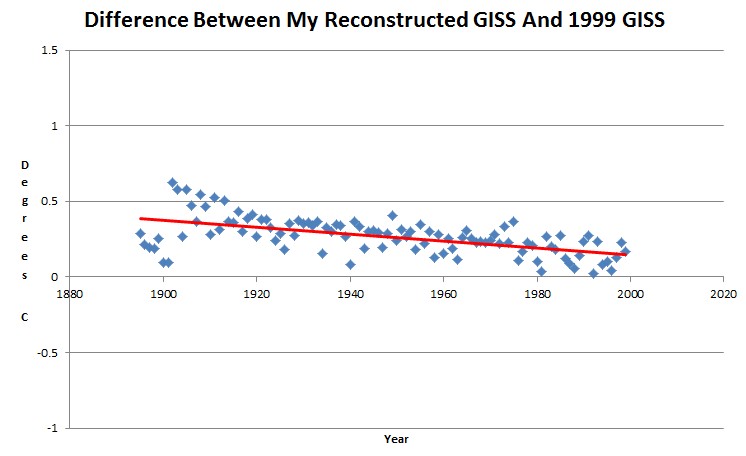
The graph below shows the difference between my GISS reconstruction and the 1999 published data. You can see that they were already cooling the past in 1999

But nothing like they are now!

Posted in Uncategorized | 11 Comments

USHCN Code Released

My USHCN code is available here as a zip file.

Once you unzip it you will see these files.

Main.cpp  Makefile  USHCN.cpp  USHCN.exe  USHCN.h

USHCN.exe is a Windows executable. Makefile is a Gnu makefile. If you aren’t a C++/STL programmer, you will probably have a difficult time understanding how it works.

In order to run it, you will need two files in the same directory as the executable.

http://cdiac.ornl.gov/ftp/ushcn_daily/ushcn-stations.txt

and any one of the the data files below. You will have to unzip the data file after you download it using gunzip.

Usage is : ushcn.exe USHCN_DATA_FILE_NAME [month=0-12] [max] [min]

Examples. Open up a command prompt window. Navigate to the directory with USHCN.exe, ushcn-stations.txt, and state41_TX.txt

ushcn.exe state41_TX.txt  > Texas.csv   – dumps out csv information for Texas to file Texas.csv

ushcn.exe state08_FL.txt  month=5 max > Florida_May_Max.csv   – dumps out csv information for Florida May maximum temperatures

ushcn.exe us.txt > US.csv – dumps out all US information

The code makes no attempt to do any adjustments or corrections. All it does is find all valid temperature recordings for all stations on all days, calculates averages – and finds min/max records per day of year for each station. There is no time bias. Earlier years are neither favored nor disadvantaged.

The reason I don’t do any corrections is because I am assuming a Monte Carlo distribution of error, which is the normal way that real scientists handle large data sets. There is no valid reason to believe that a huge data set created by thousands of observers over 130 years would have any systematic time-dependent bias to it – other than UHI. People read thermometers the same way in 1980 as they did in 1934.

If you mess the code up, take responsibility for it and don’t try to blame your mistakes on me.

Continue reading →

Posted in Uncategorized | 11 Comments