CO2 : Drool CO2 : Drool

Pavlov’s Hogs

Dem senator: Humans causing climate change, saying otherwise is ‘bogus’ – The Hill’s E2-Wire

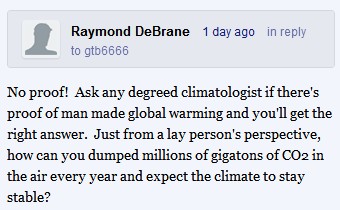
Millions of gigatons? About 160 gigatons of CO2 gets emitted into the atmosphere every year – of which humans are responsible for about 3%.

Had Hansen never injected his lunacy into Capitol Hill in 1988, few people would even think about CO2 or the climate. Raymond thinks the whole world revolves around CO2, because he has been conditioned – like one of Pavlov’s dogs.


Posted in Uncategorized | 8 Comments

See The Devastation For Yourself

[youtube=http://www.youtube.com/watch?v=tYbf-MpGS9c]

The super-duper 50,000 acre mega-fire of 2012, which our greenie friends are hysterical about. Over 100 houses were lost, because some people like to build wood houses in the middle of a forest which naturally burns about once every twenty years.

The panorama above is Lory State Park at noon today, which was reported burning this week. The only fire scars visible in the park are ones which are decades old. The forests on distant ridges on the right side were burned a few days ago. Almost no smoke is visible.

Out of the 50,000 acres which are reported to have burned, much of that was grassland which will have recovered by the end of the summer.

Posted in Uncategorized | 5 Comments

Linking Hurricanes With Global Warming And CO2

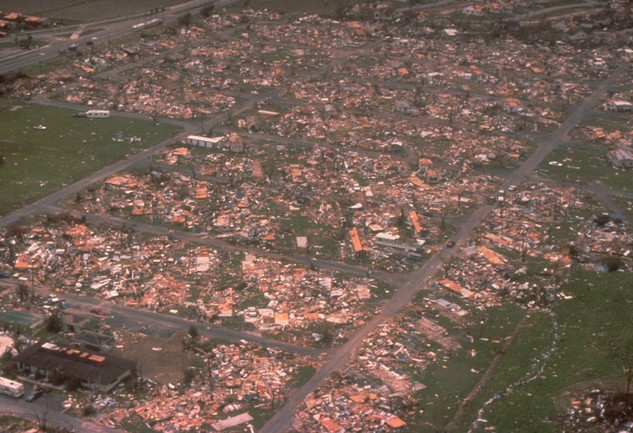
Hurricane Andrew hit Florida in August 1992, and was the last category five hurricane to hit the US. CO2 was just barely over 350 ppm at the time.

It has been almost seven years since a major hurricane hit the US, the longest such period in US history. It has also been seven years since Florida was hit by a hurricane, the longest such period in Florida history.

By contrast, during the year 1886 the US was hit by seven hurricanes, including two major hurricanes. Hansen says that 1886 was one of the coldest years on record.

Fig.A2.gif (652×474)

Posted in Uncategorized | 2 Comments

Kaiser Permanente : Global Warming To Destroy Humanity

As [Kaiser’s Environmental Stewardship Officer Kathy] Gerwig put it, “there’s credible evidence of significant climate change that will impact our ability to provide quality health care.”

She laid out four broad categories of the health effects:

Severe weather: Hurricanes, wildfires, floods, and heat waves all injure and kill people. Hospitals — and all businesses for that matter — need to prepare for these extremes.

The US is experiencing the quietest hurricane period on record.

Respiratory diseases: Air quality in general deeply affects health. This is, as Gerwig says, mainly about the short-term consequences of not dealing with burning fossil fuels and the changing climate.

Air quality in the US is vastly improved from 40 years ago.

Infectious diseases: As the planet warms, bugs like mosquitos can survive and thrive further north, spreading diseases to new areas. According to the UN, previously untouched areas like the southern U.S. and Mexico will face malaria, yellow fever, and dengue by 2050.

Kaiser Permanente: We’ll be ready for the inevitable climate-change-based downfall of society | Grist

Malaria used to be a common disease in the US. In fact, it used to be a serious problem even in the Arctic.

When I think of Finland, malaria just doesn’t normally come to mind. Although northern climes often have swarms of mosquitoes, its hard to imagine mosquito-borne infections gaining much traction in the short summer season. Yet defying imagination, malaria has thrived in northern Finland, Sweden and Russia near the arctic circle in the past. In the late 19th and early 20th century, Plasmodium falciparum and Plasmodium vivax caused outbreaks in northern Europe. Despite the outbreak of P. falciparium at Archangelsk in the 1930s, P. vivax is believed to be the primary malarial species in northern Europe.

Malaria Near the Arctic Circle « Contagions

Interesting that the environmental officer for a health care company is incompetent about both environment and health. She is the perfect Obamacare officer.

h/t to Marc Morano

Posted in Uncategorized | 34 Comments

Joe Bastardi Explains The Warm US Weather – And What To Expect The Rest Of The Year

Guest Post By Joe Bastardi

Sound Meteorological reasons for US temperature fluctuations as the globe cools overall

The last year the US has been warm and it can be directly traced to the changes taking place in the Pacific as the cooling PDO deepens,  resulting in a fall in global temps, but rapid responses up and down across the US based on the water in the tropical Pacific.   The theory is simple. The cooling of the Pacific tropical waters overall forces a global reaction that leads to the start of the cool down, that will be shown In a chart below, but the US temp response is inverse to the temps in the central Pacific relative to the temps In the eastern Pacific . The physical reaction will be discussed below, and it will be made clear as to why simply looking at what is going on over 10% of the globe is pure agenda driven drivel that the AGW crowd , pushed by many in government and science in this country, can be revealed as  ignorance to basic sound  logic, common sense, and science

The key is that no matter what the water temp,  it has to be warmer in the central Pacific than eastern Pacific.  If you have a warm event going on  ( the el nino) then the core of the warmth must  be in the in the central Pacific. If a cold event ( la nina) then  the only way the US is cold is if the water is colder  near South America. If the core of the cold is back  west, then it creates a pressure and temperature pattern across the globe that will force it to be warm in the  US . The same type of thing happened in the mild la nina winters of the  MID  1970s, before the reversal  in the late 70s, something I believe could happen this winter!

in a cold regime, lets look mid  09  to  mid  10 its warmer in the center
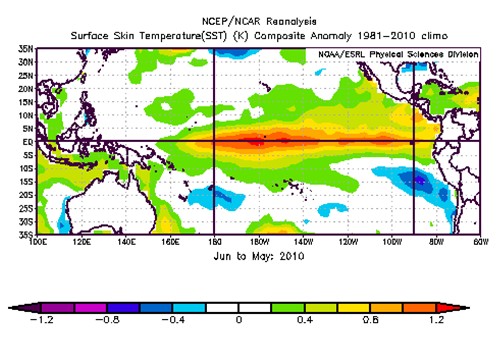
so you understand the physical reasons,  it has to do with the overall global temp and the results of warming and cooling of this area of immense energy on the global pattern.  Warm the water in the central pac and you create   lower than normal pressures in this area and there has to be compensating rises in pressure over N  America. This is greatest in the winter season. Why? because in the tropical pacific  seasonal temp variaions are much less than in the temperate regions,  so  a slight pressure fall here because of warming will demand a bigger response  to the positive where its cold, again remember the lesson of the cold morning vs the hot afternoon and how easy it is to get temps to bounce up and down when its very cold ( takes very little energy change)  as opposed to when its  hot. The same change in energy  for 1 degree at  80  will produce  more than a  15 degree change around 0.

Now look at the Pacific while the US has been warm over the last year

Continue reading →

Posted in Uncategorized | 50 Comments

1907 : Weather Bureau Saw Hansen And The Corrupt Press Corps(e) Coming

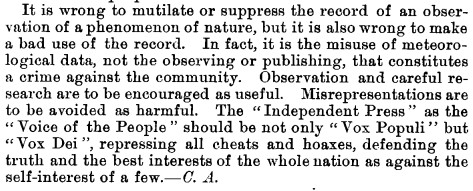
docs.lib.noaa.gov/rescue/mwr/035/mwr-035-01-0007b.pdf

Instead of repressing the cheats and hoaxes, people like Borenstein and Goldenberg have chosen to aggressively enable cheating by scientists who are promoting their own self-interests.

Where is “Vox Dei?” What happened to the Washington Post and New York Times? Where are Woodward and Bernstein now?

Posted in Uncategorized | 7 Comments

The Fort Collins 2012 Mega-Fire

I’ve seen several news stories describing the fire here as a “mega-fire caused by global warming.”

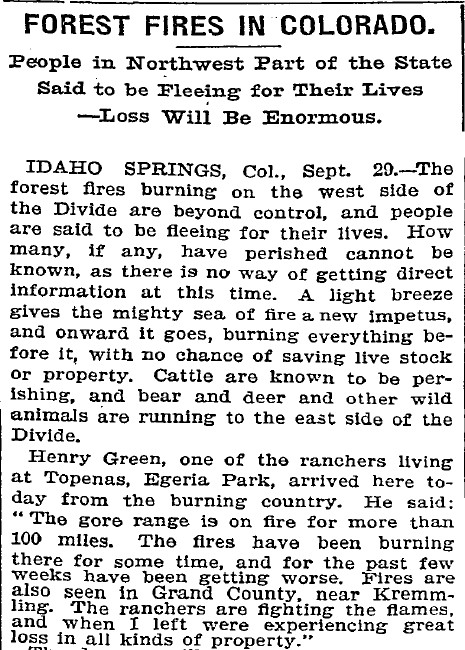
It is sad that people lost their homes (what do you expect if you build a house in the middle of a forest in a place that averages only 14 inches of rain a year) – but the fire is not very big compared to the low CO2 fire of 1898.

The 2012 fire is the red dot west of Fort Collins. The 1898 fire is the blue rectangle. The 1898 fire was hundreds of times larger. People who claim that fires are getting more severe, have no idea what they are talking about.

UPDATED: High Park Fire maps and imagery | The Coloradoan | coloradoan.com

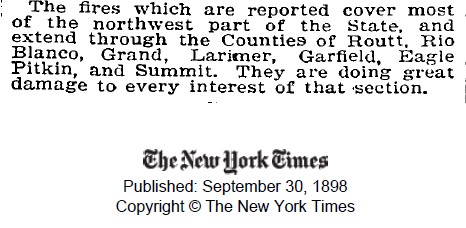
FOREST FIRES IN COLORADO. – People in Northwest Part of the State Said to be Fleeing for Their Lives — Loss Will Be Enormous. – View Article – NYTimes.com

Posted in Uncategorized | 5 Comments

Clarifying Hansen’s Scenarios – Worse Than It Seems

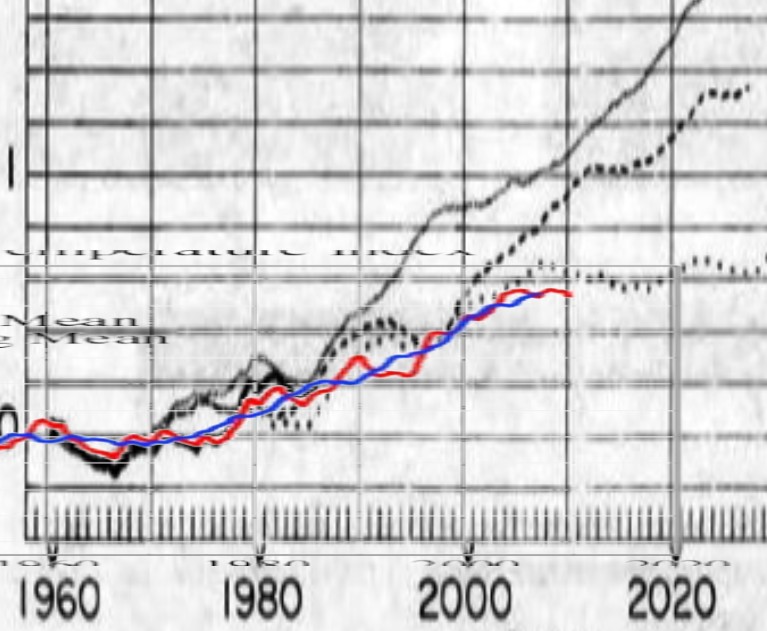
This is the common perception of the meaning of Hansen’s 1988 scenarios.

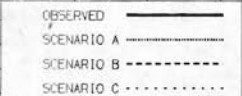
–A: Increase of CO2 emissions of 1.5% per year
–B: fixed increase CO2 emissions after the year 2000
–C: No increase in CO2 emissions after the year 2000

Norwegian Climate Professor: Hansen’s Projection Off By 150%…Regrettable That Politicians Still View It As Reliable

But that isn’t accurate. What Hansen actually wrote was

pubs.giss.nasa.gov/docs/1988/1988_Hansen_etal.pdf

  • Scenario A means steadily increasing annual emissions.
  • Scenario B doesn’t make any sense, but possibly means constant annual emissions at a level lower than 1988.
  • Scenario C means essentially zero emissions after the year 2000 i.e. “net climate forcing ceases to increase after the year 2000.”

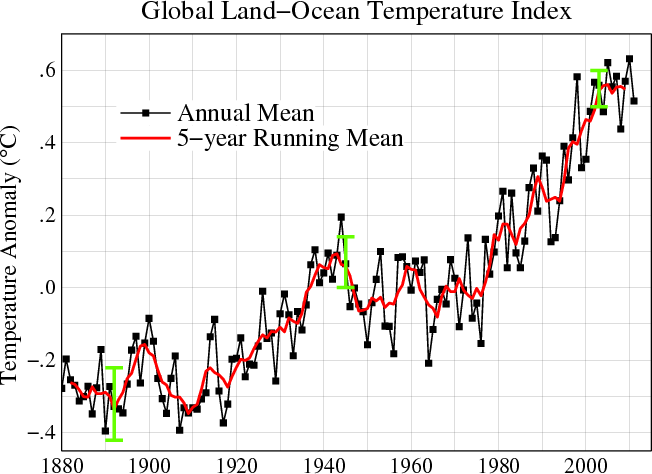
So where are we according to GISS? Below the zero emissions scenario C.

Temperatures are lower than Hansen forecast they would be if humans disappeared off the planet twelve years ago.

Posted in Uncategorized | 14 Comments

Cherry Picking The 1980s

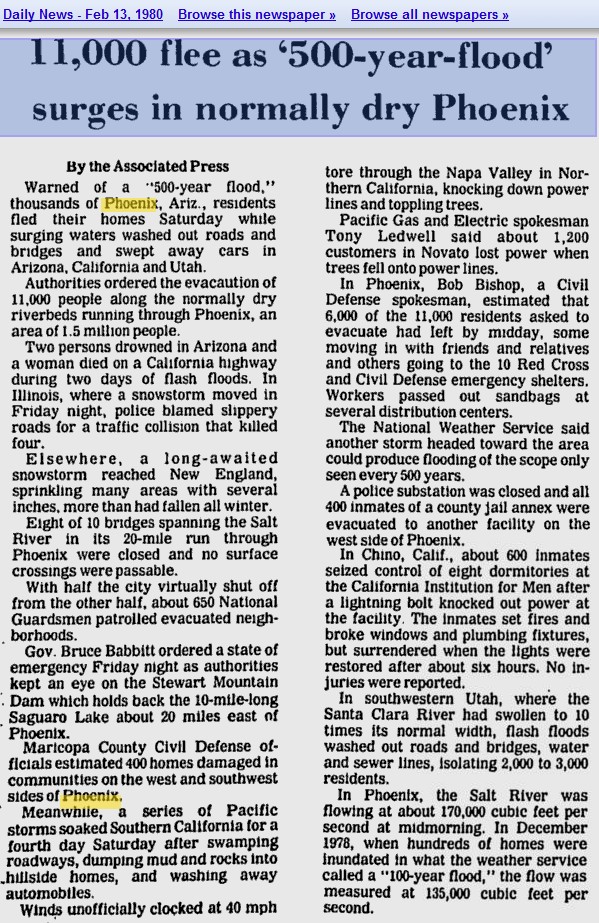
Why our friends like to choose 1980 as the start date for their western drought/fire stories

Daily News – Google News Archive Search

I was living in Scottsdale and working in Tempe at the time. Only one bridge across the Salt River didn’t wash out. Commuting was a several hour proposition.

Posted in Uncategorized | Leave a comment

Will The Real Jim Shady Please Stand Up, Please Stand Up …

Hansen said the exact opposite in 1999

Empirical evidence does not lend much support to the notion that climate is headed precipitately toward more extreme heat and drought. The drought of 1999 covered a smaller area than the 1988 drought, when the Mississippi almost dried up. And 1988 was a temporary inconvenience as compared with repeated droughts during the 1930s “Dust Bowl” that caused an exodus from the prairies, as chronicled in Steinbeck’s Grapes of Wrath. NASA GISS: Science Briefs: Whither U.S. Climate?

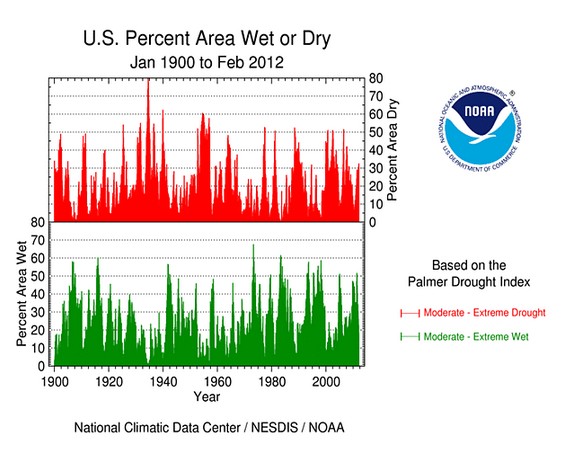
There is no indication that droughts are getting worse. In 1934, 80% of the US was simultaneously experiencing drought. 190001-201202.gif (650×534)

Over the past decade, extreme drought has plummeted in the US.

Continue reading →

Posted in Uncategorized | 8 Comments