Lukewarmers : All Versions Are Good

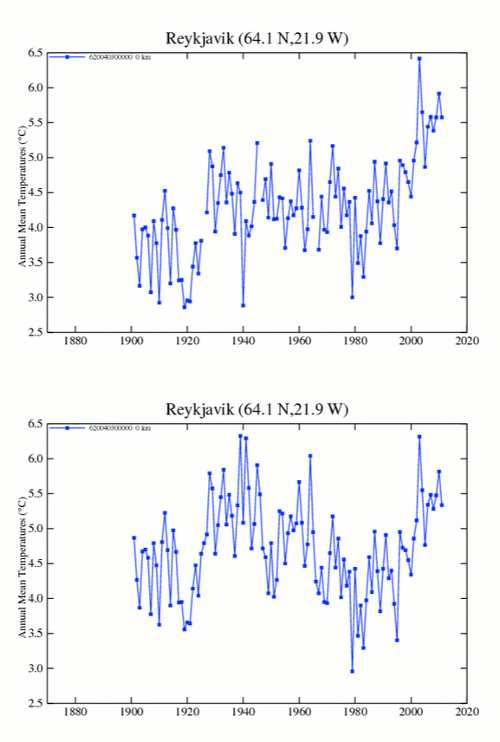
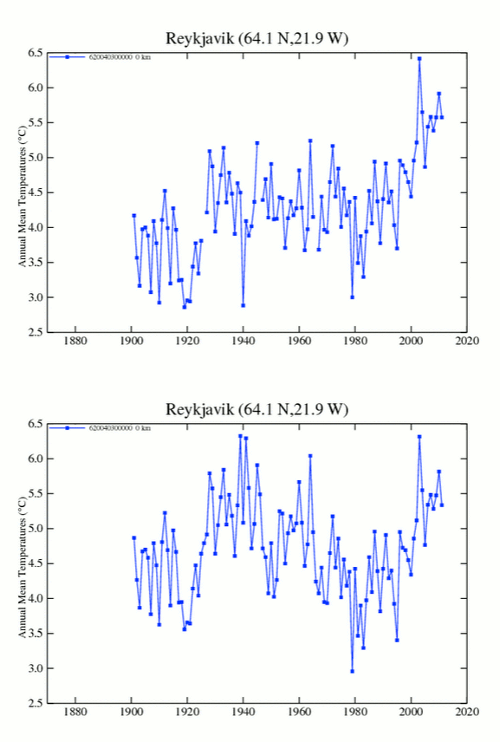
Our lukewarmist friends insist that Hansen’s data is good, and that I just don’t understand it. This is remarkable statement, given that Hansen radically changes the data all the time.

Apparently both versions are completely accurate. Iceland is a schizo kind of place – unlike Hansen who is right on top of the facts.

Posted in Uncategorized | 7 Comments

Worse Than We Thought

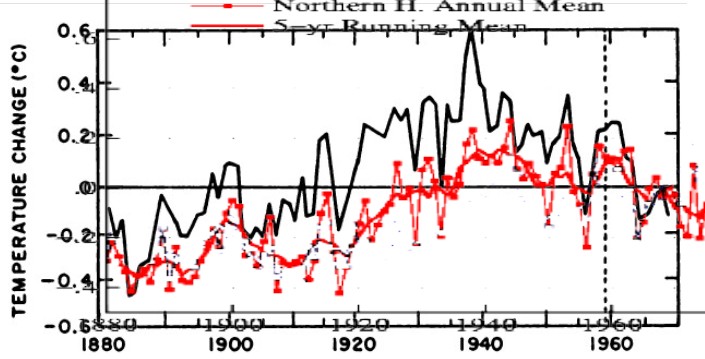
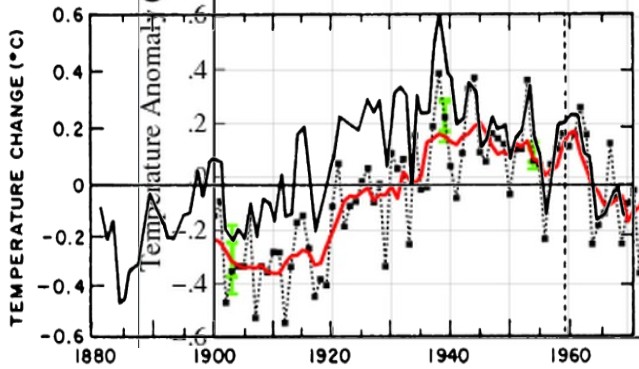
I extracted the GISS Northern Hemisphere graph which wooltwat wanted to see. The graph above overlays GISS NH on the National Academy of Sciences 1975 graph, normalized to zero. (Note that there is some non-linearity in the Y-axes of both graphs. I plotted both of them exactly as they were drawn, with identical scales.)

It is even worse than the original version. Be careful what you ask for.

Posted in Uncategorized | 6 Comments

New Scientist : Herbivores Can’t Survive A Warm Climate

Climate change will create a toxic brew for herbivores

A WARMER world might be a poisoned one. A compilation of studies suggests that as temperatures rise, herbivorous mammals will suffer greater effects from the toxins they eat, with animals living in dry regions at particular risk.

Mammals can maintain a constant body temperature and so are thought to be less vulnerable to temperature changes than cold-blooded animals like reptiles. But Denise Dearing at the University of Utah in Salt Lake City has found evidence that mammals feel the heat in subtle ways.

Climate change will create a toxic brew for herbivores – environment – 01 June 2012 – New Scientist

This explains why herbivores in warm climates are so small and sickly.

h/t to Marc Morano

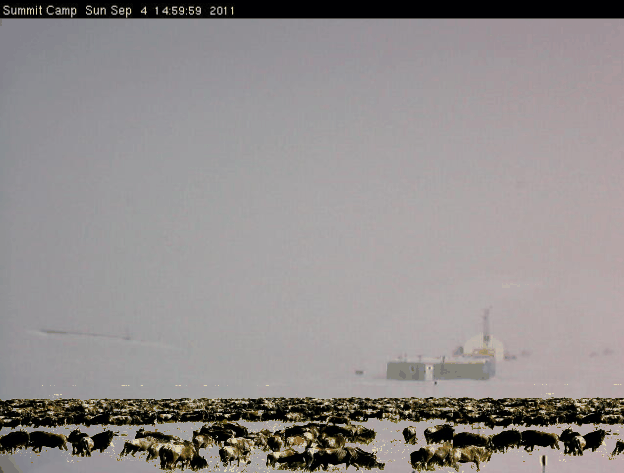
Perhaps they are better off grazing on the ice?

Posted in Uncategorized | 12 Comments

Three Months Of Terrifying Normalcy In Arctic ice

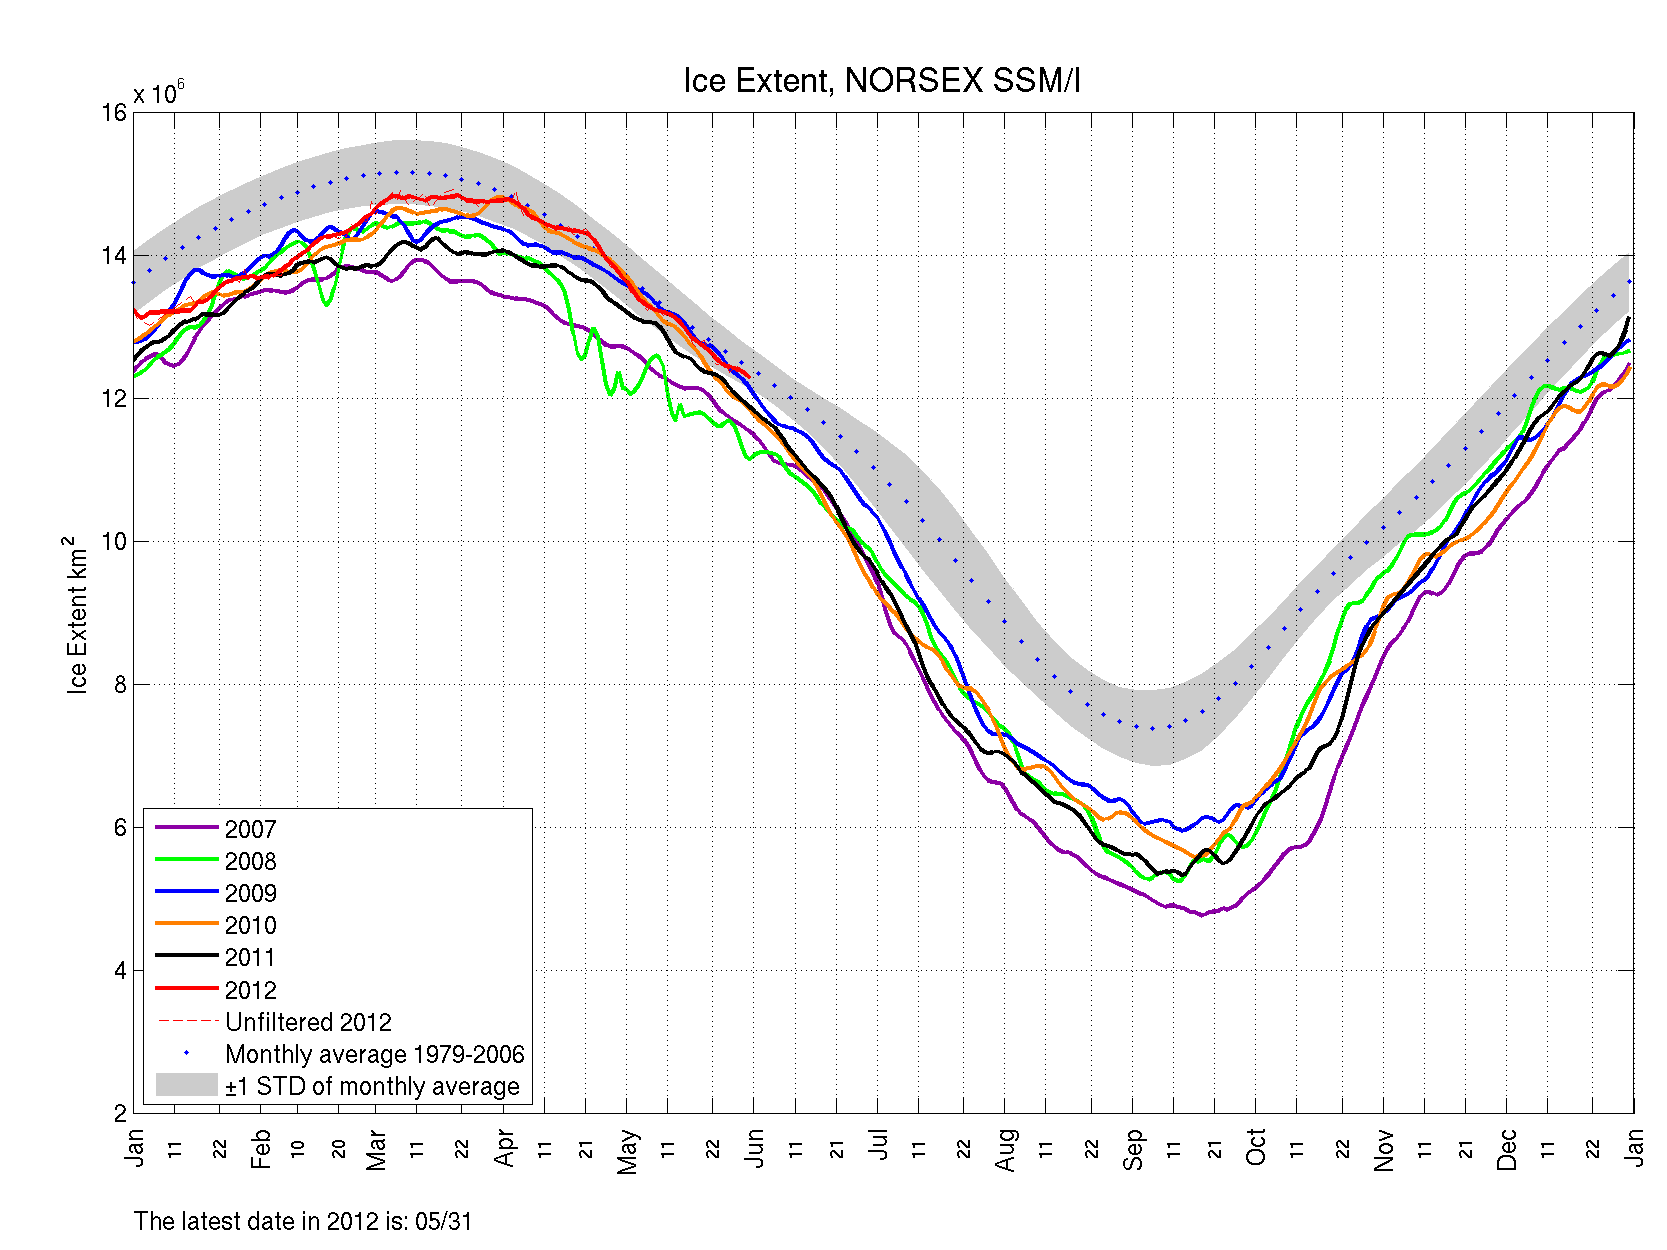
Since March 1, Arctic ice extent has been within one standard deviation of normal, on its way to an ice-free state this summer.

ssmi1_ice_ext.png (1667×1250)

Posted in Uncategorized | 4 Comments

Mathematically Challenged Lukewarmers

Comment from from Judith Curry’s blog.

lolwot | May 25, 2012 at 4:02 am

The first two graphs Steven Goddard compares are a graph of Northern Hemisphere Temperatures with A graph of 90N-23.6N temperatures. What’s that? Not the same thing is it. Close, but not the same. It’s strange because on the GISTEMP site Hansen has put Northern Hemisphere graphs. Why does Goddard pick a 90N-23.6N one instead? That’s sloppy at best.

Below is the graph he is referring to. (BTW – If I could find a Hansen Northern Hemisphere graph I would use it, because it would make the distortion even more pronounced. Unfortunately the GISTEMP site does not have a clean NH graph.)
Hansen – The Climate Chiropractor | Real Science

The argument that he is making is that Hansen’s inclusion of the tropics radically changes the shape of the graph.

Here is some remedial math and science to help out wooltwat. The tropics always show the smallest temperature change. If you add in the small numbers from the tropics (whatever they are) it won’t have a significant effect on the shape of the graph, because their small magnitude causes them to be weighted minimally. Even worse, he is claiming that the addition of small magnitude numbers has increased the magnitude. For example, NAS showed the 1910 temperature deviation as being -0.1, but Hansen shows it as -0.4. How does the inclusion of a group of small magnitude numbers cause the magnitude to quadruple?

Hansen creates his phony graphs by cooling the high latitudes (as shown below) which always show much larger variations in temperature than near the equator. Polar amplification causes the temperature records north of 23.6 to be weighted much more heavily. Hansen fully understands that temperatures in the tropics have a minimal effect on the shape of the temperature graphs, and that is why he doesn’t focus on them.
This is what Hansen is hiding from 1900 to 1940.

it was concluded that near Polar temperatures are on an average six degrees higher than those registered by Nansen 40 years ago. Ice measurements were on an average only 6½ feet against from 9¼ to 13 feet.

Russian report from 1940

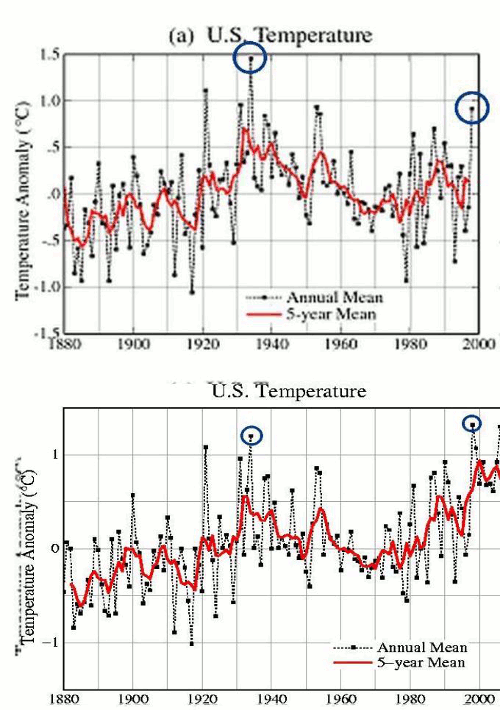
Our lukewarmer friends say that Hansen’s data tampering is all golden.
So then because thou art lukewarm, and neither cold nor hot, I will spue thee out of my mouth

Revelation 3:16

Posted in Uncategorized | 6 Comments

Hansen : Hiding The Decline In Greenland

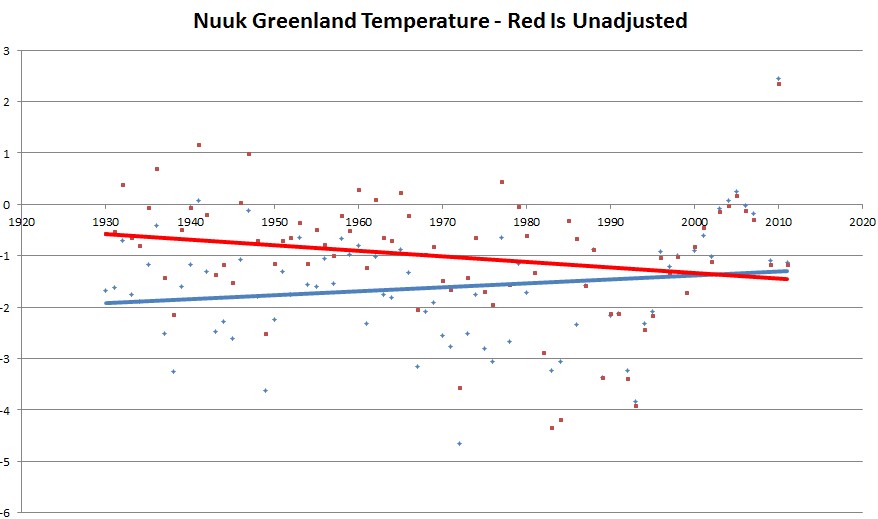
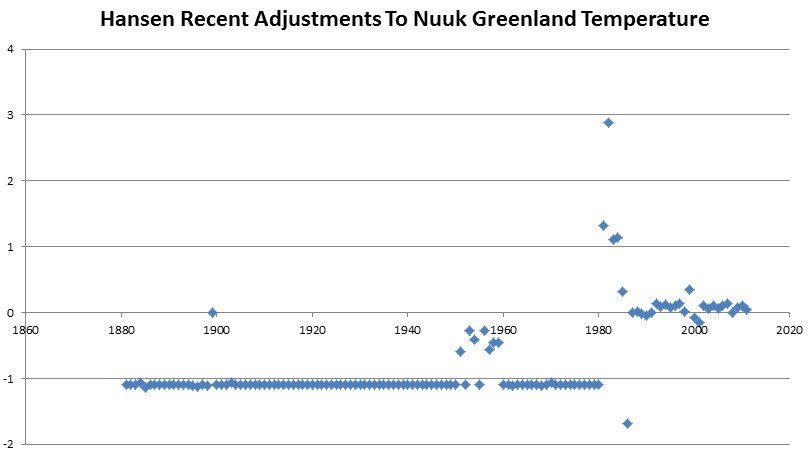
Jimmy has been a busy boy destroying the global temperature record. Before his latest tampering, the capital of Greenland had been cooling since the 1930s (red line below.) Hansen recently fixed that to produce a warming trend (blue line below.)

Jimmy performed his magic by heating up all post-1980 temperatures and cooling pre-1980 temperatures.

Data.GISS: GISS Surface Temperature Analysis

Data.GISS: GISS Surface Temperature Analysis

If the present refuses to get warmer, then the past must become cooler.

Posted in Uncategorized | 10 Comments

Return Of The Jedi

Looks like some real scientists have had enough of Hansen’s 30 year reign of lies and bullying. A couple of weeks ago, Martin Hoerling slammed him with “facts should, and do, matter to some.” 

Harold Brooks said :

“Those who continue to talk in certain terms of how local weather extremes are the result of human climate change are failing to heed all the available evidence.”

Global warming heats up tornado debate – opinion – 07 May 2012 – New Scientist

And now the FEMA director says :

“Well, I’m not a meteorologist. I’m not a climate scientist, and hurricanes are cyclic,” Fugate responded. “I do know history, and if you look at history and you look at hurricane activity, there are periods of increased and decreased activity that occurs over decades,” Fugate said. “Throughout the ‘60s, ‘70s, early ‘80s, up until about ’95, the Atlantic was actually in a period of below-average activity, even though you had significant storms like Andrew, Frederic, and David.”

FEMA Director: Frequency of Tornadoes Cyclical, Won’t Say If Global Warming Involved | CNSNews.com

h/t to Marc Morano

Posted in Uncategorized | 8 Comments

Ice Age At 2000+ PPM CO2

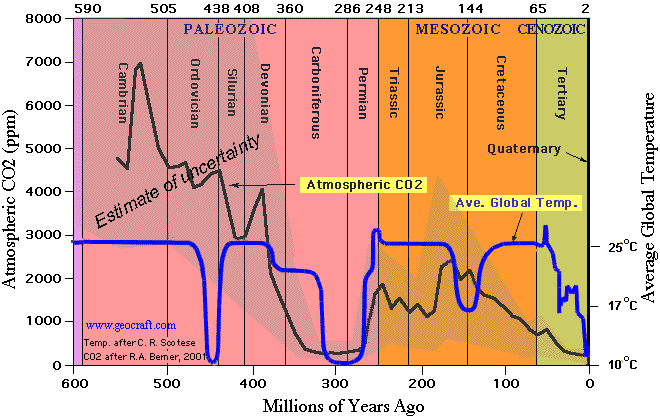
Climate during the Carboniferous Period

Earth experienced an ice age 450 million years ago, with CO2 somewhere between 2000 and 8000 ppm. According to Hansen’s theories – all life on Earth should have been extinct before it even evolved.

Posted in Uncategorized | 34 Comments

Come On Guys, Please Get Your Lies Consistent

Seth Borenstein reports that CO2 is rising at an accelerating pace

WASHINGTON – (AP) — The world’s air has reached what scientists call a troubling new milestone for carbon dioxide, the main global warming pollutant.

Monitoring stations across the Arctic this spring are measuring more than 400 parts per million of the heat-trapping gas in the atmosphere. The number isn’t quite a surprise, because it’s been rising at an accelerating pace. Years ago, it passed the 350 ppm mark that many scientists say is the highest safe level for carbon dioxide. It now stands globally at 395.

Warming gas levels hit ‘troubling milestone’

Last year, Romm reported that CO2 was increasing “super-exponentially.” Yet when discussing Hansen’s 1988 predictions, they claim that Scenario B is closest to actual emissions.

Scenario A assumes continued exponential trace gas growth, scenario B assumes a reduced linear growth of trace gases, and scenario C assumes a rapid curtailment of trace gas emissions such that the net climate forcing ceases to increase after the year 2000.

pubs.giss.nasa.gov/docs/1988/1988_Hansen_etal.pdf

The term “reduced linear” doesn’t make any sense, but it certainly doesn’t mean “accelerating.” The only scenario which fits the description is scenario A.

Posted in Uncategorized | 18 Comments

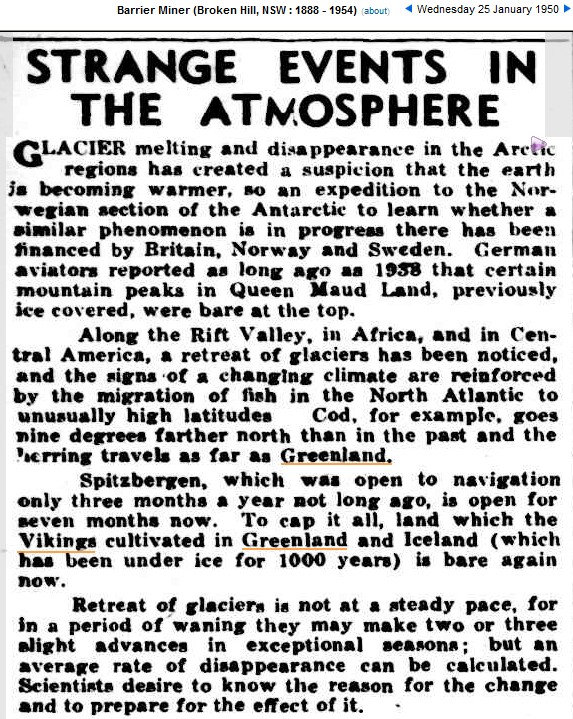
1950 : Glaciers Melting – Animals Moving North – Viking Farms Reappearing

25 Jan 1950 – THE BARRIER MINER WEDNESDAY, JANUARY 25, 1950. S…

Posted in Uncategorized | 5 Comments