Extreme Rainfall

According to climate experts, extreme rainfall is increasing because warm air holds more moisture.
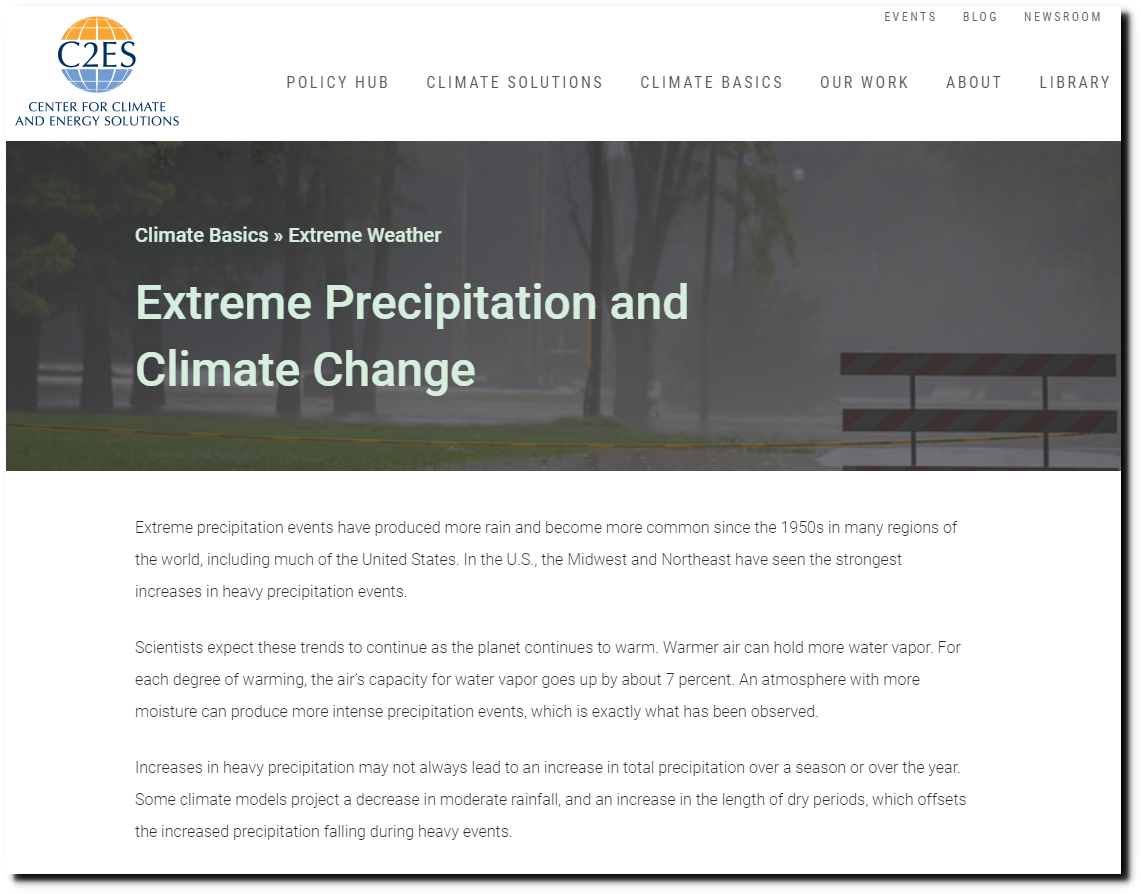
Extreme Precipitation and Climate Change | Center for Climate and Energy Solutions

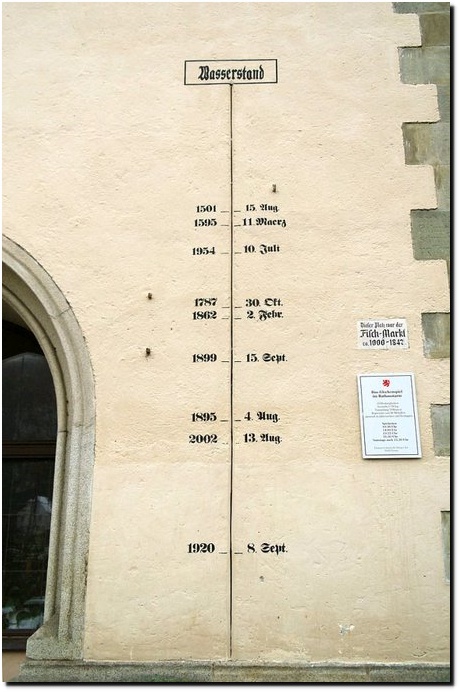
Germany had five inches of rain in 24 hours, and experts say that was due to climate change.

How climate change fueled the devastating 2021 floods in Germany and northwest Europe – Vox

In 1920, Germany had five inches of rain in eight minutes.
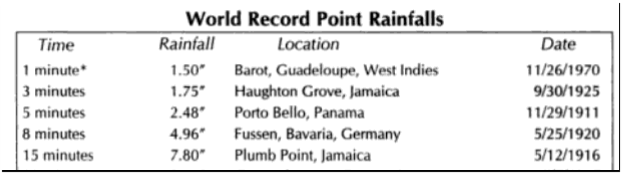
Extreme Weather: A Guide & Record Book – Christopher C. Burt – Google Books
Forty-five years ago this this week was one of the deadliest floods in modern US history, when twelve inches of rain fell in just a few hours near Estes Park, Colorado.

02 Aug 1976, 1 – Rapid City Journal at Newspapers.com

Pakistan was also ravaged by floods.
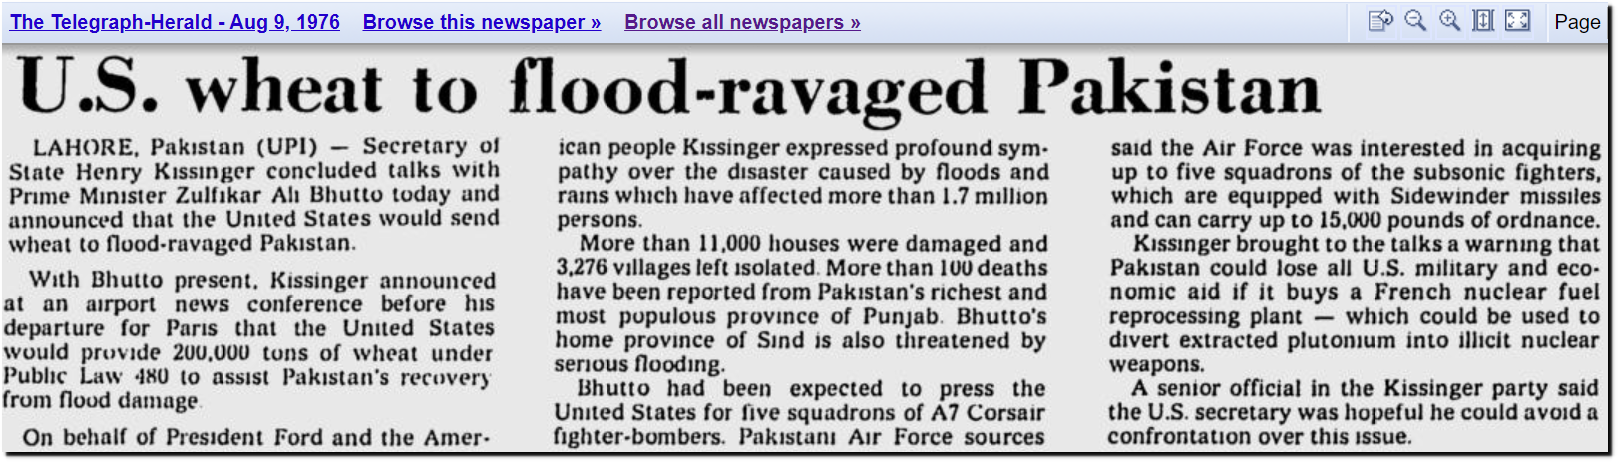
The Telegraph-Herald – Google News Archive Search

England was having their hottest and driest summer on record.
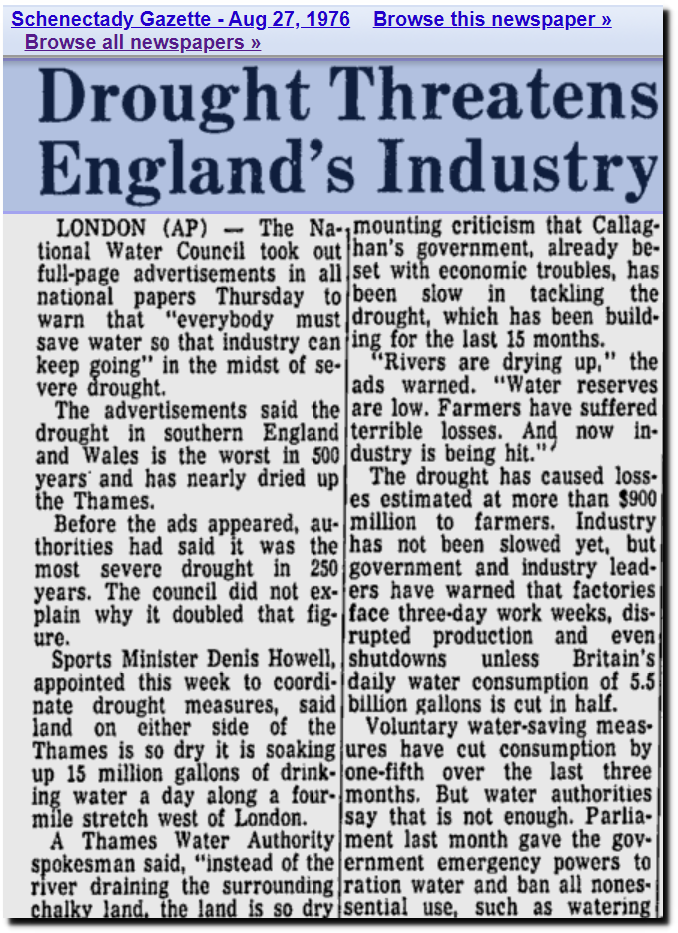
Schenectady Gazette – Google News Archive Search

The CIA issued a report blaming the bad weather on global cooling.
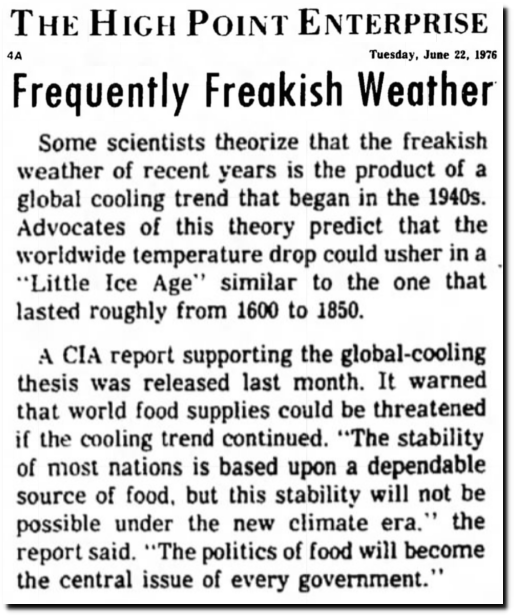
22 Jun 1976, Page 5 – The High Point Enterprise at Newspapers.com

Pine Beetles were on a rampage in Oregon.
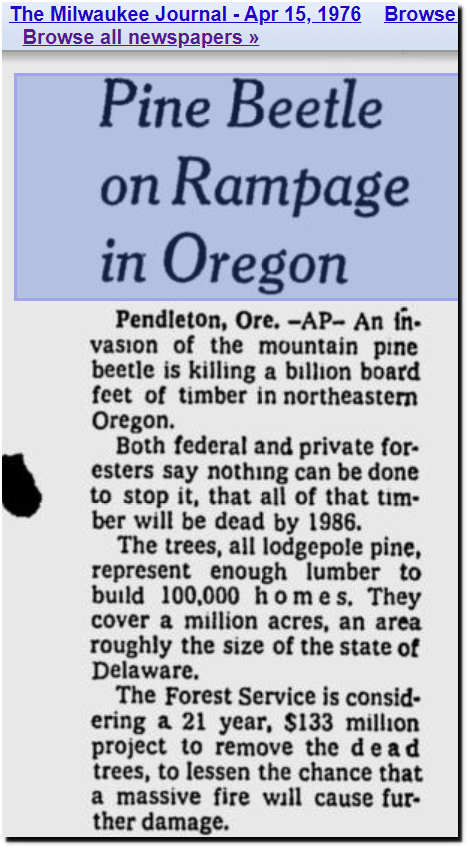
The Milwaukee Journal – Google News Archive Search

By December, Colorado was having their worst drought and ski season on record. There was no snow at Vail.
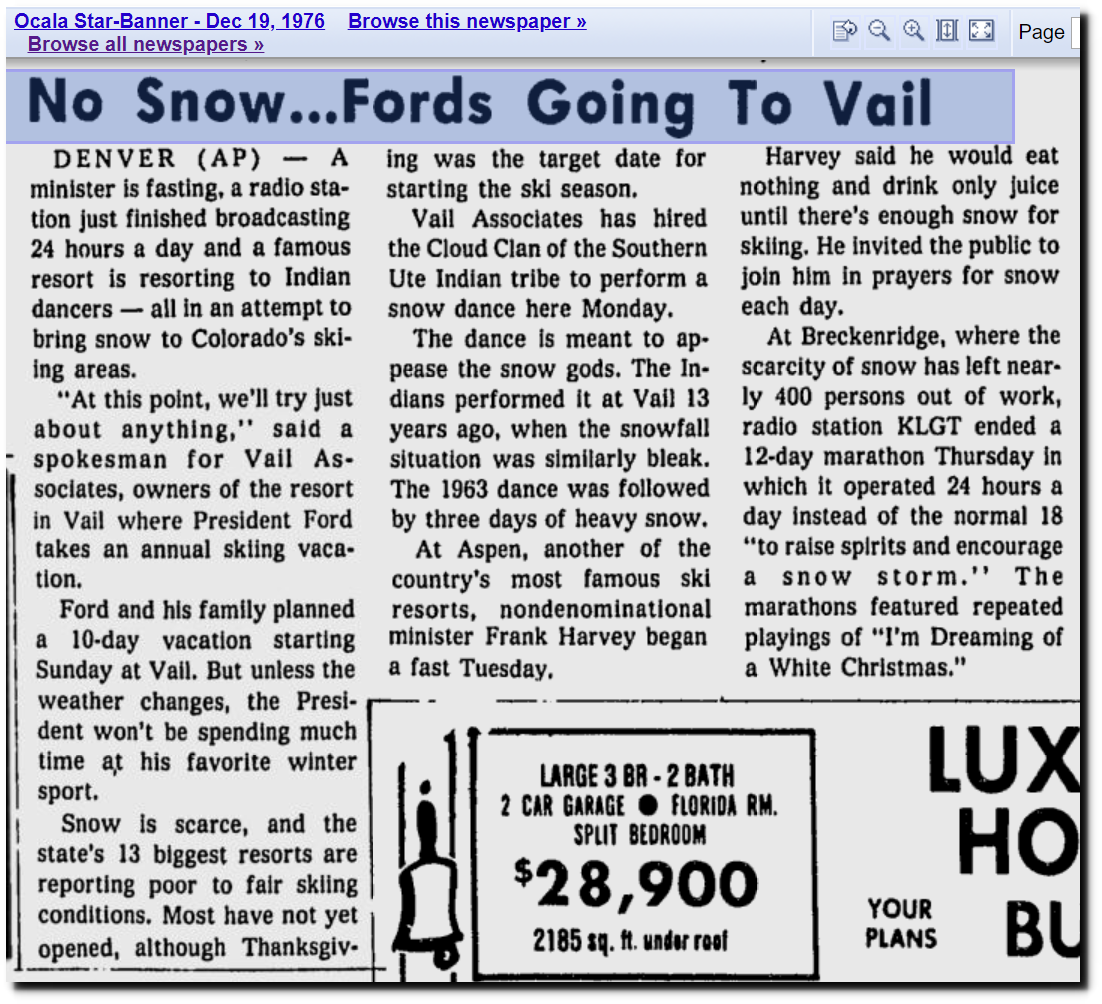
Ocala Star-Banner – Google News Archive Search

But it was snowing in Miami.
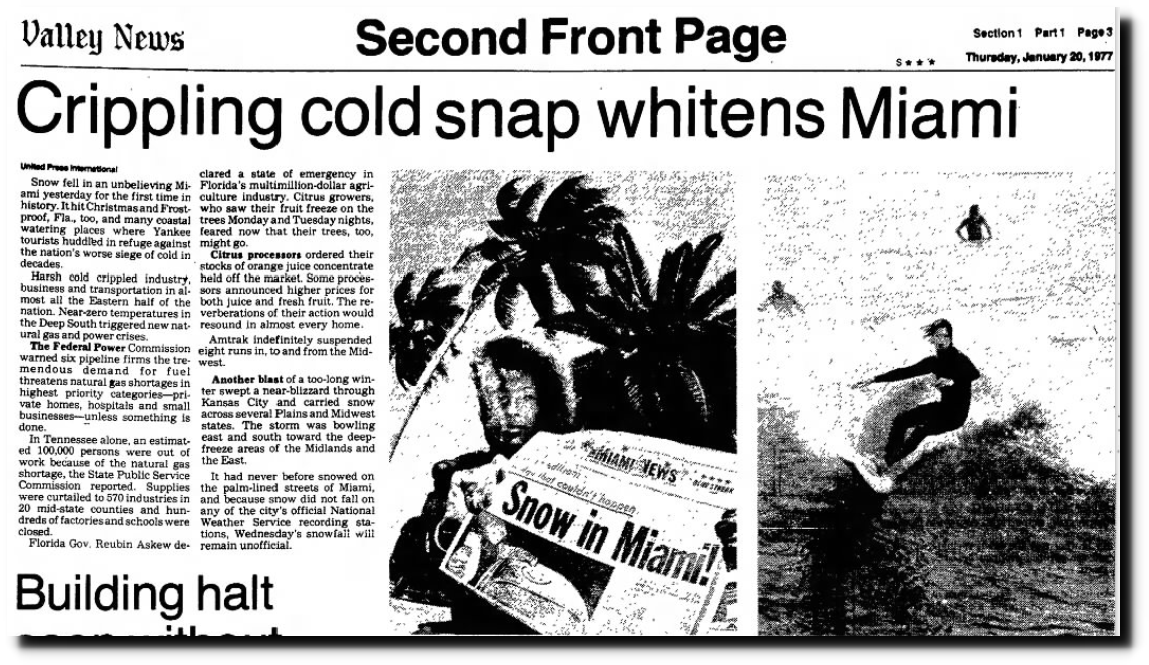
20 Jan 1977, Page 3 – Valley News
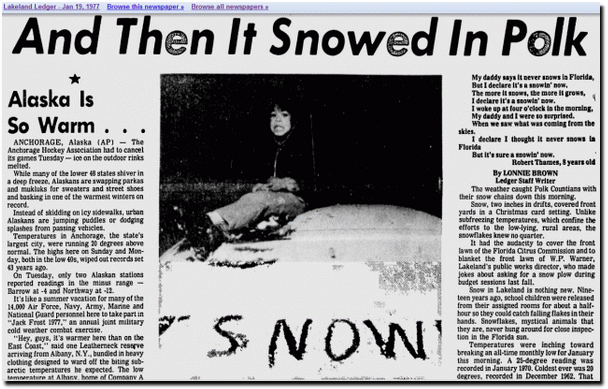
Lakeland Ledger – Google News Archive Search

Alaska was warmer in Florida.
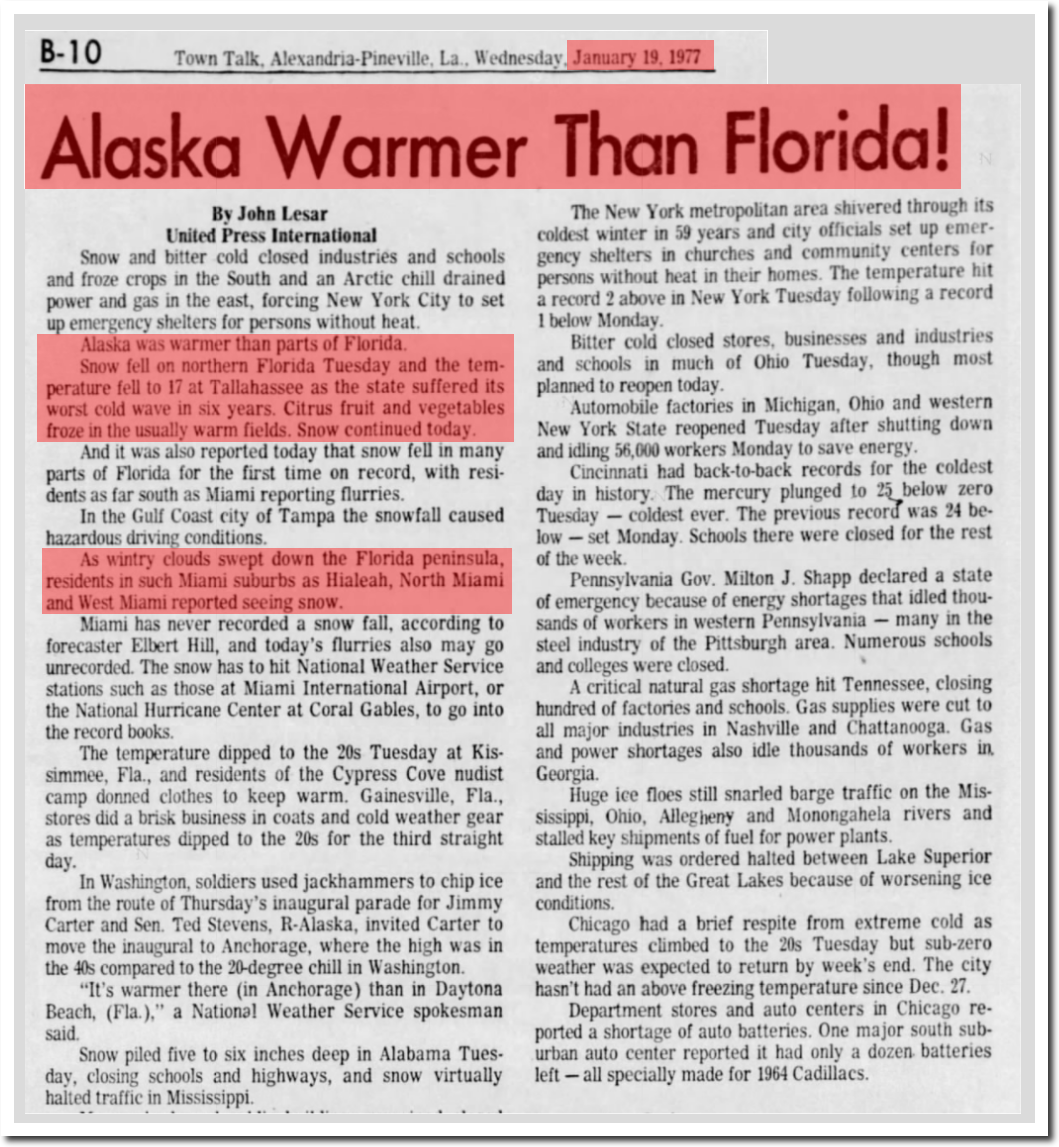
19 Jan 1977, Page 20 – The Town Talk at Newspapers.com

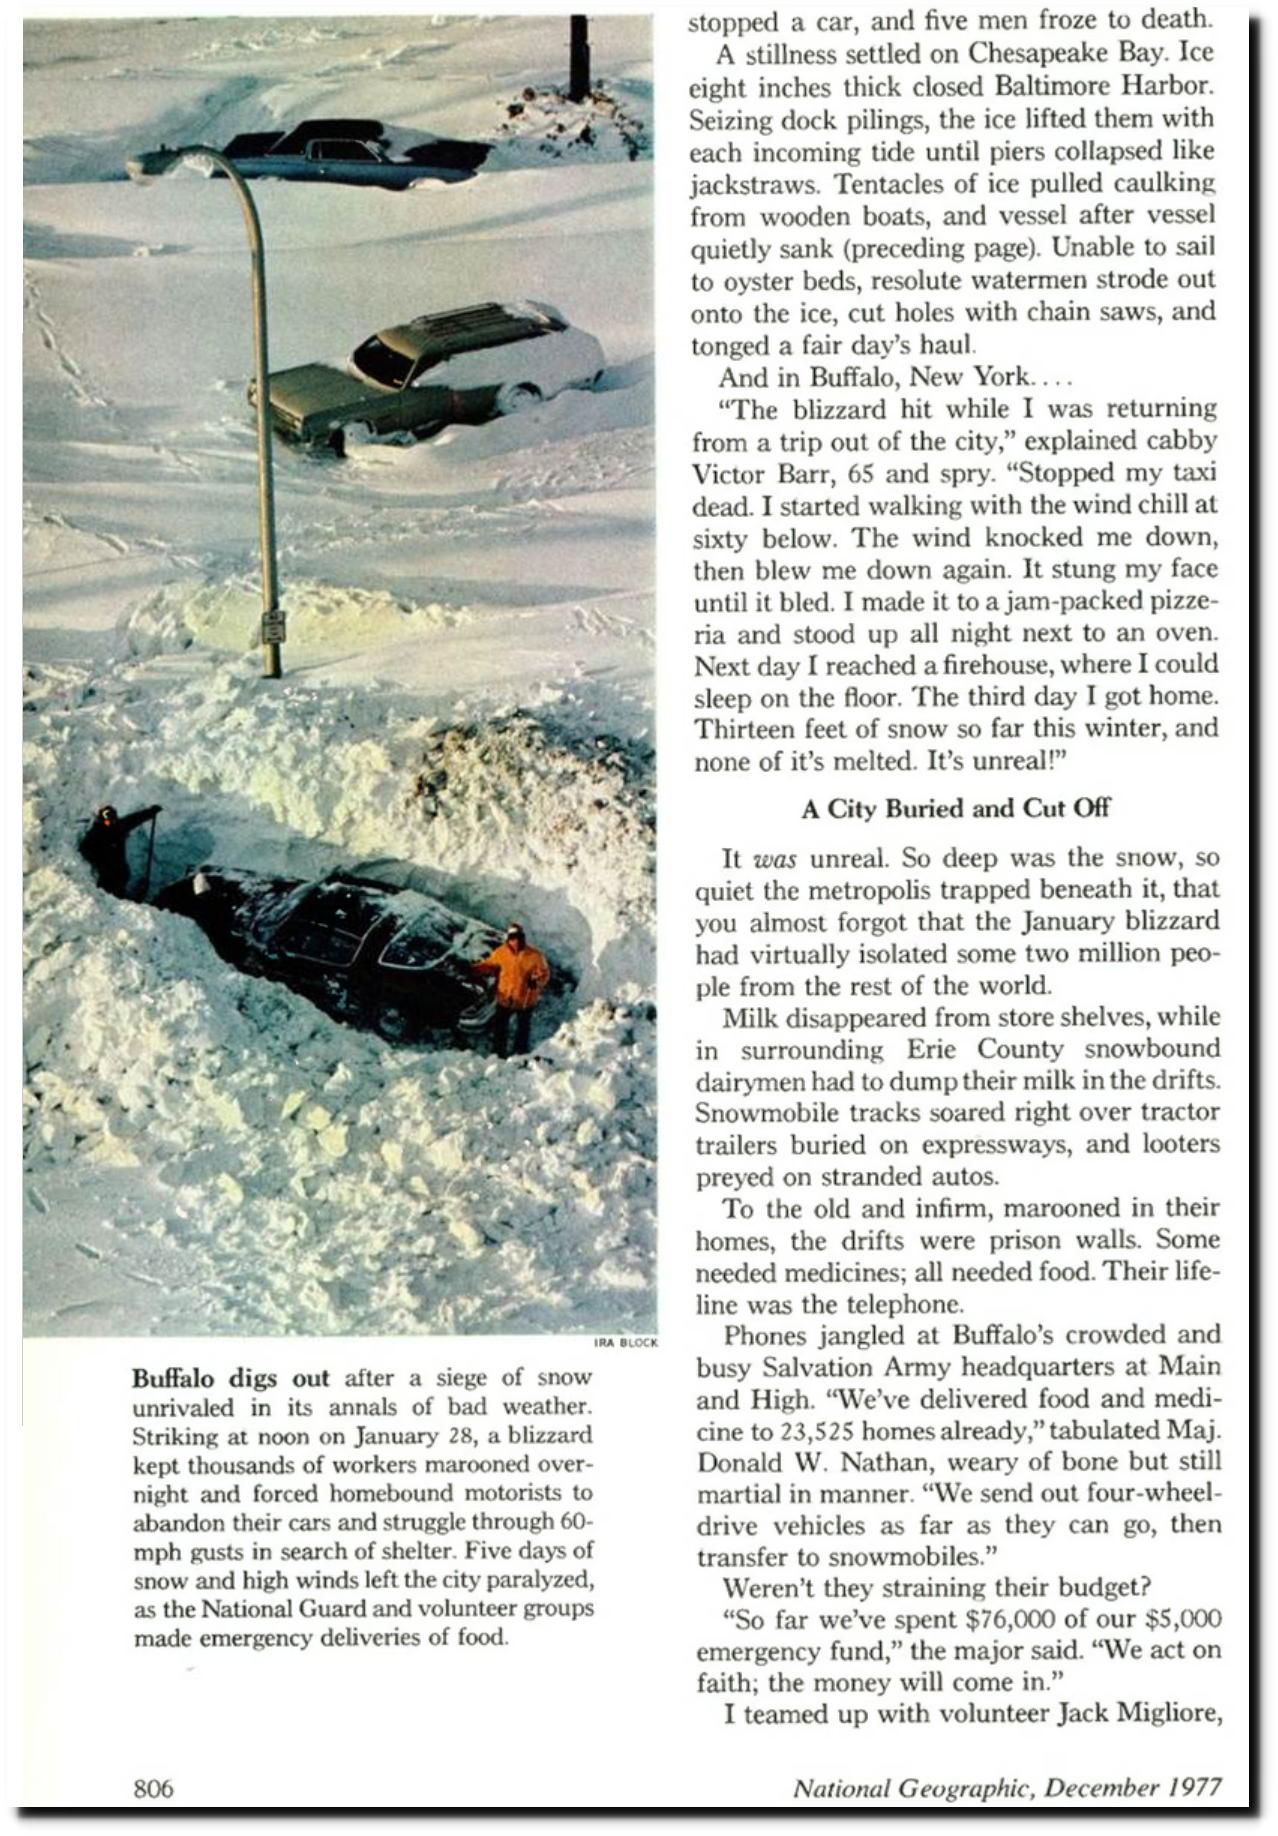
National Geographic described it as “The Year the Weather Went Wild.”
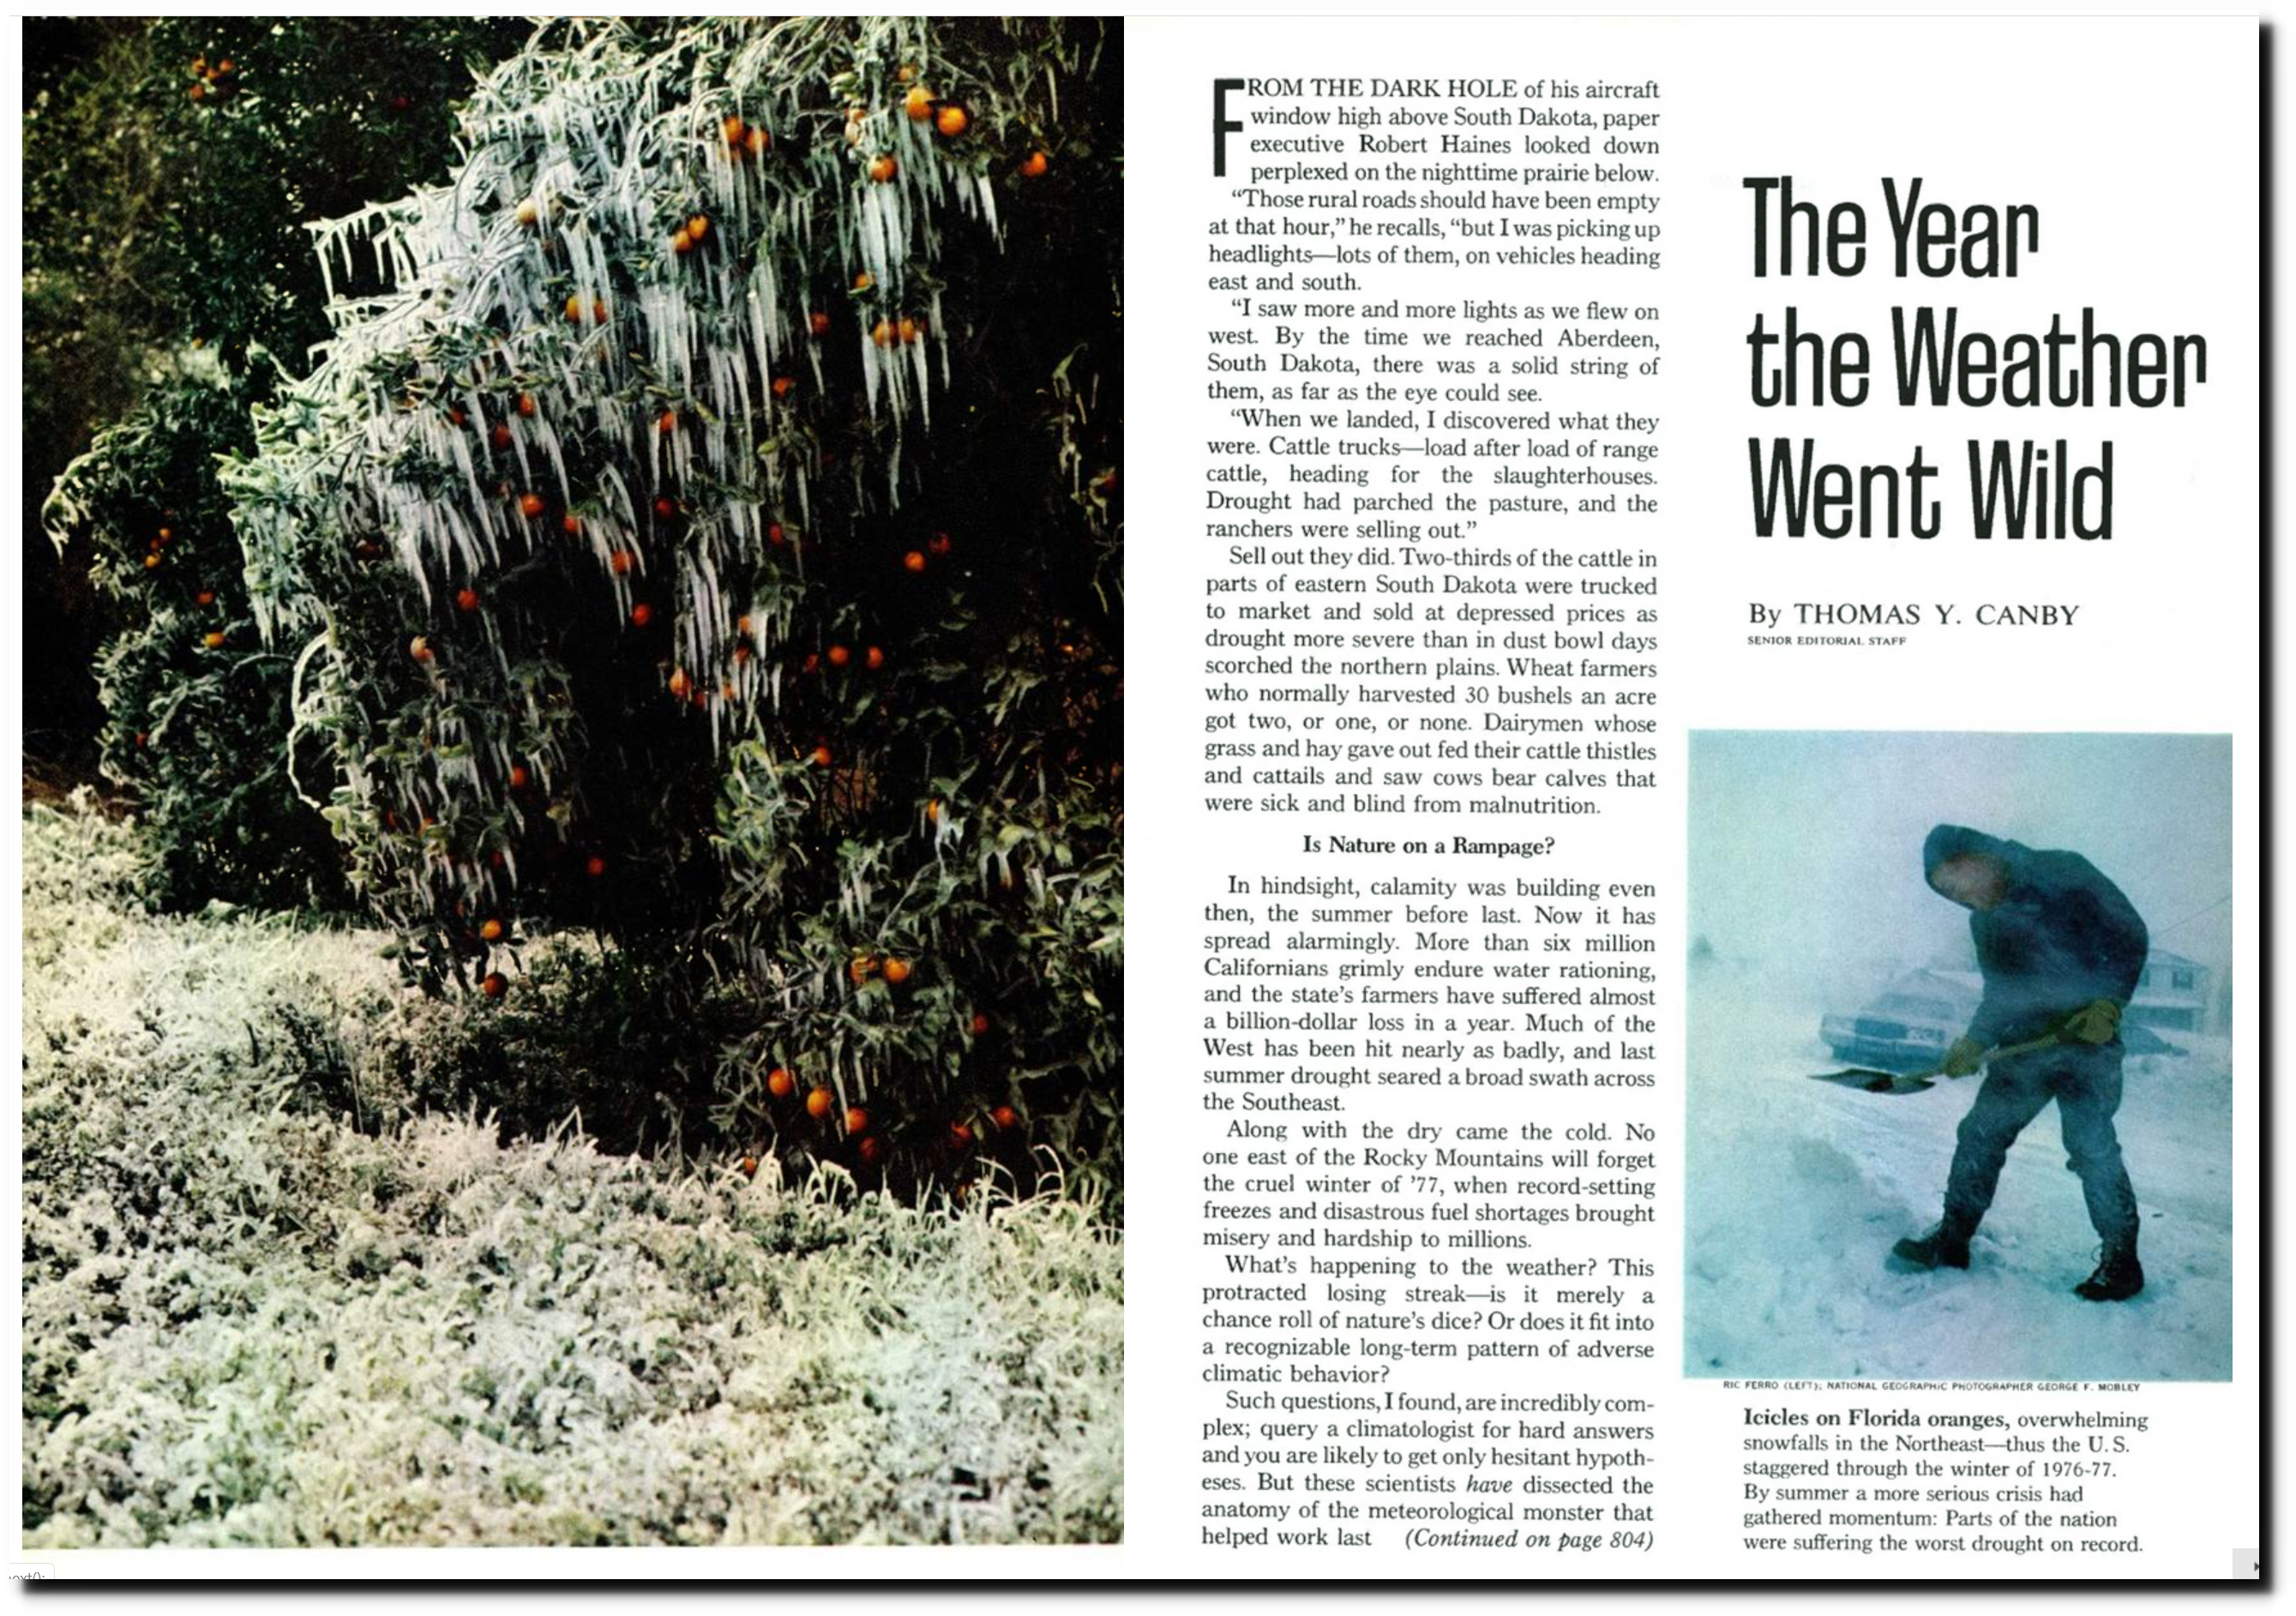
The National Geographic Archive | December 1977 | page 1

Jerry Brown declared a drought disaster in California.
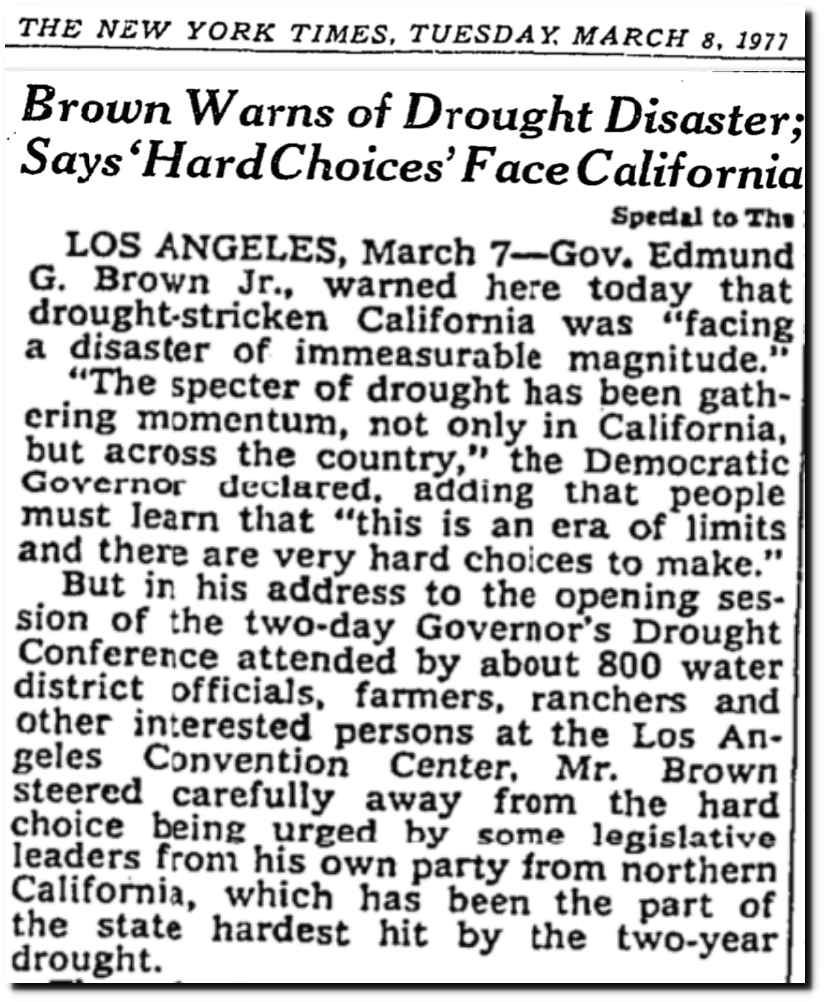
Brown Warns of Drought Disaster; Says ‘Hard Choices’ Face California – The New York Times

The extreme weather was blamed on a very wavy jet stream.
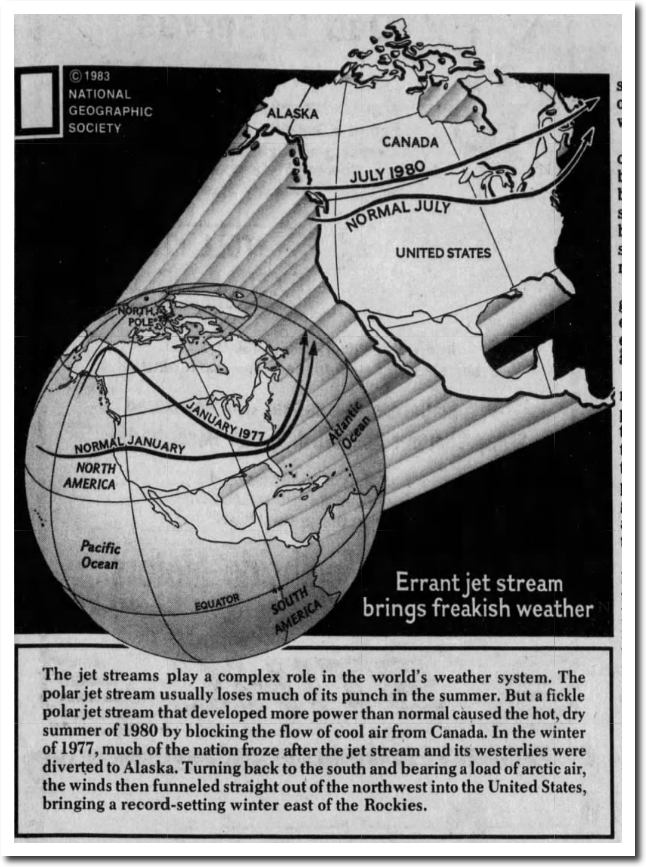
25 May 1983, Page 29 – Stevens Point Journal at Newspapers.com

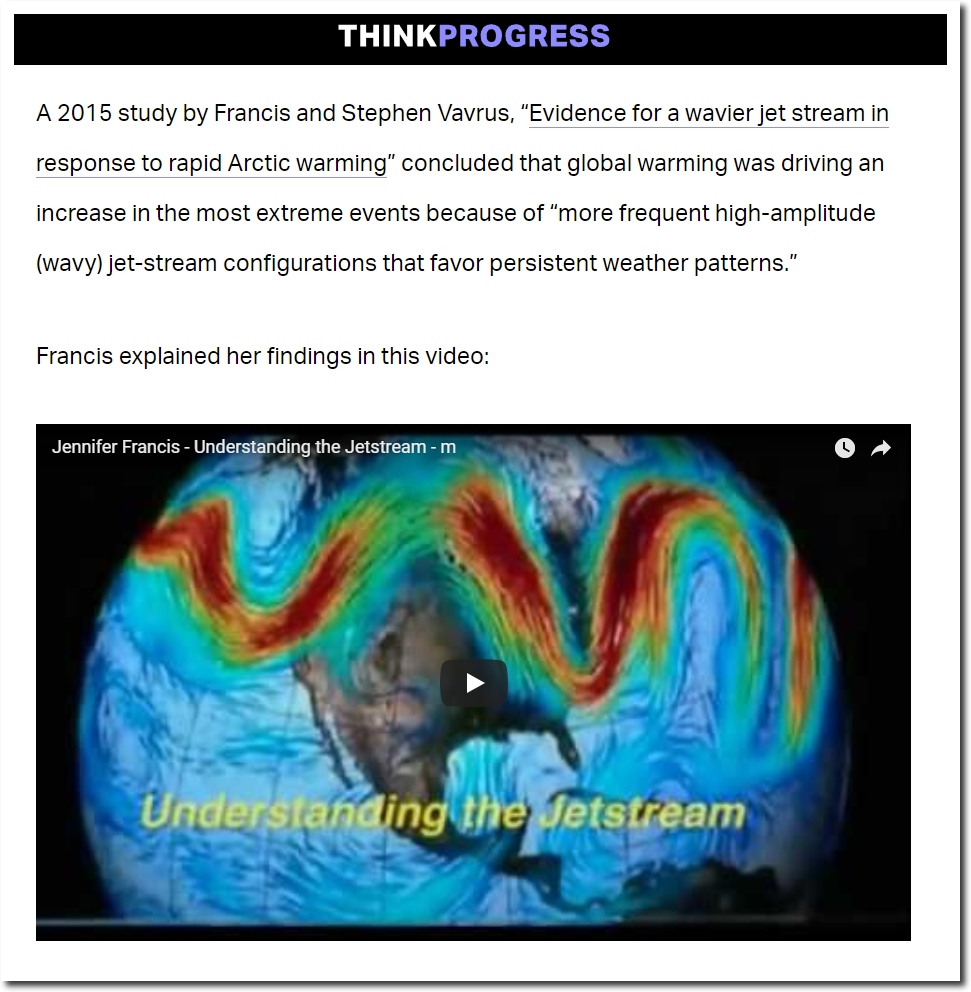
Climate scientists now blame the same weather pattern on global warming.
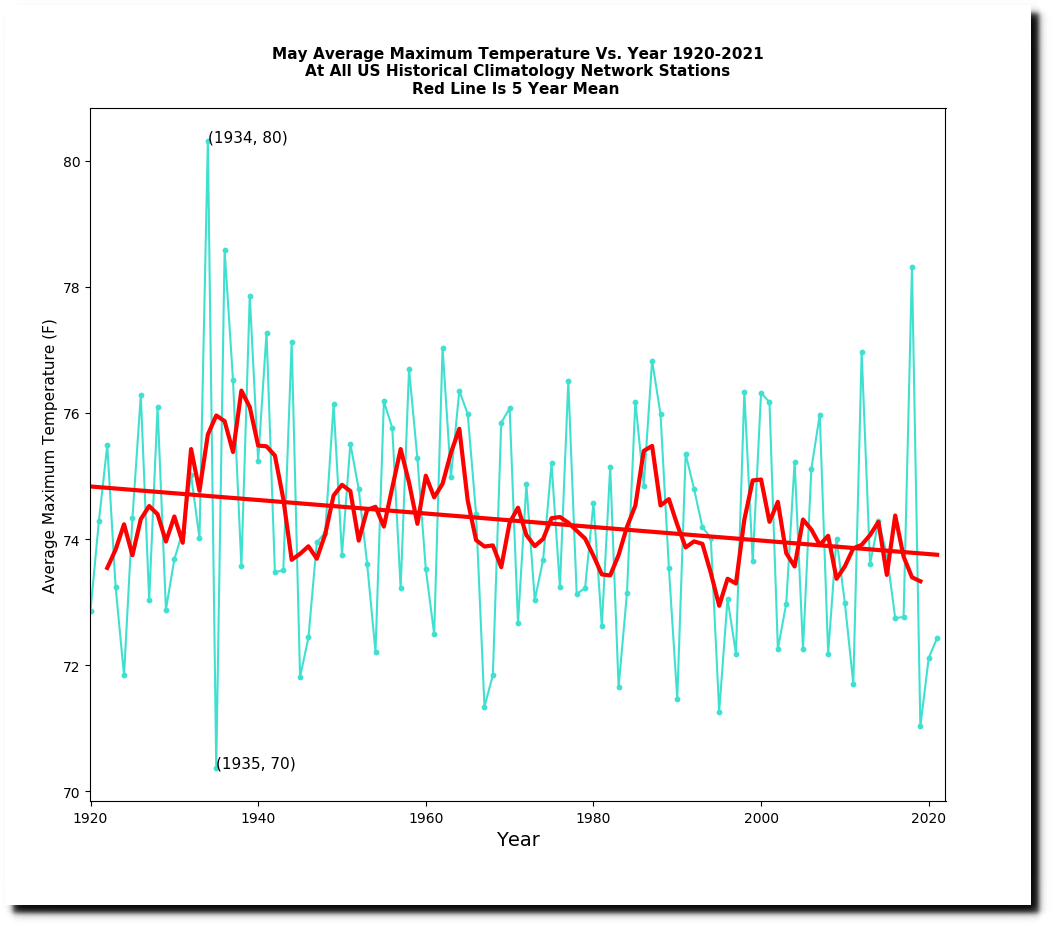
The hottest May in the US occurred in 1934, and the coldest occurred in 1935.
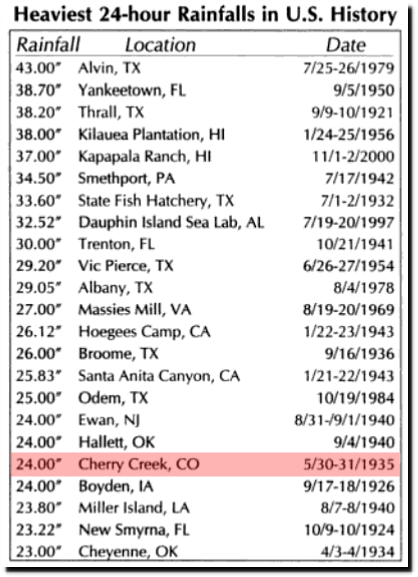
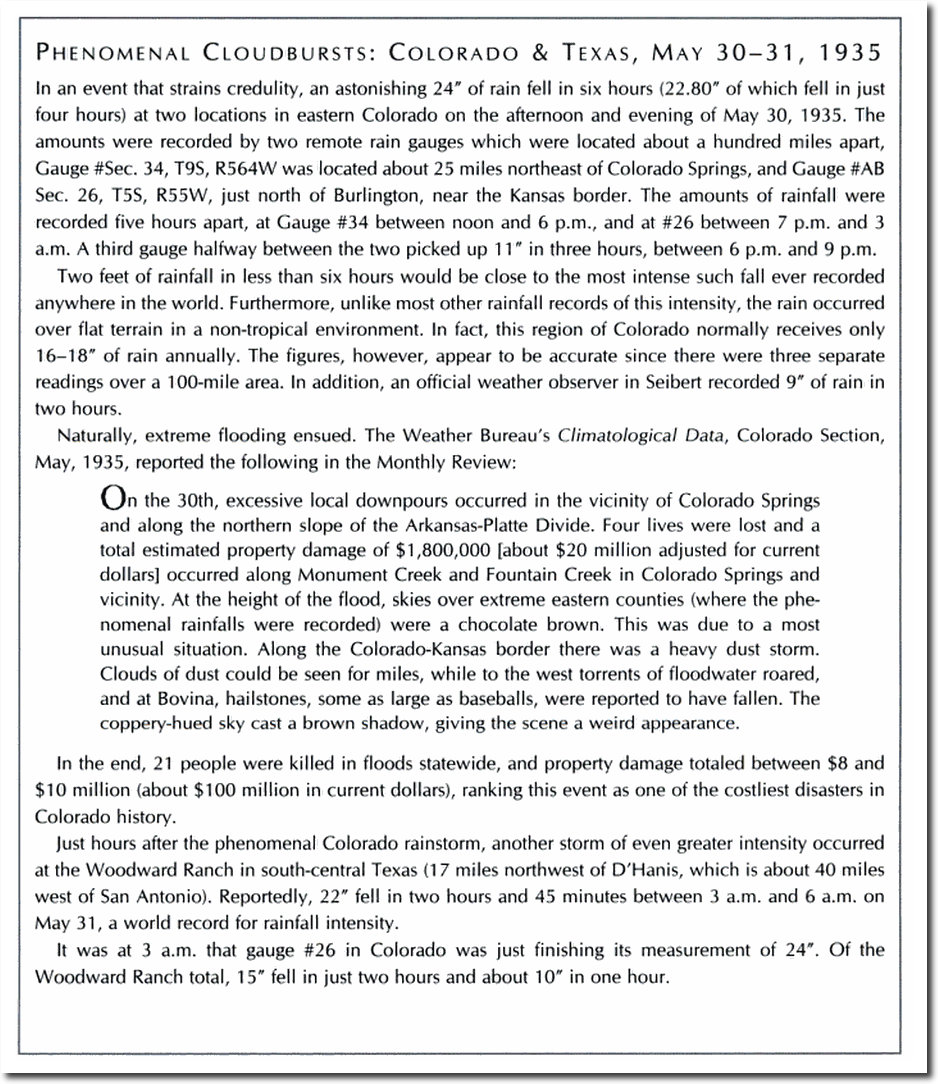
During the coldest May in 1935, world record rainfall occurred in Colorado and Texas.
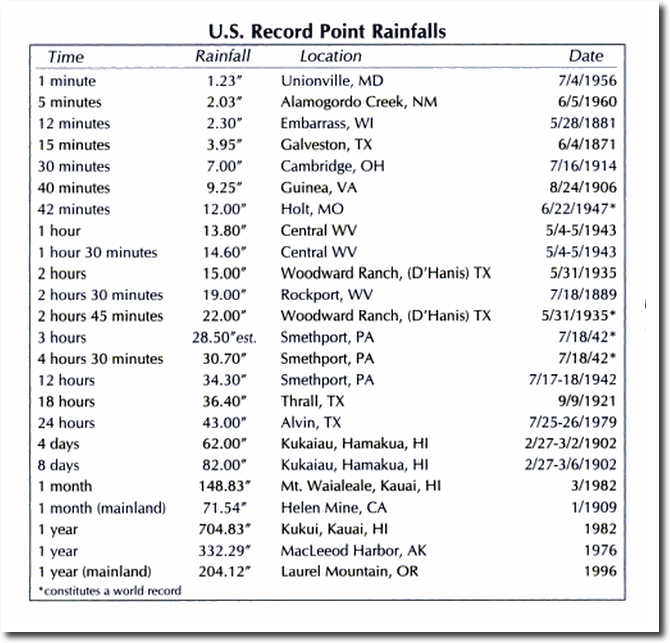
Colorado got nearly that much rain a few hours earlier.
Extreme Weather: A Guide & Record Book – Christopher C. Burt – Google Books

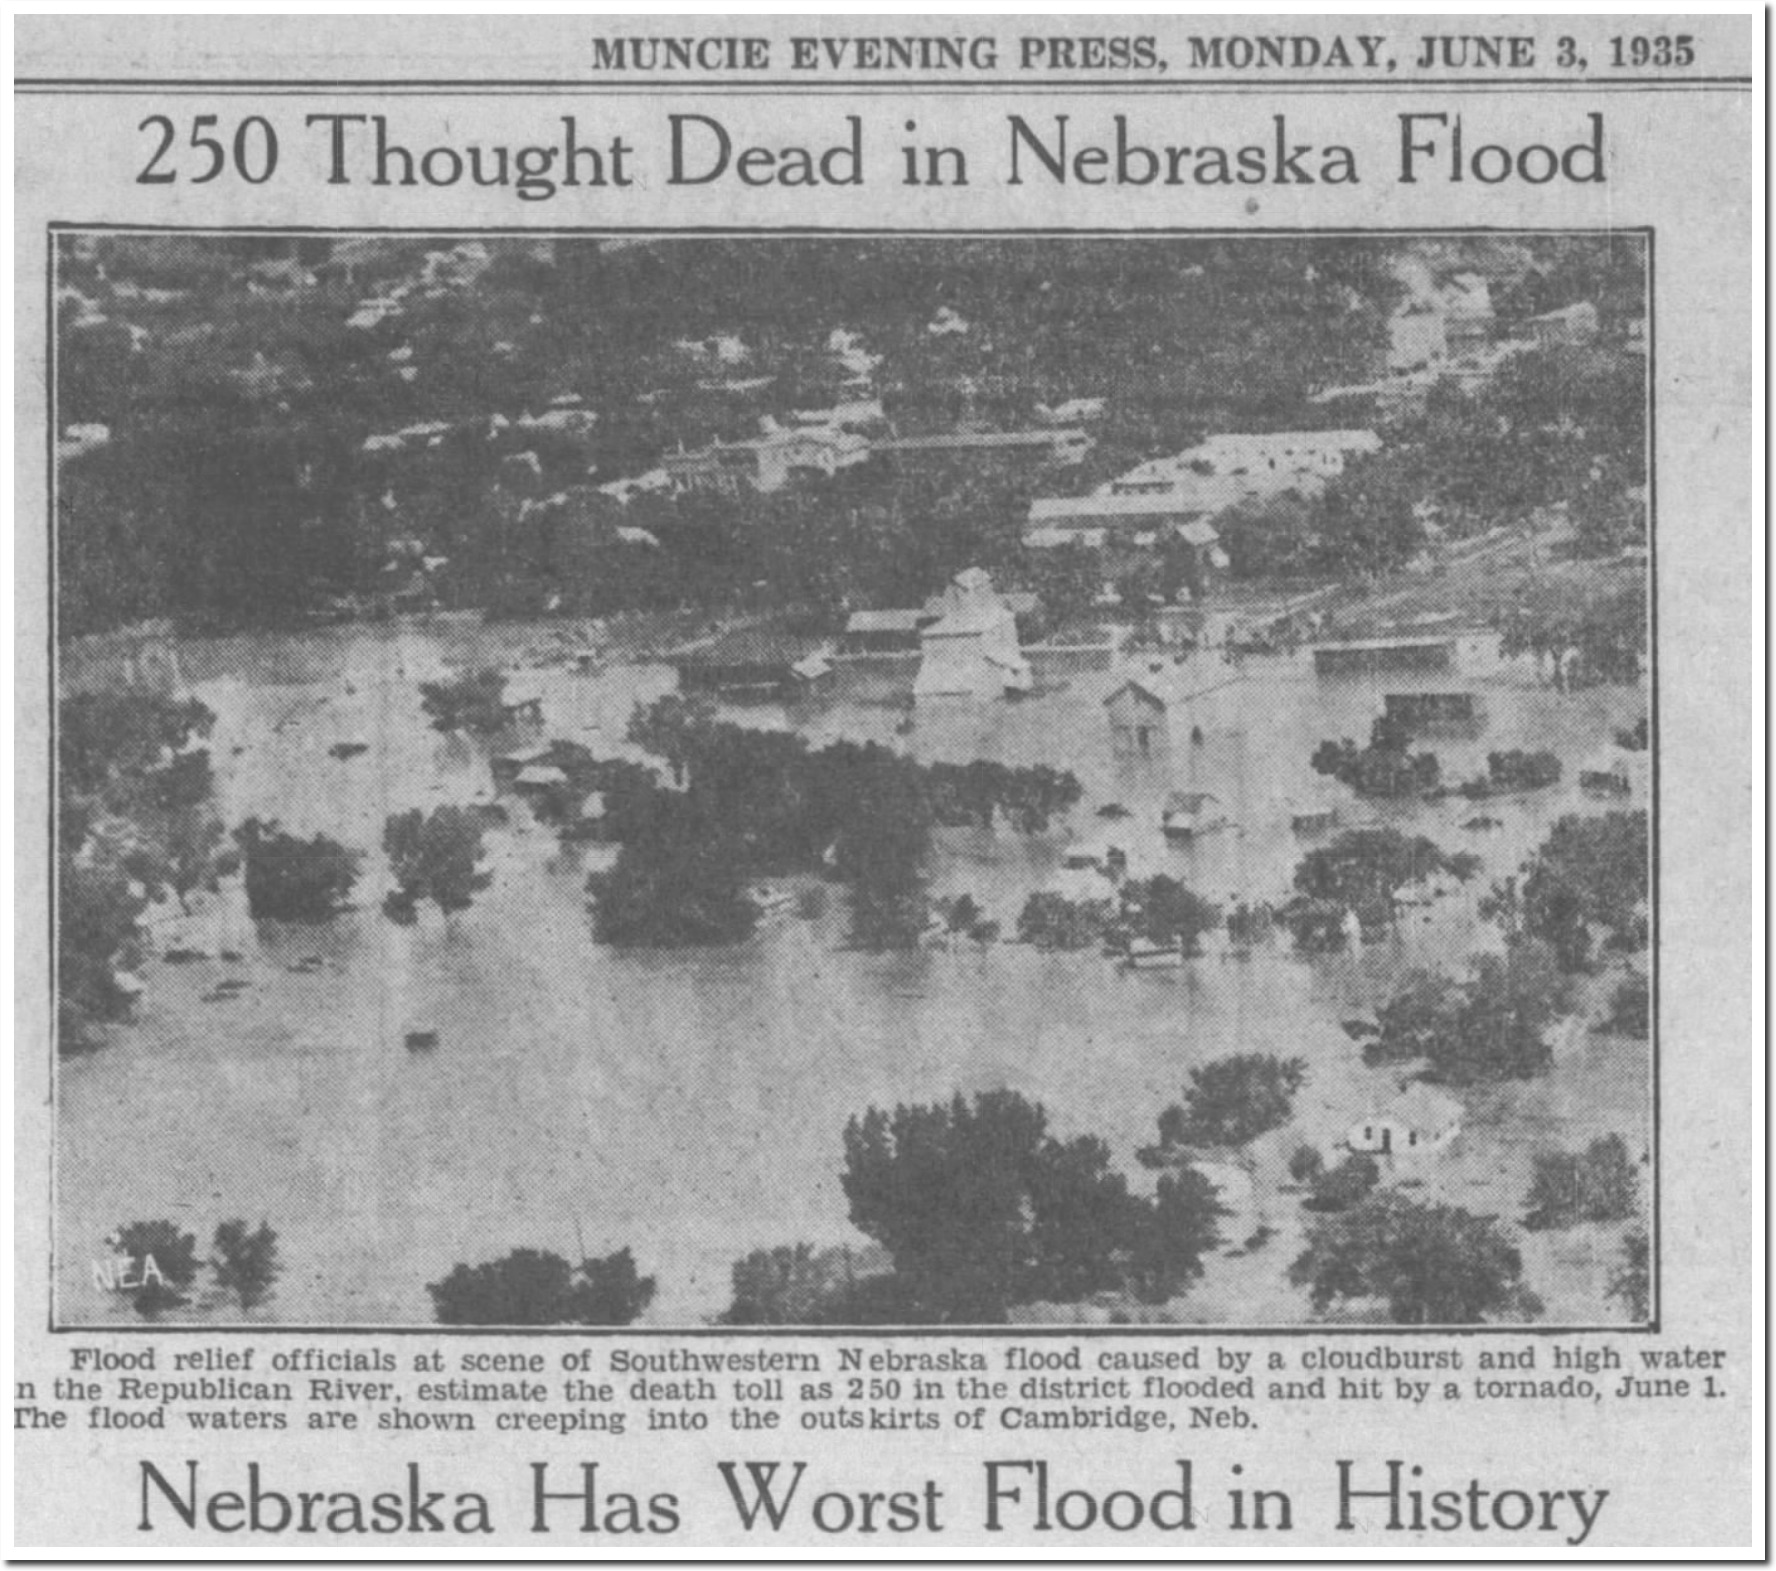
This caused the worst flood in Nebraska’s history.
03 Jun 1935, Page 11 – Muncie Evening Press at Newspapers.com

May precipitation in the US declines with increasing temperature.

India set a record temperature of 124 degrees and received 23 inches of rain in one day in 1935.

08 Jun 1935 – HEAT WAVE – Trove

The warmest May in the US occurred in 1934, and that was also the year of the worst drought.
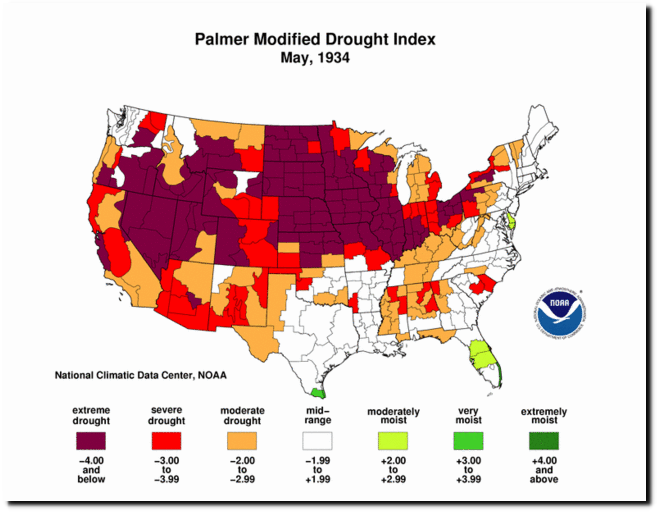
Precipitation is generally associated with cold fronts, because cold air can’t hold as much moisture as warm air. Warm air is associated with drought.


Posted in Uncategorized | Leave a comment

Extreme Fraud At NOAA And NASA

Posted in Uncategorized | Leave a comment

Climate Apocalypse Sunday

Posted in Uncategorized | Leave a comment

Extreme Rainfall

Posted in Uncategorized | Leave a comment

“Inclusion And Respect”

“Respect and inclusion”

Posted in Uncategorized | Leave a comment

Extreme Fraud At NOAA

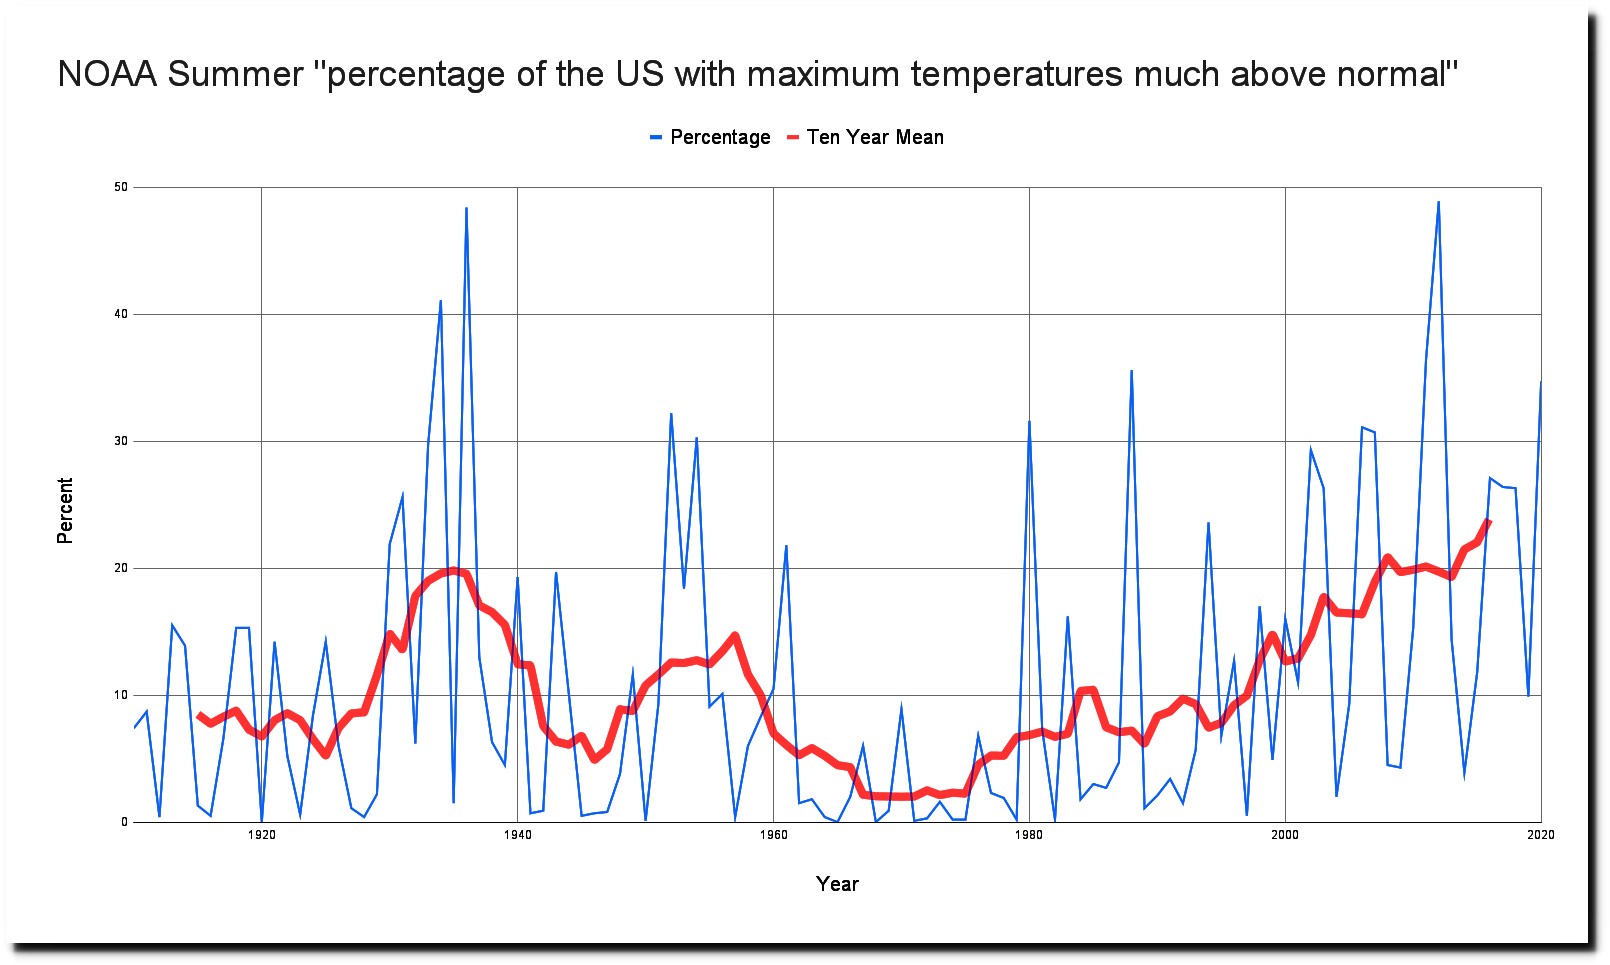
NOAA’s Climate Extremes Index shows summer afternoon temperatures much above normal are affecting more and more of the US, with the past decade was highest on record.

They show an upwards trend beginning around fifty years ago.

U.S. Climate Extremes Index (CEI) | Extremes | National Centers for Environmental Information (NCEI)

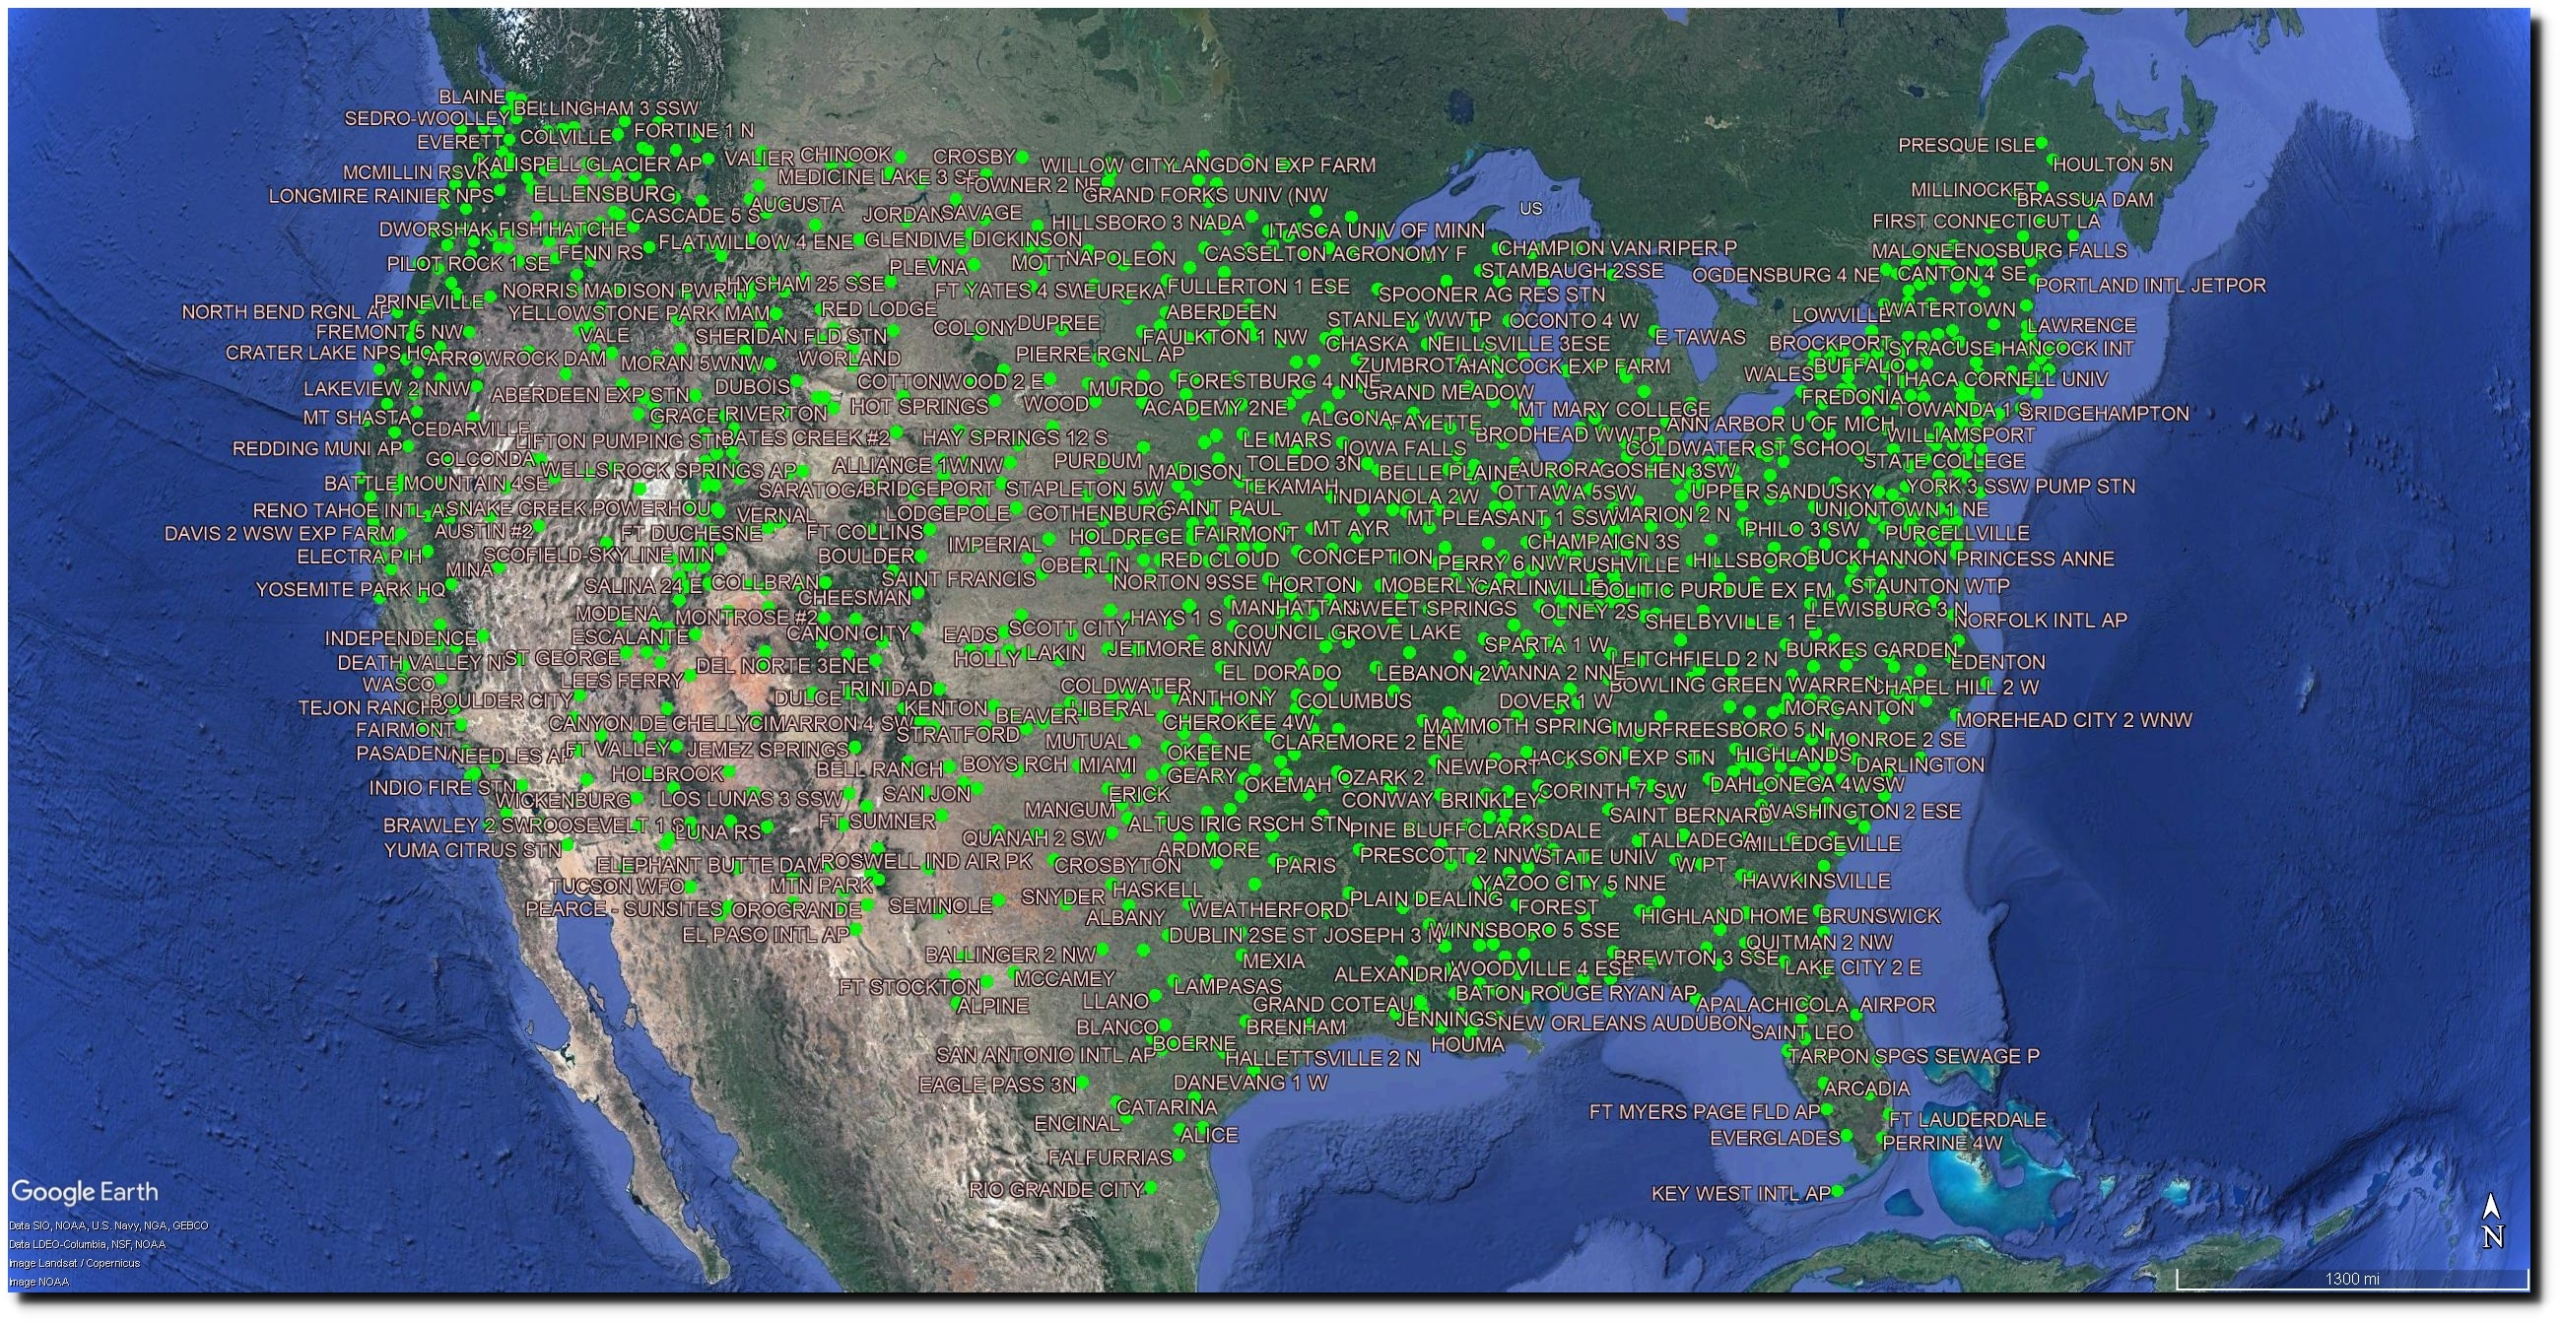
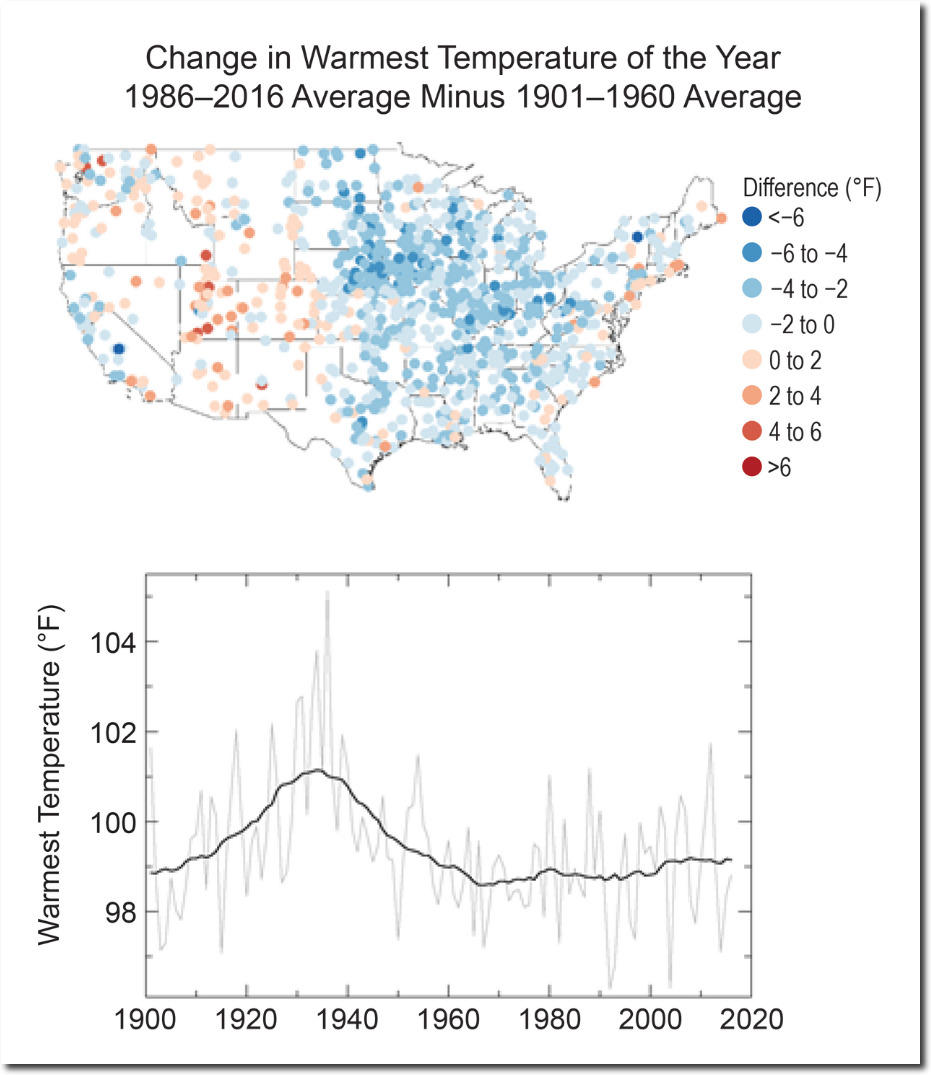
But their thermometer data shows the exact opposite, as does the National Climate Assessment. There are 1,218 stations in the United States Historical Climatology Network.

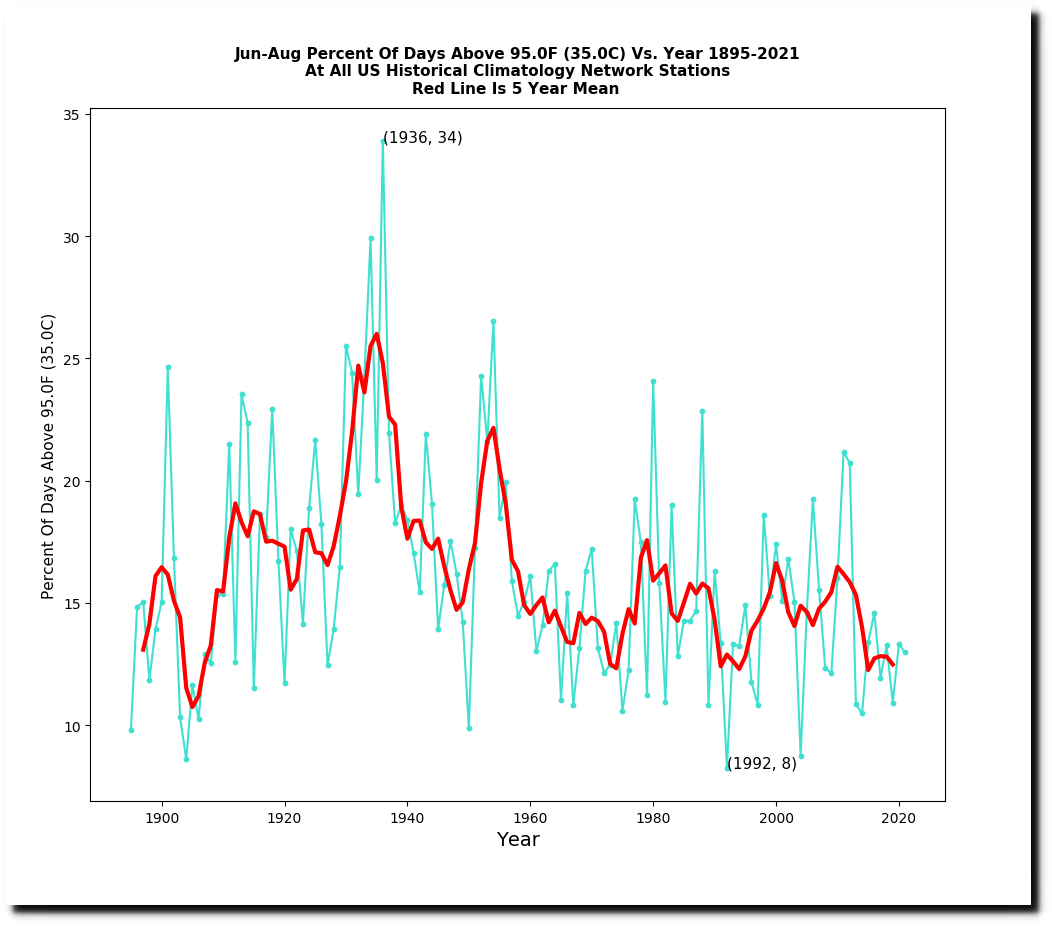
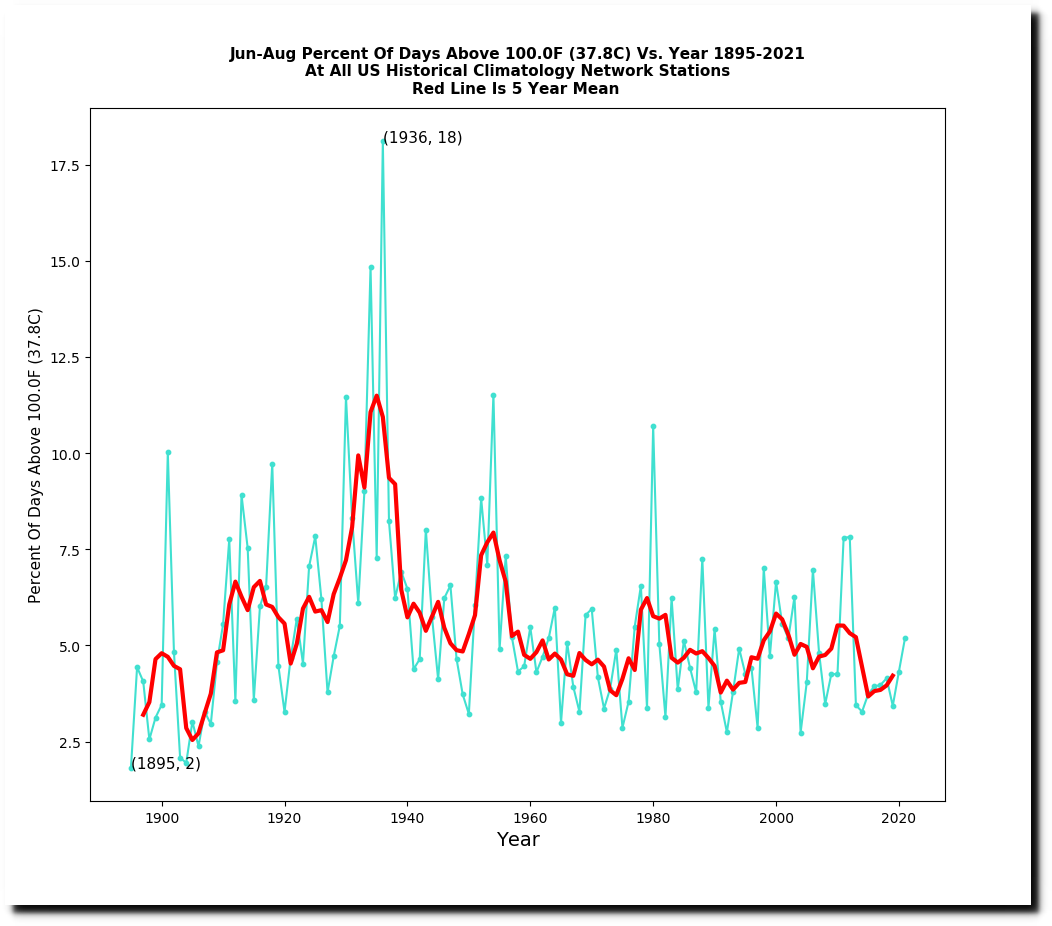
The percentage of stations reaching 95F sometime during the summer has declined sharply over the past ninety years.


So has the frequency of hot days.


Temperature Changes in the United States – Climate Science Special Report

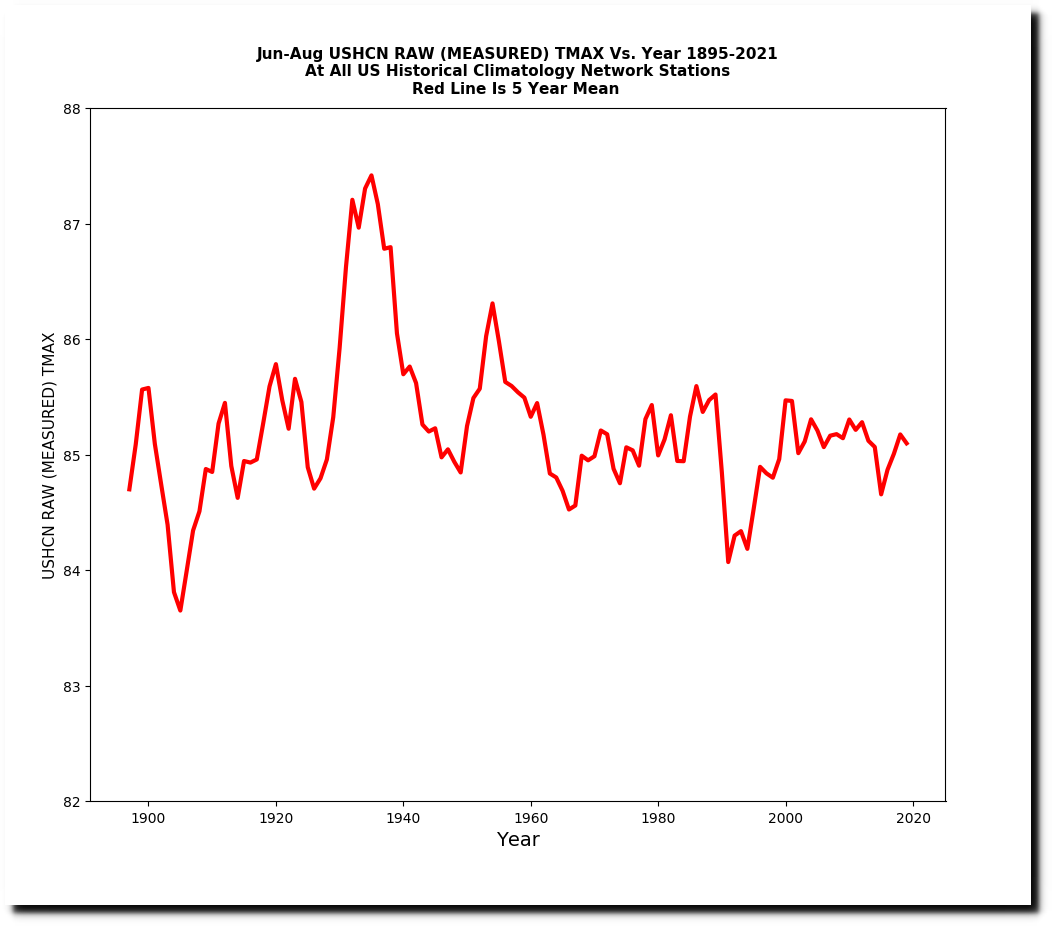
Here is how they reversed the trend. This is the NOAA daily temperature data for the US.

ftp://ftp.ncdc.noaa.gov/pub/data/ghcn/daily/ghcnd_hcn.tar.gz

Their raw monthly data set is nearly identical.

ftp://ftp.ncdc.noaa.gov/pub/data/ushcn/v2.5/ushcn.tmax.latest.raw.tar.gz

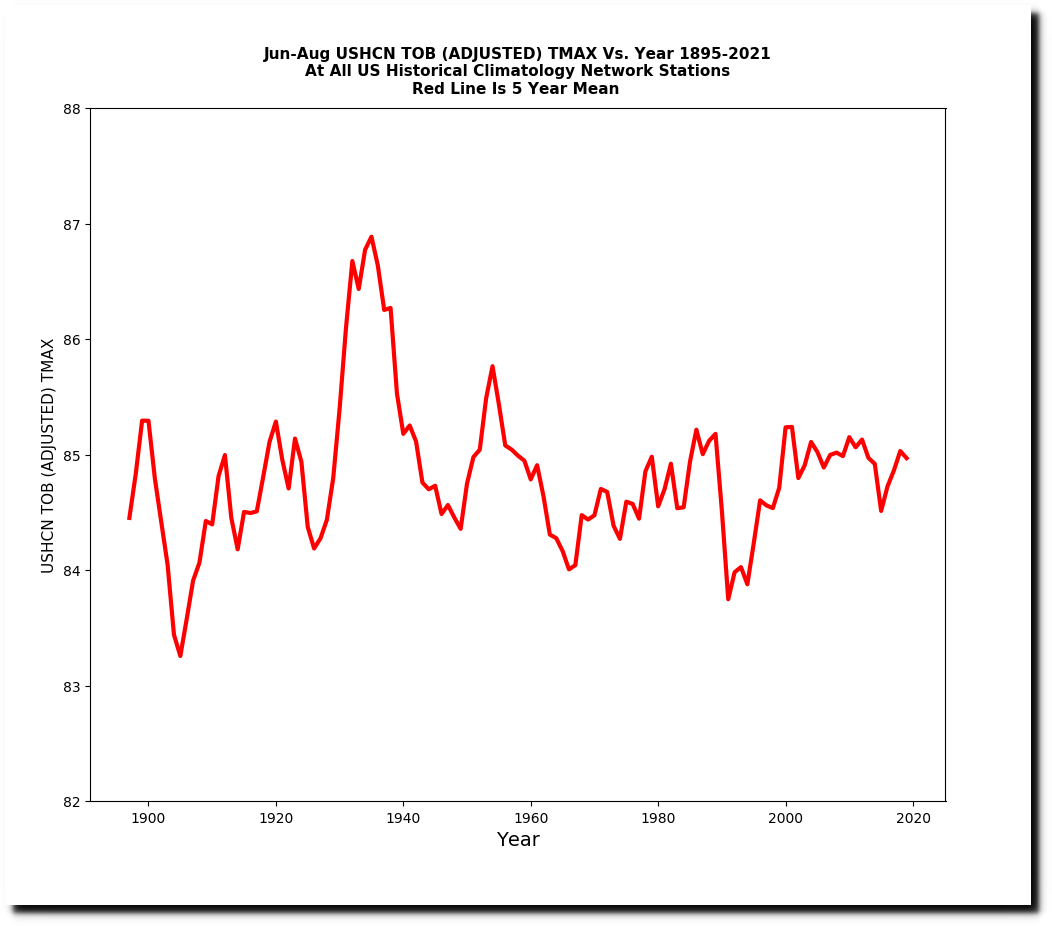
Time of Observation Bias adjusted data is not much different.

ftp://ftp.ncdc.noaa.gov/pub/data/ushcn/v2.5/ushcn.tmax.latest.tob.tar.gz

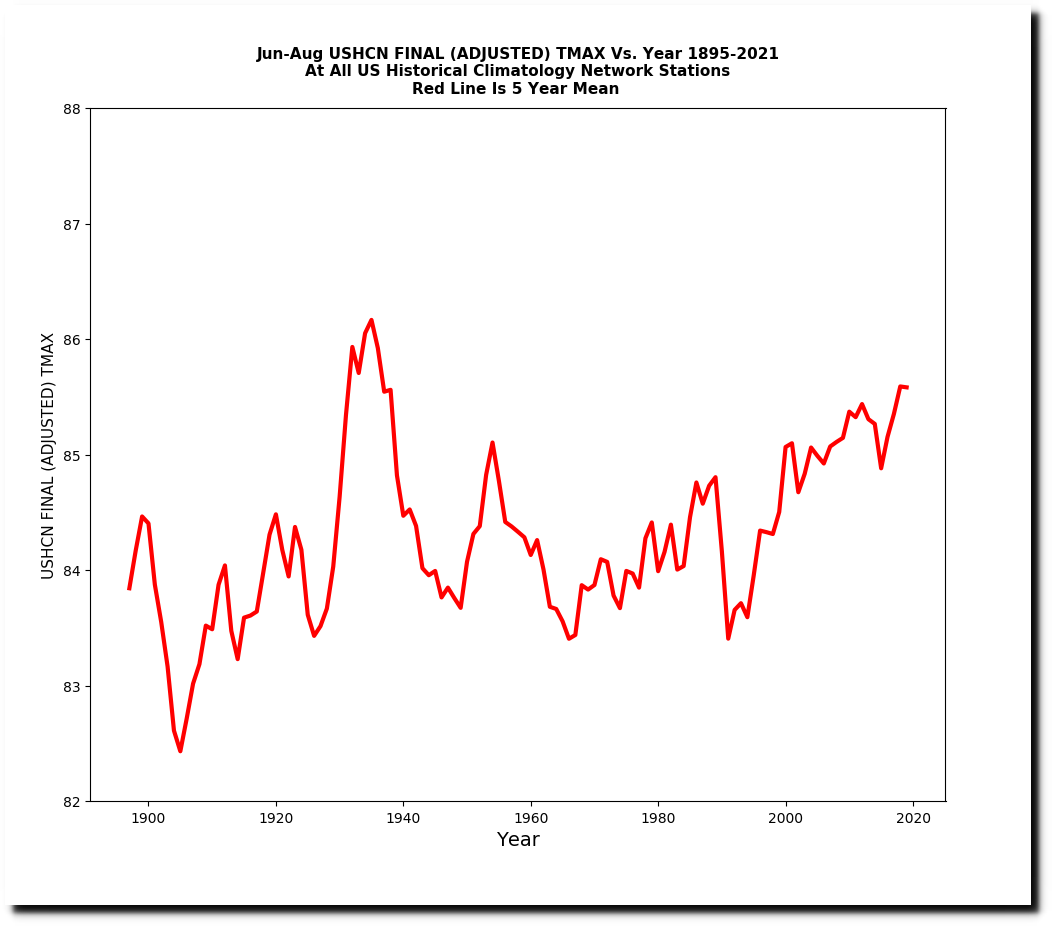
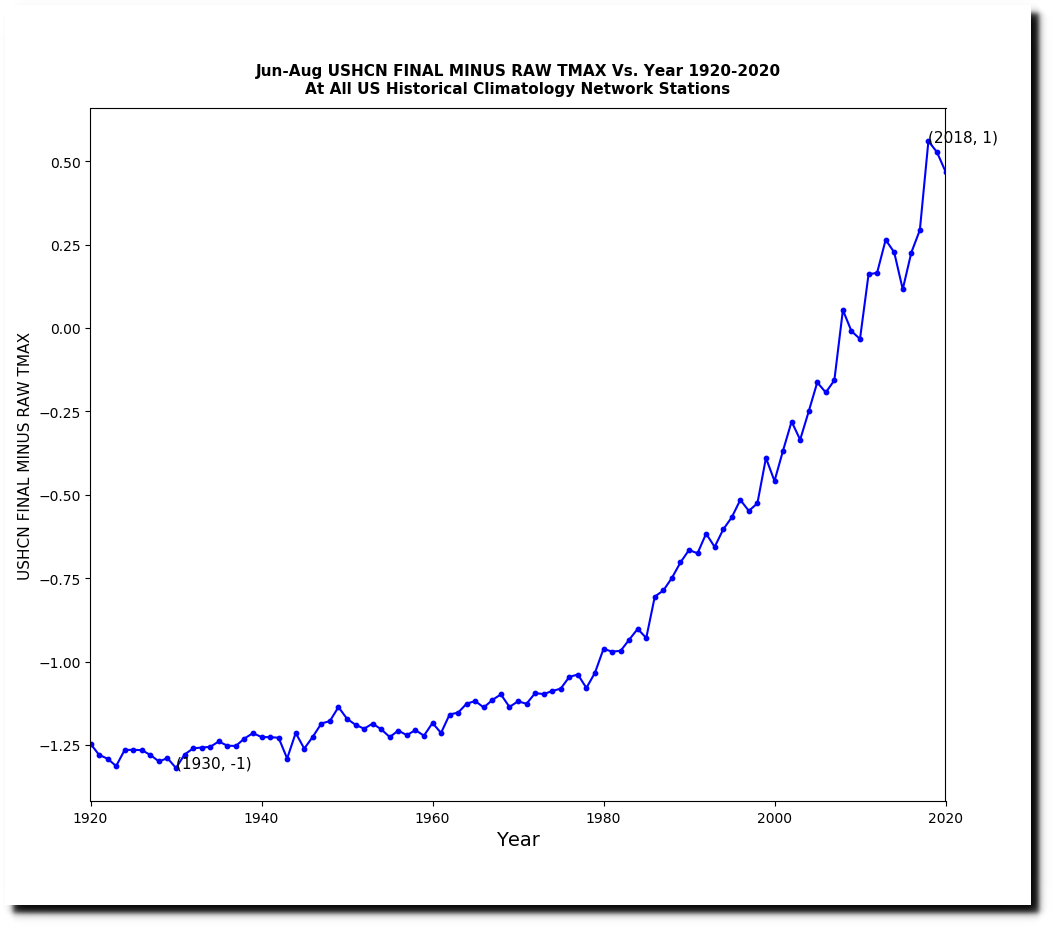
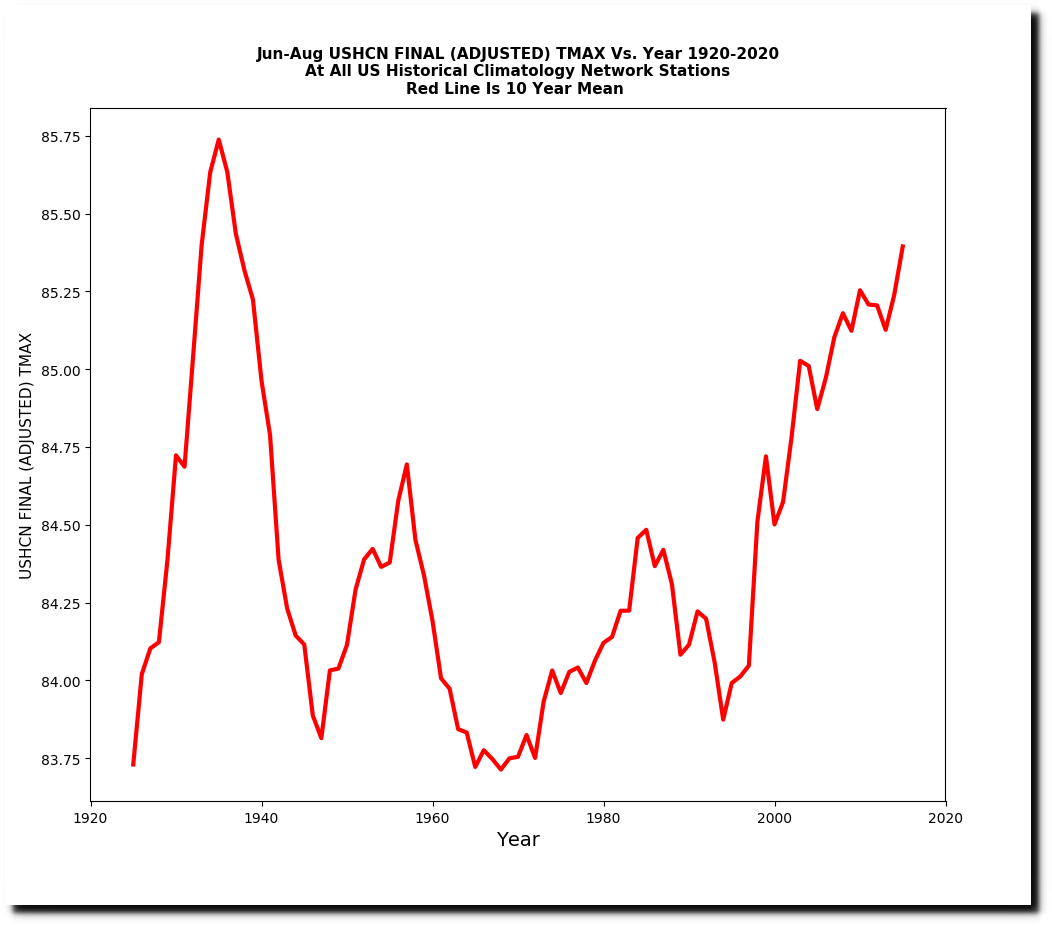
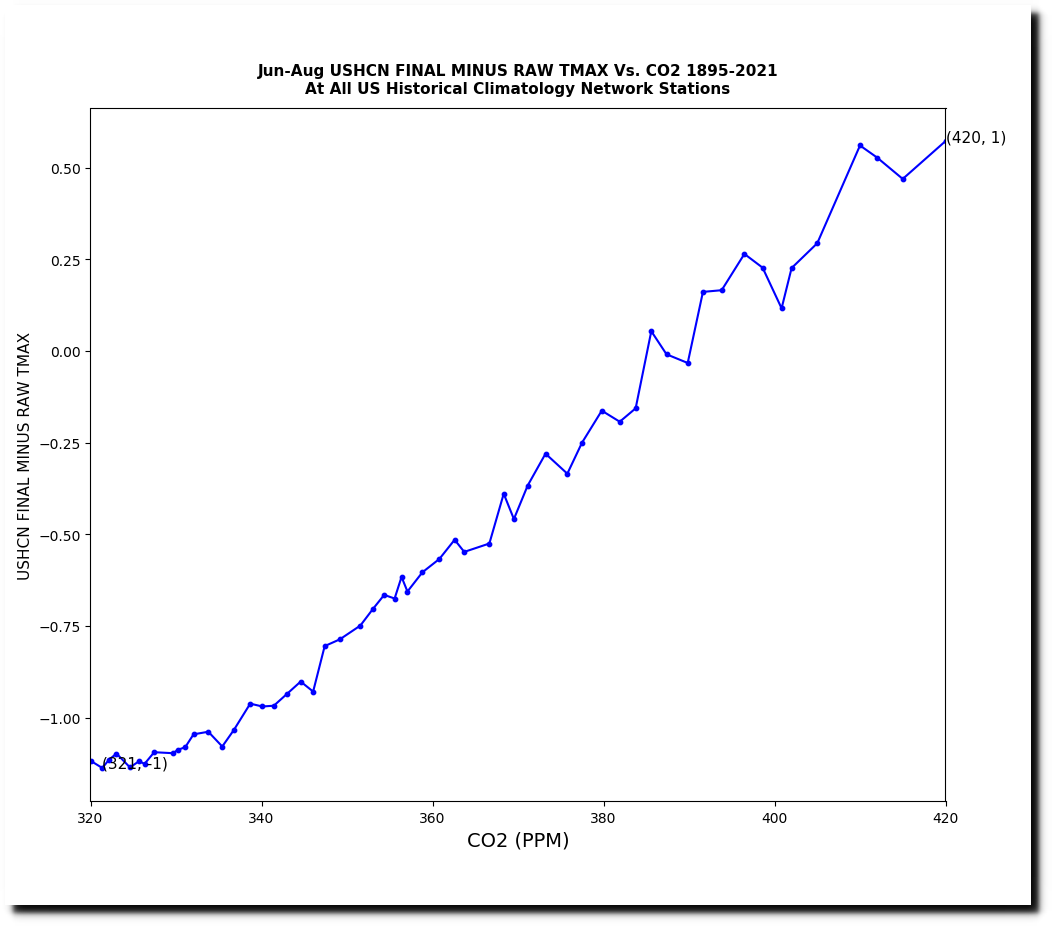
But the final adjusted data set shows a strong warming trend over the past fifty years.

ftp://ftp.ncdc.noaa.gov/pub/data/ushcn/v2.5/ushcn.tmax.latest.tob.tar.gz

The final data set has diverged from the measured data by almost two degrees over the past forty years.

This warming trend since 1970 does not exist in the thermometer data, so where does it come from?

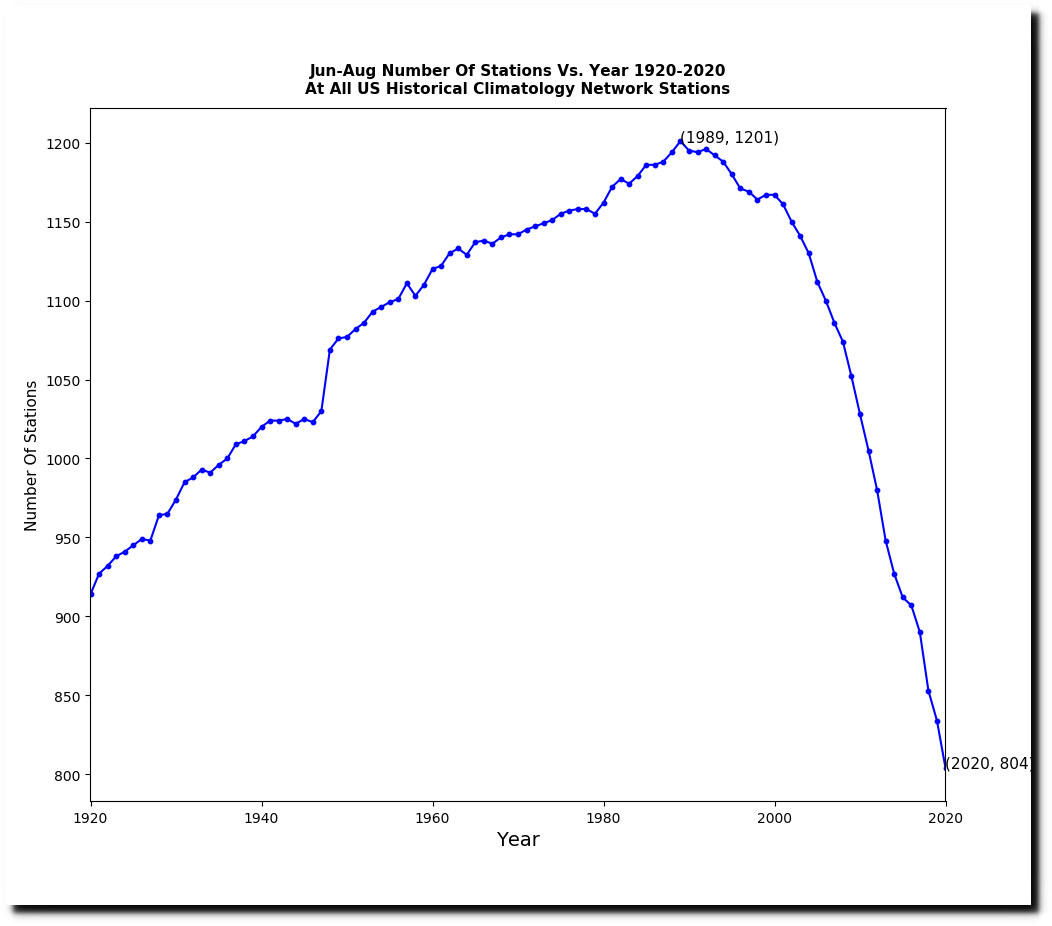
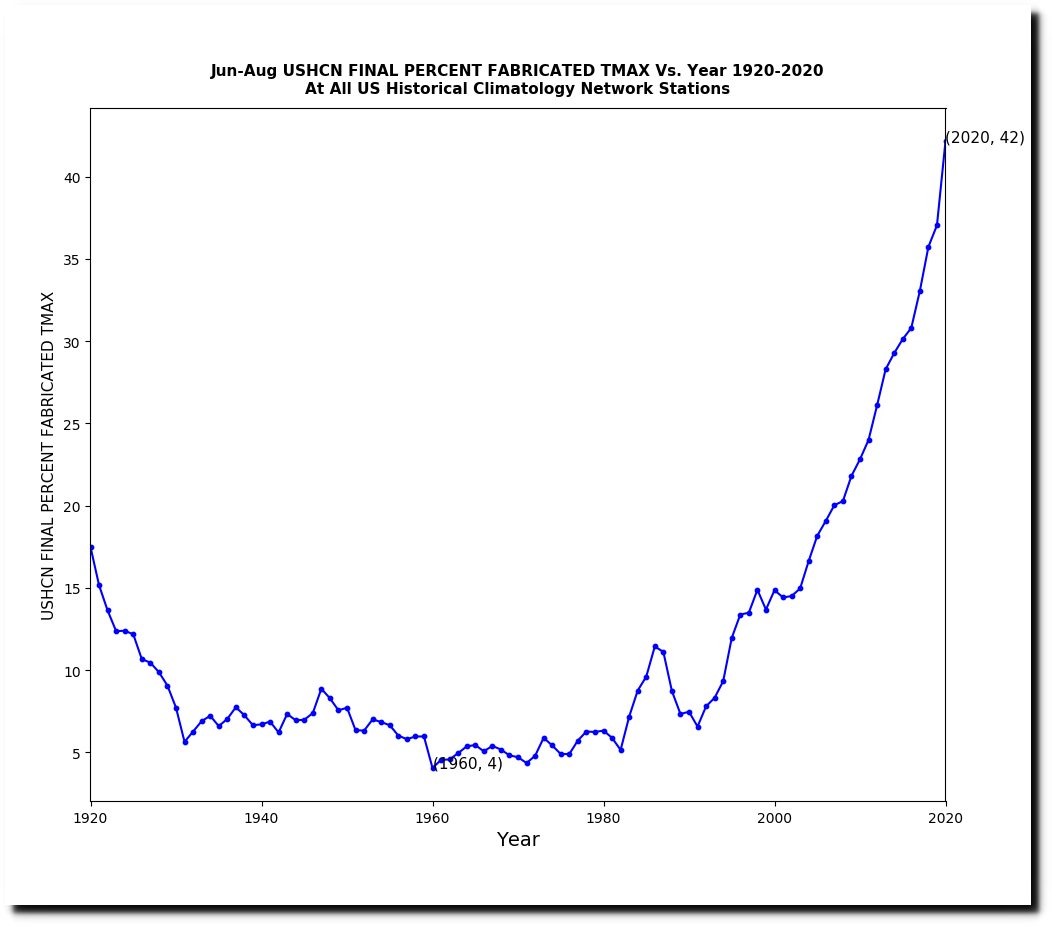
There has been a large decrease in the number of stations reporting data over the past 30 years. But in the final adjusted data set, they use temperatures for all 1,218 stations regardless of whether or not there is actually any thermometer data.

In other words, they are simply making up data.  More than 40% of the data in the final data set is now fabricated.

The fabricated data has three degrees of warming,  and that accounts for the entire warming trend.

NOAA US temperature graphs are completely fraudulent, and they are being adjusted upwards to track CO2.

Posted in Uncategorized | Leave a comment

The World’s Second Largest Ponzi Scheme

“Critically, the study found that vaccinated individuals carried as much virus in their noses as unvaccinated individuals, and that vaccinated people could spread the virus to each other.”

Washington Post

Posted in Uncategorized | Leave a comment

Elections Have Consequences

Posted in Uncategorized | Leave a comment

Government Climate Extremes

Posted in Uncategorized | Leave a comment

The NOAA Climate Extremes Index

According to NOAA, the area of the US experiencing extreme maximum summer temperatures has greatly increased over the past fifty years.

“The sum of (a) percentage of the United States with maximum temperatures much below normal and (b) percentage of the United States with maximum temperatures much above normal.”

U.S. Climate Extremes Index (CEI) | Extremes | National Centers for Environmental Information (NCEI)

According to NOAA, the past decade has been  the hottest on record.

Their own data shows the exact opposite.

The National Climate Assessment also shows the exact opposite.


Temperature Changes in the United States – Climate Science Special Report

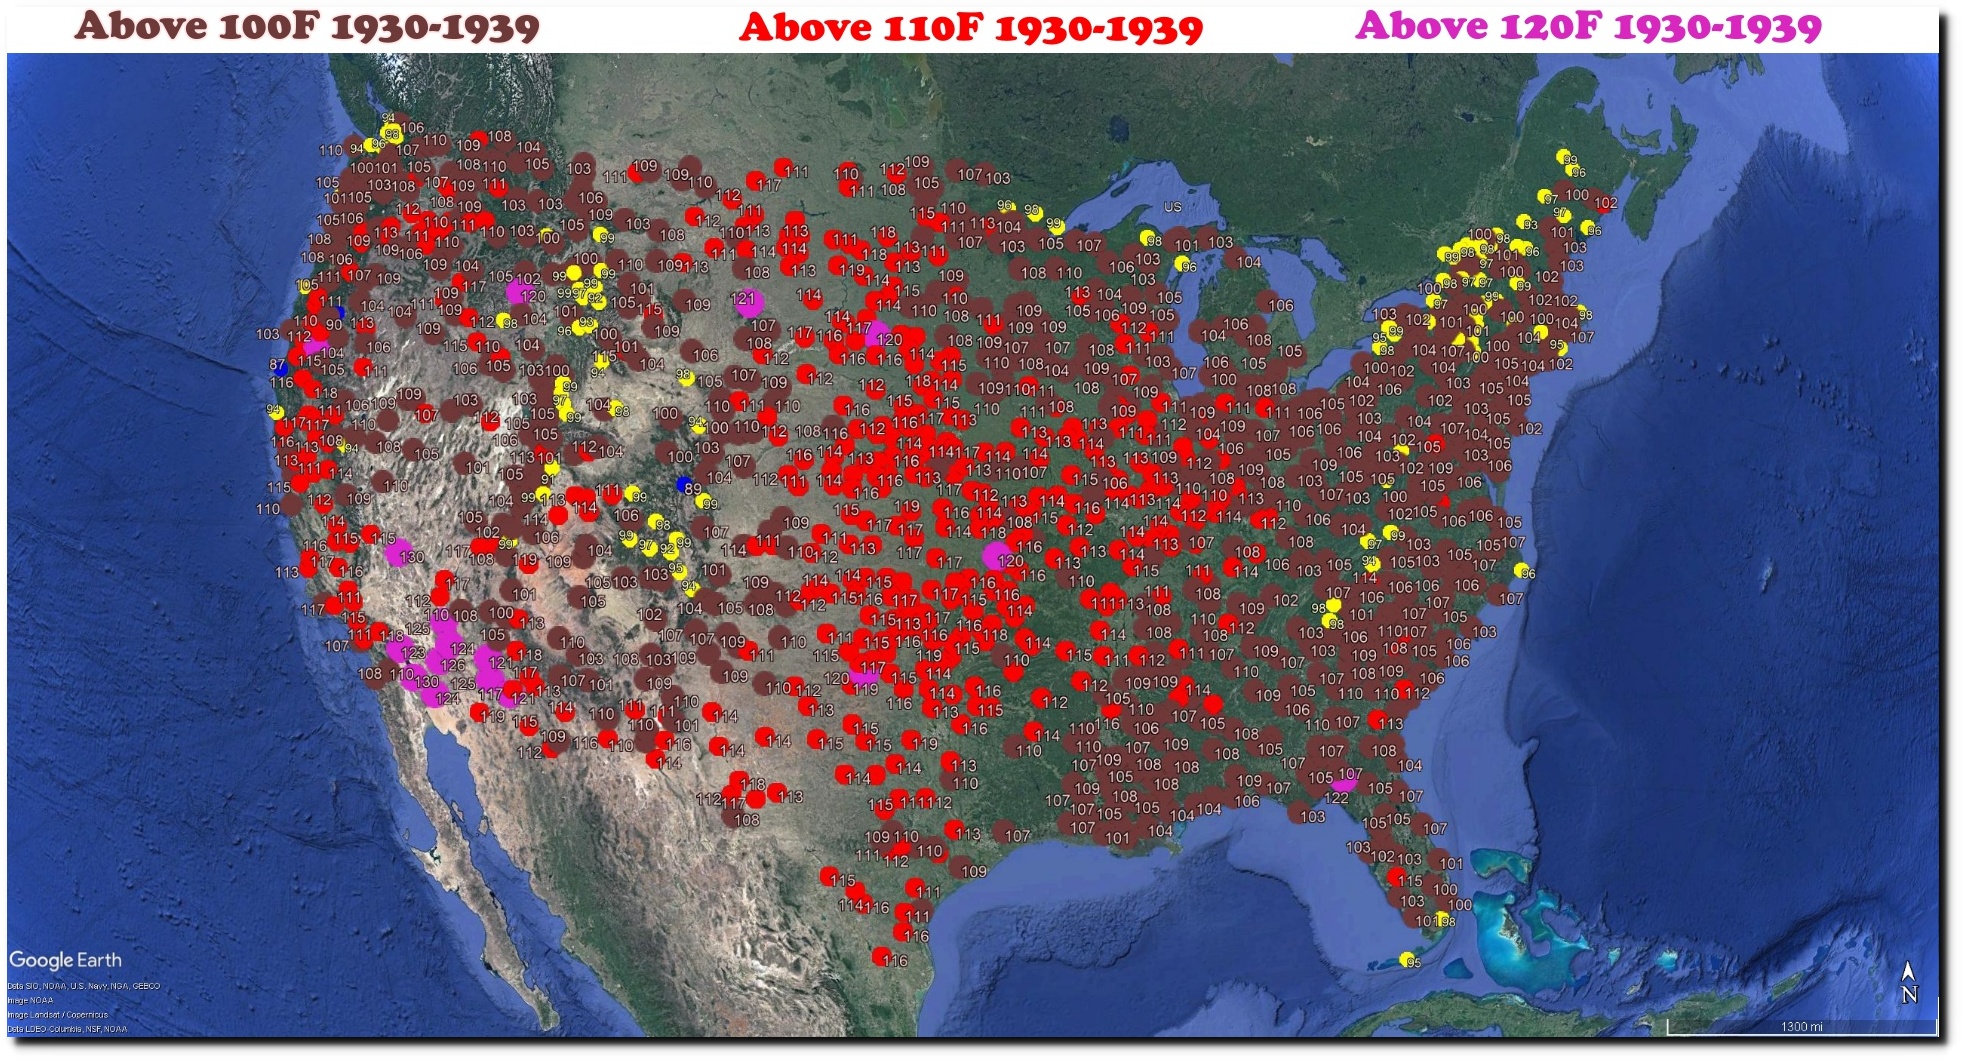
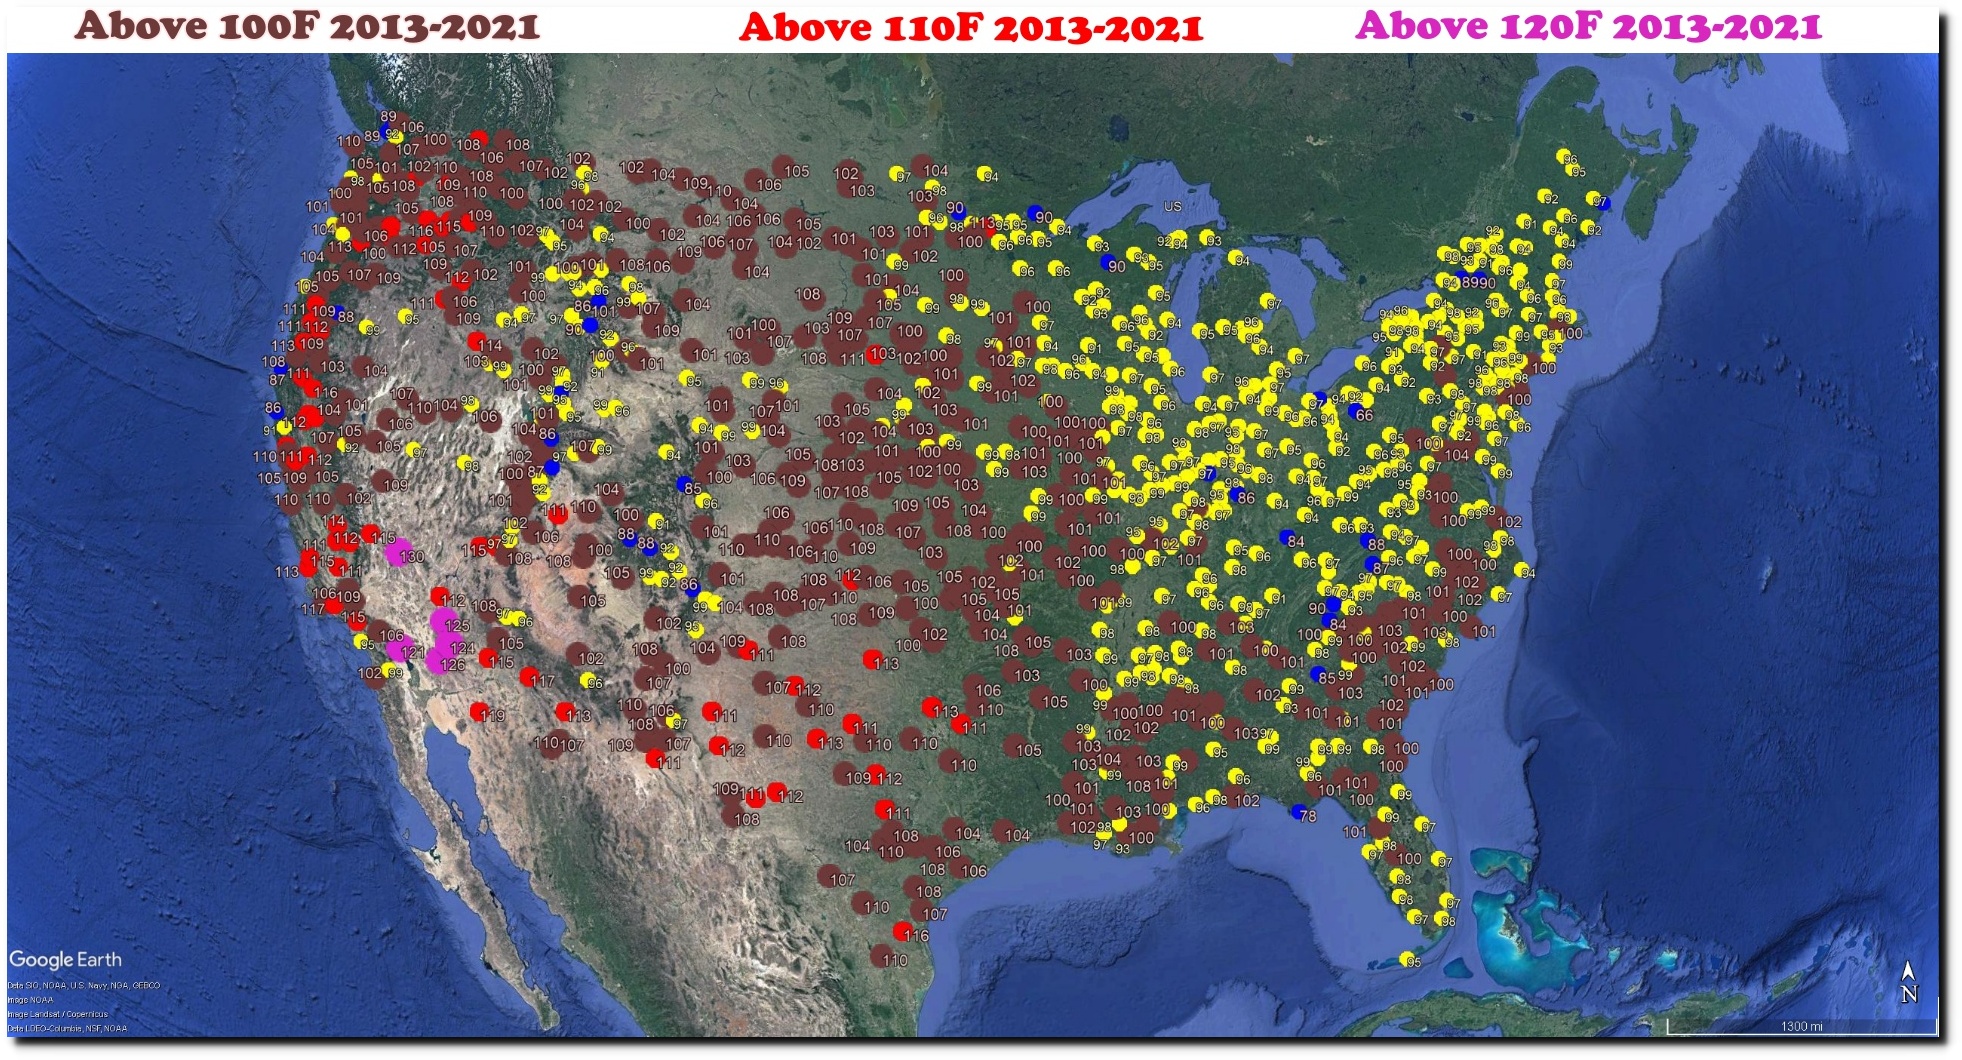
The 1930s were much hotter than recent years. There is no comparison.

Posted in Uncategorized | Leave a comment