
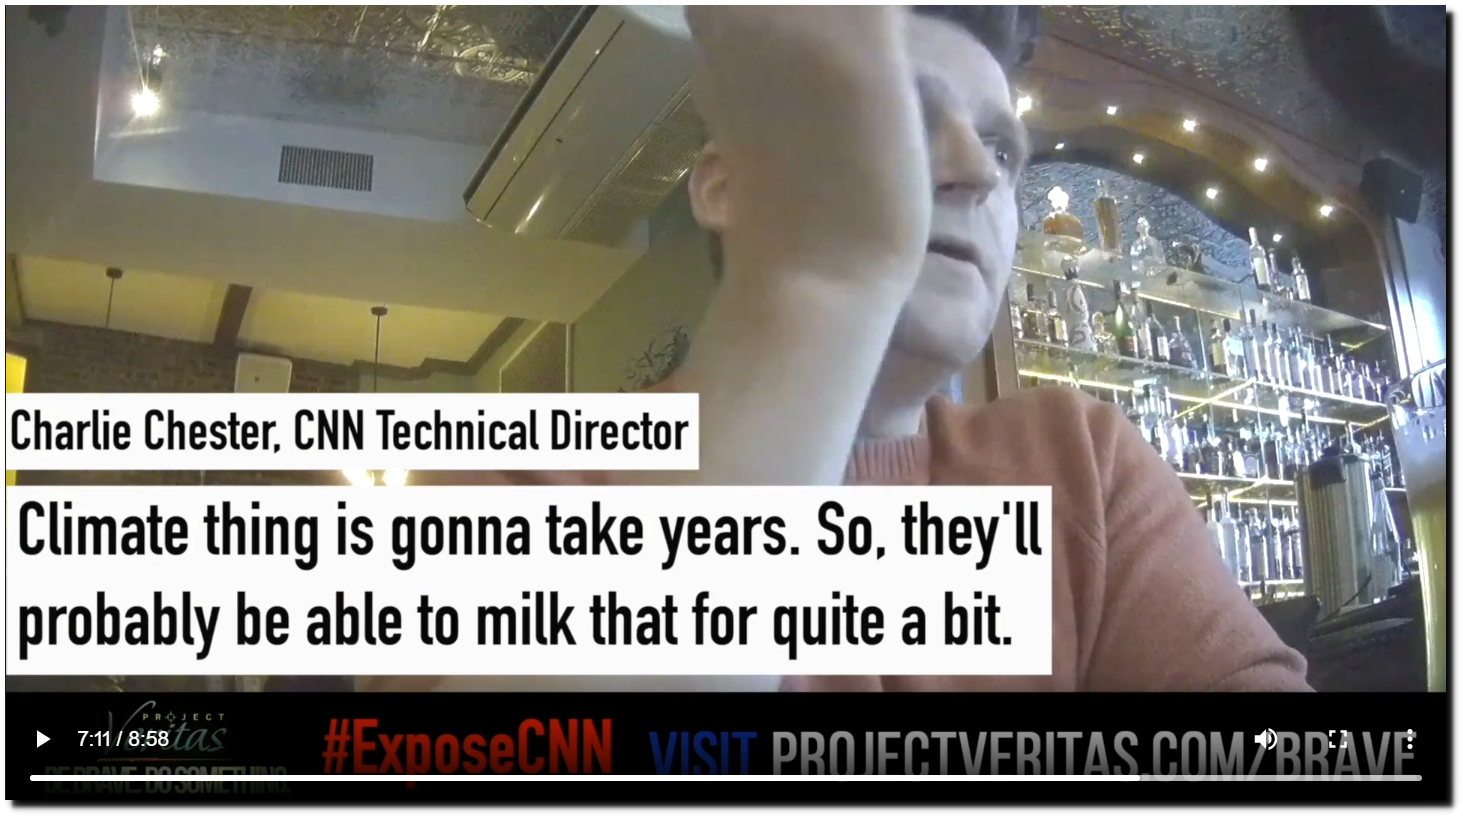
“The media is the most powerful entity on earth. They have the power to make the innocent guilty and to make the guilty innocent, and that’s power. Because they control the minds of the masses.”
– Malcolm X
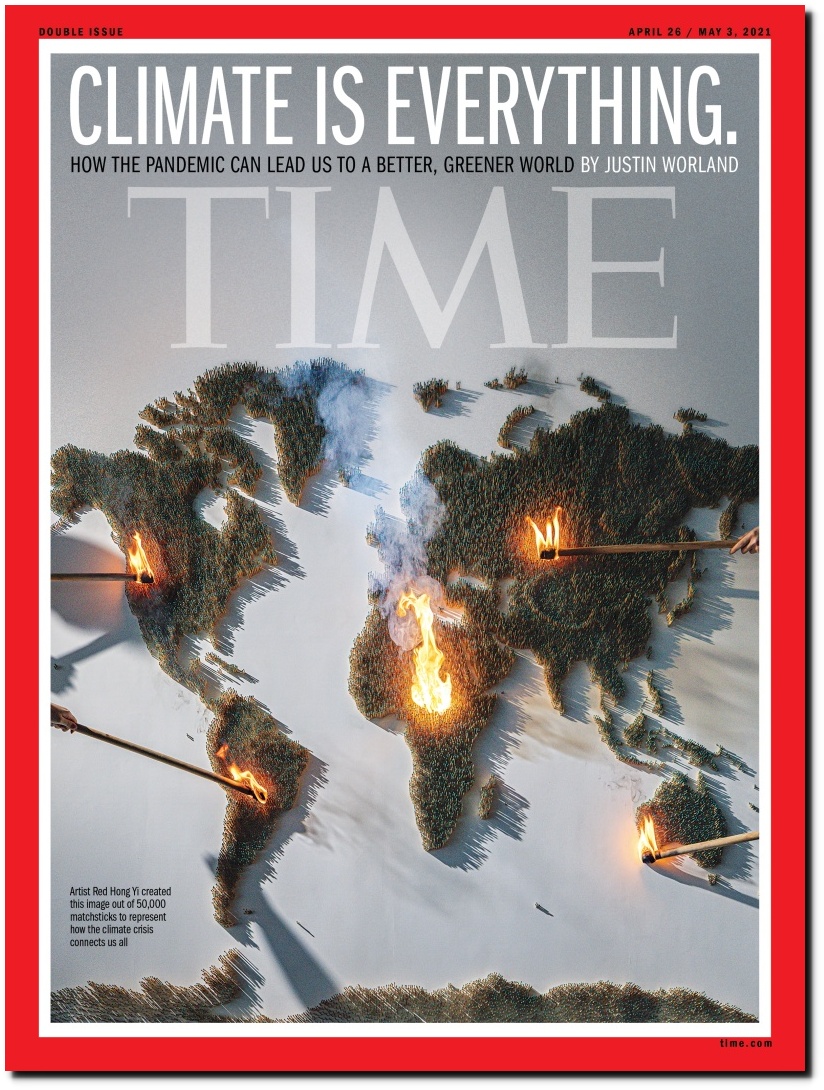
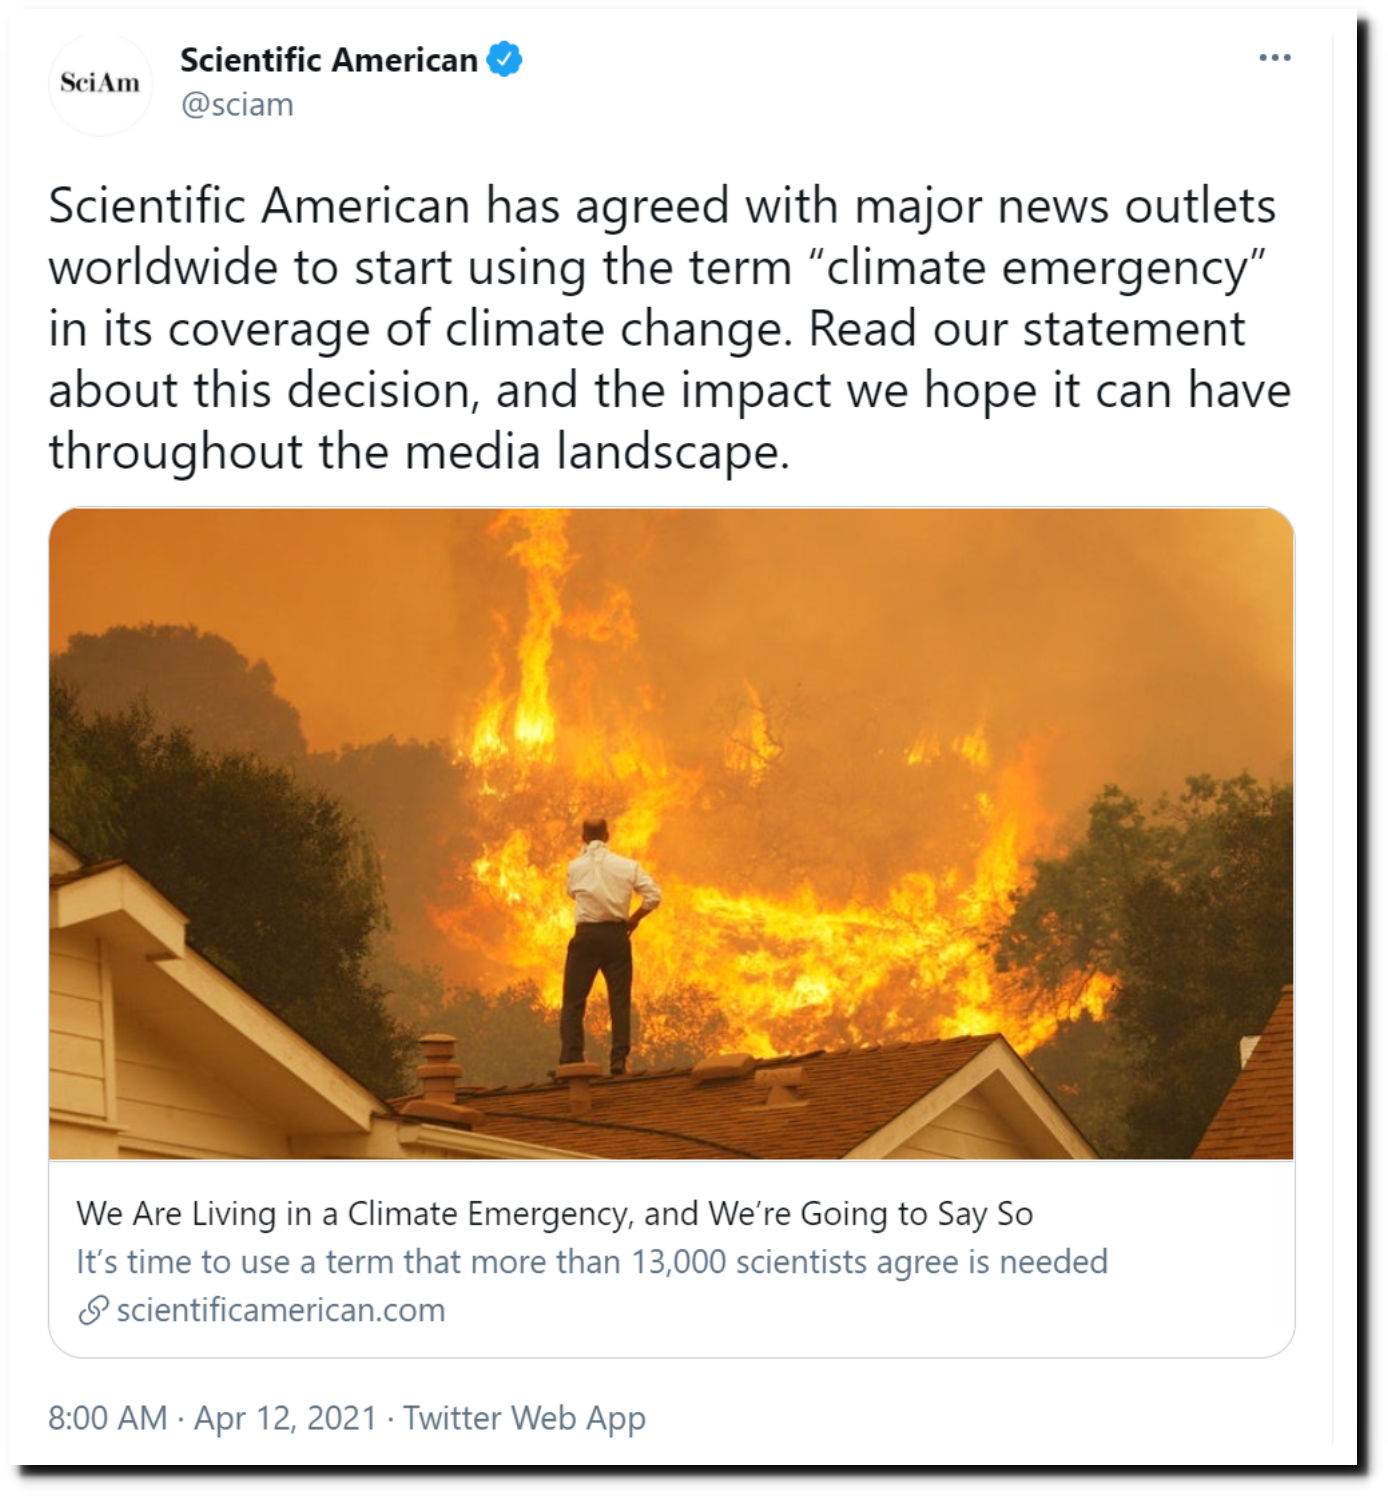
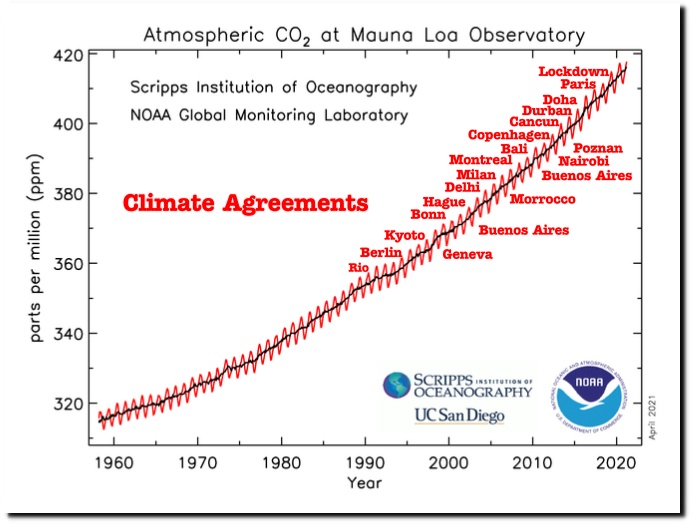
We are experiencing a barrage of anti-CO2 propaganda designed to make people believe they will burn up or drown if they don’t give up the energy supply they depend on for their day to day survival, and submit to permanent lockdowns.


India’s Monsoon Becoming Wetter, More Chaotic Because of Climate Change

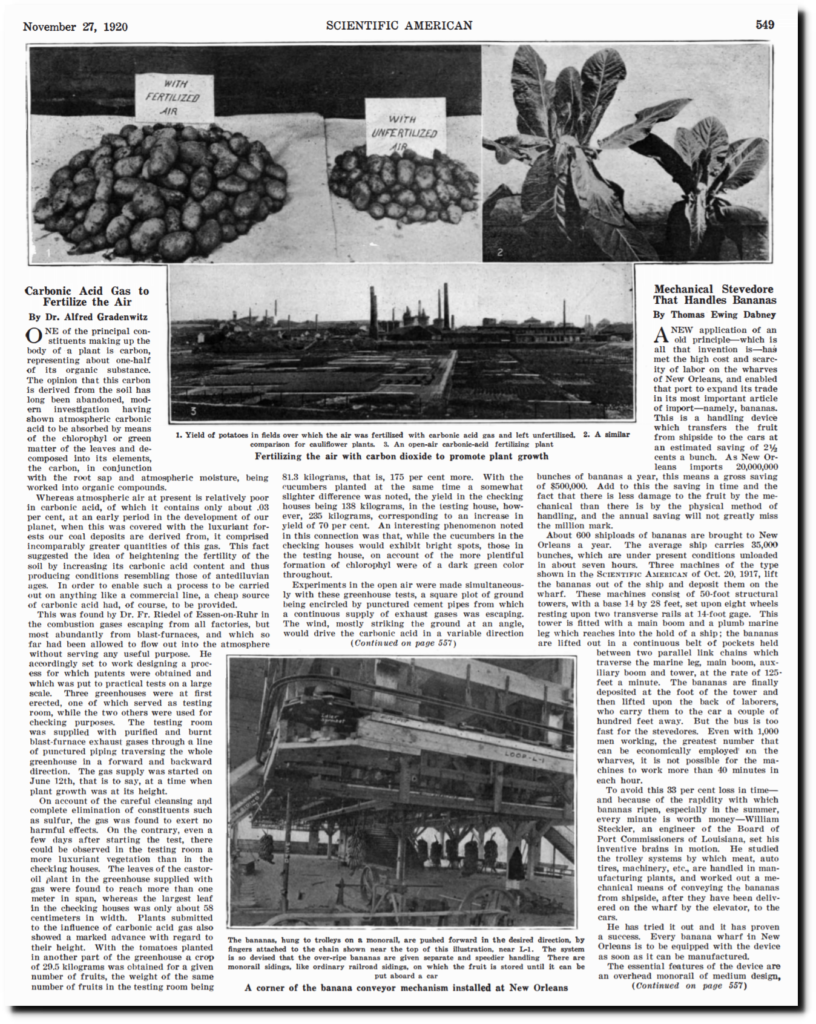
The reality is that high CO2 levels existed for most of Earth’s history, and produced verdant forests which Scientific American reported on more than 100 years ago.
“Fertilizing the air with carbon dioxide to promote plant growth
ONE of the principal constituents making up the body of a plant is carbon, representing about one-half of its organic substance. The opinion that this carbon is derived from the soil has long been abandoned, modern investigation having shown atmospheric carbonic acid to be absorbed by means 0f the chlorophyll 0r green matter of the leaves and decomposed into its elements, the carbon, in conjunction with the root sap and atmospheric m0isture, being worked into organic compounds.
Whereas atmospheric air at present is relatively poor in carb0nic acid, of which it contains only about .03 per cent, at an early period in the development of our planet, when this was covered with the luxuriant forests our coal deposits are derived from, it comprised incomparably greater quantities of this gas. This fact suggested the idea of heightening the fertility of the soil by increasing its carbonic acid content and thus producing conditions resembling those of antediluvian ages.”
The greatest expansion of life on Earth occurred 540 million years ago, when CO2 was at its peak. Atmospheric CO2 levels were more than 15 times higher than they are now. Corals and shellfish evolved during that time. If high levels of CO2 were a real problem, there would have been no sea life, rather than a massive expansion of life in the oceans..
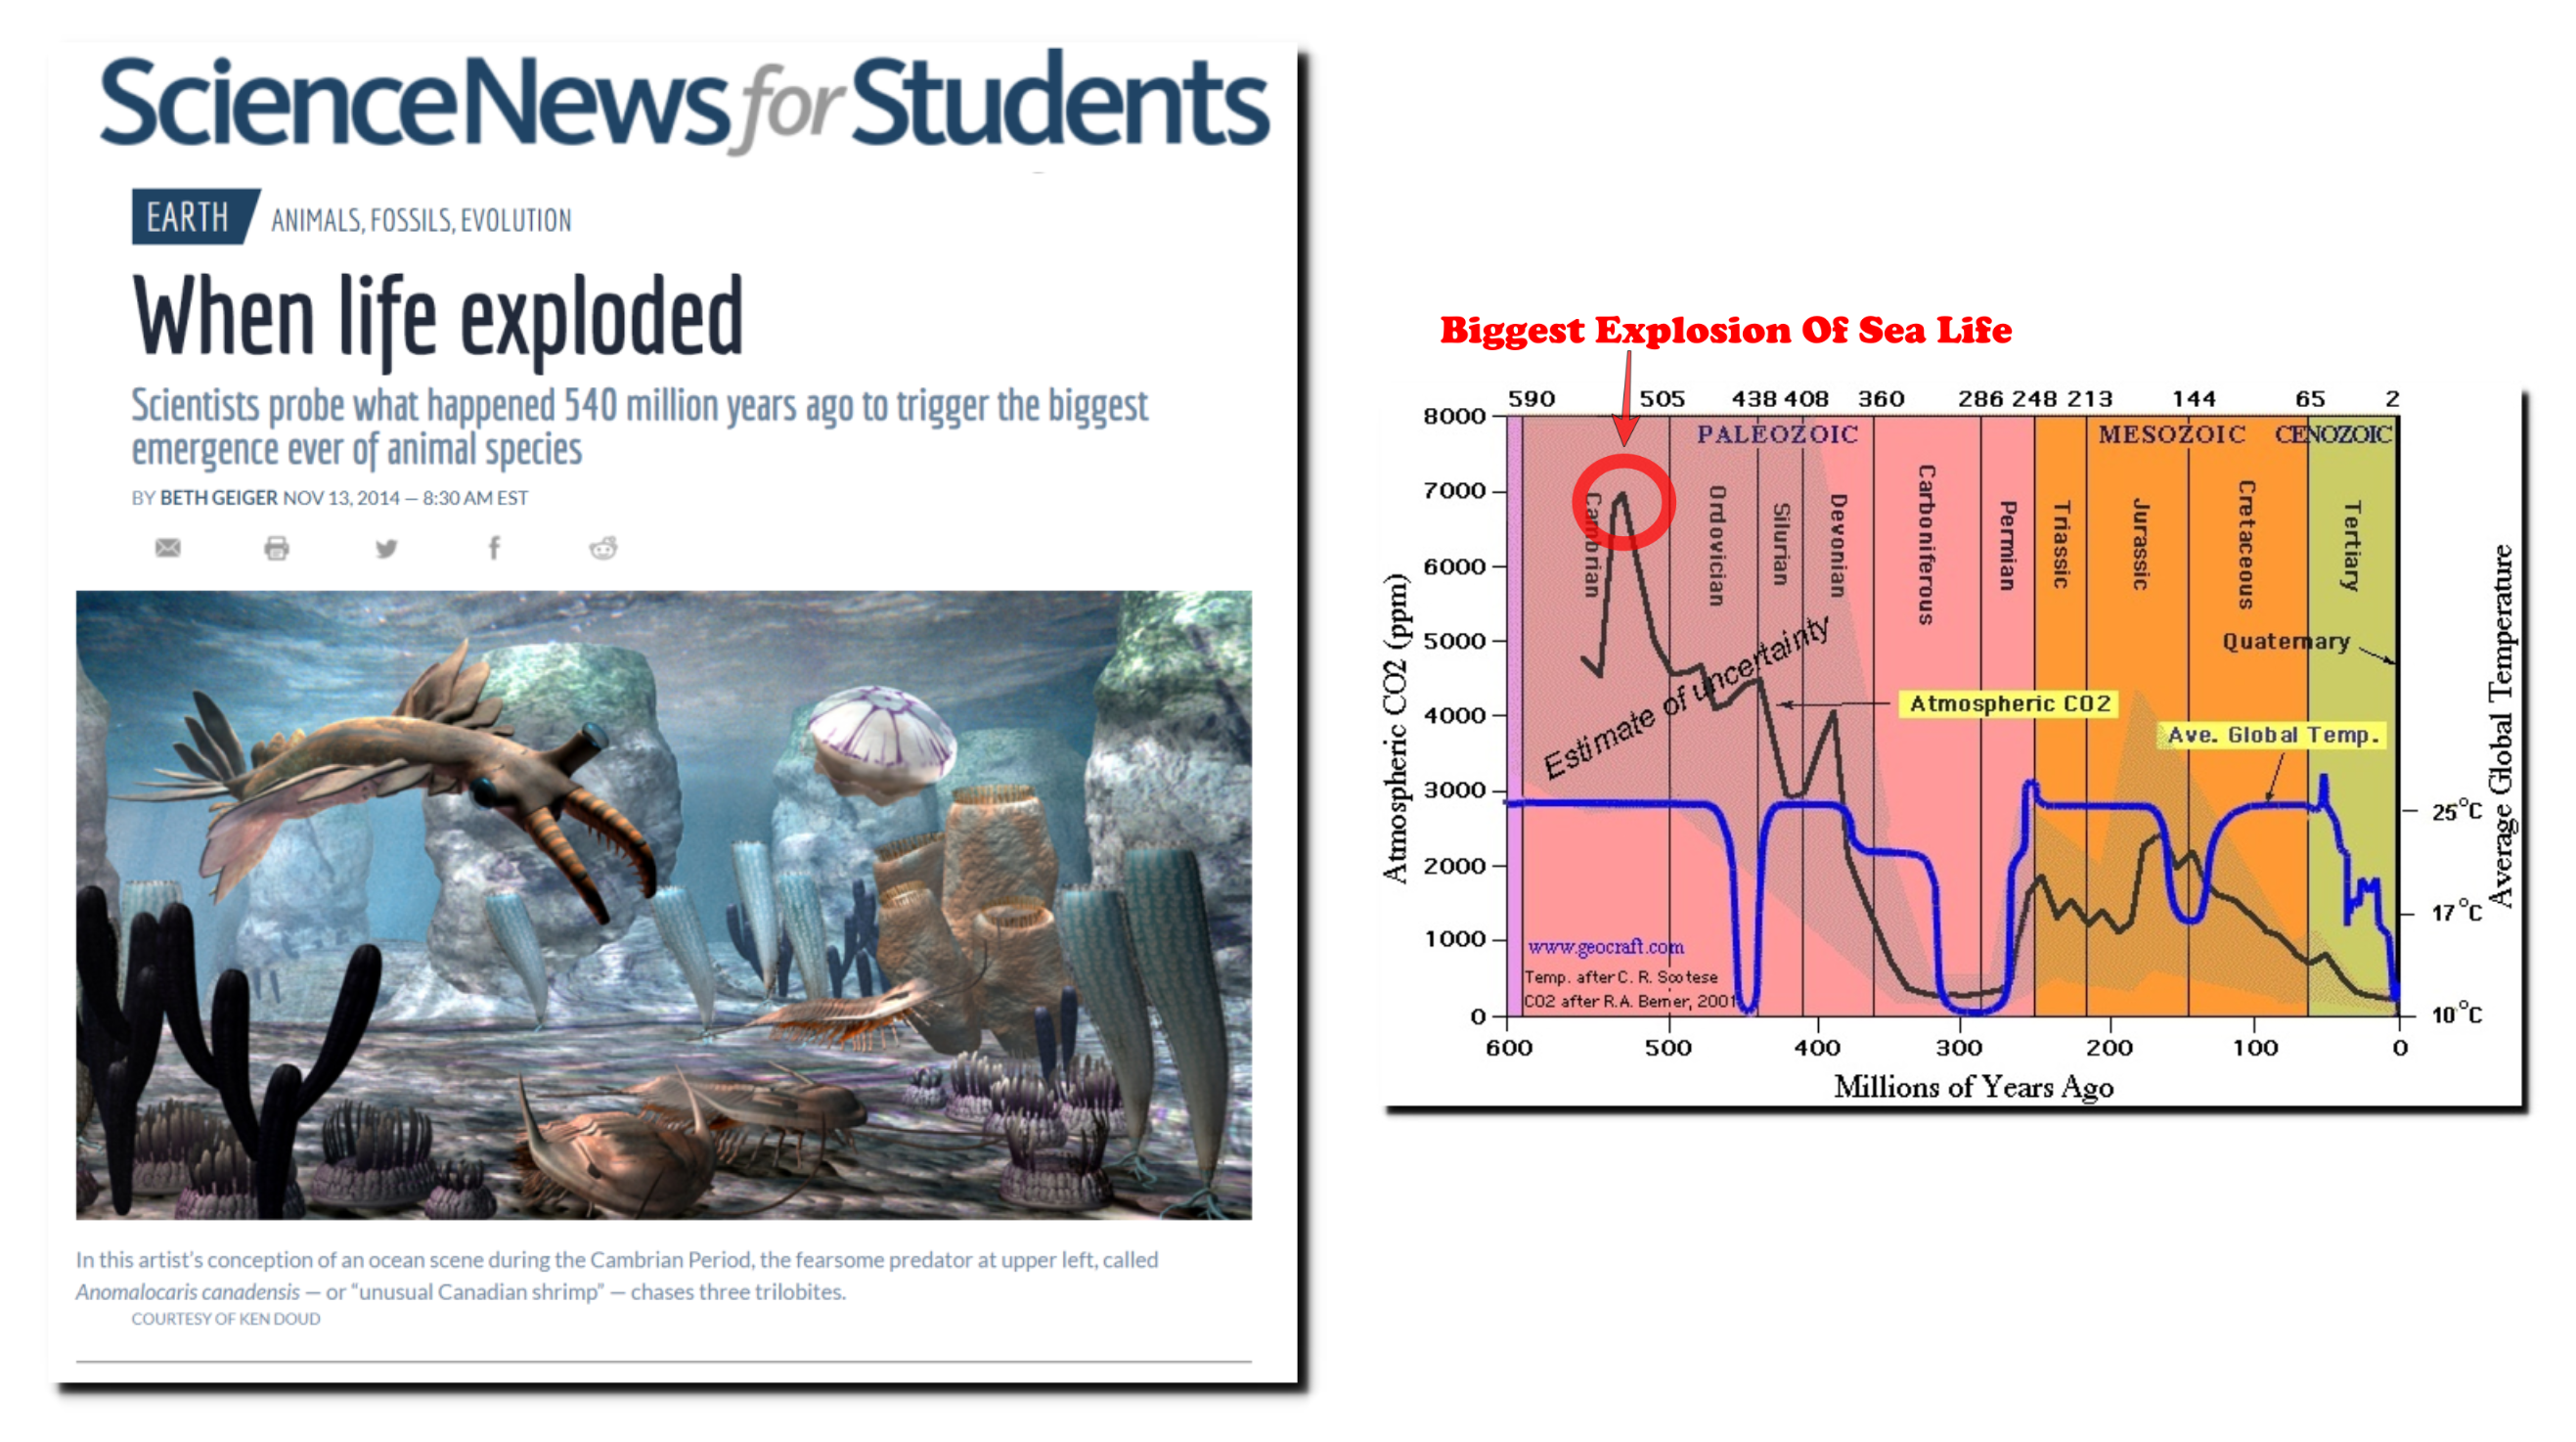
When life exploded | Science News for Students
Earth is getting greener as CO2 increases.
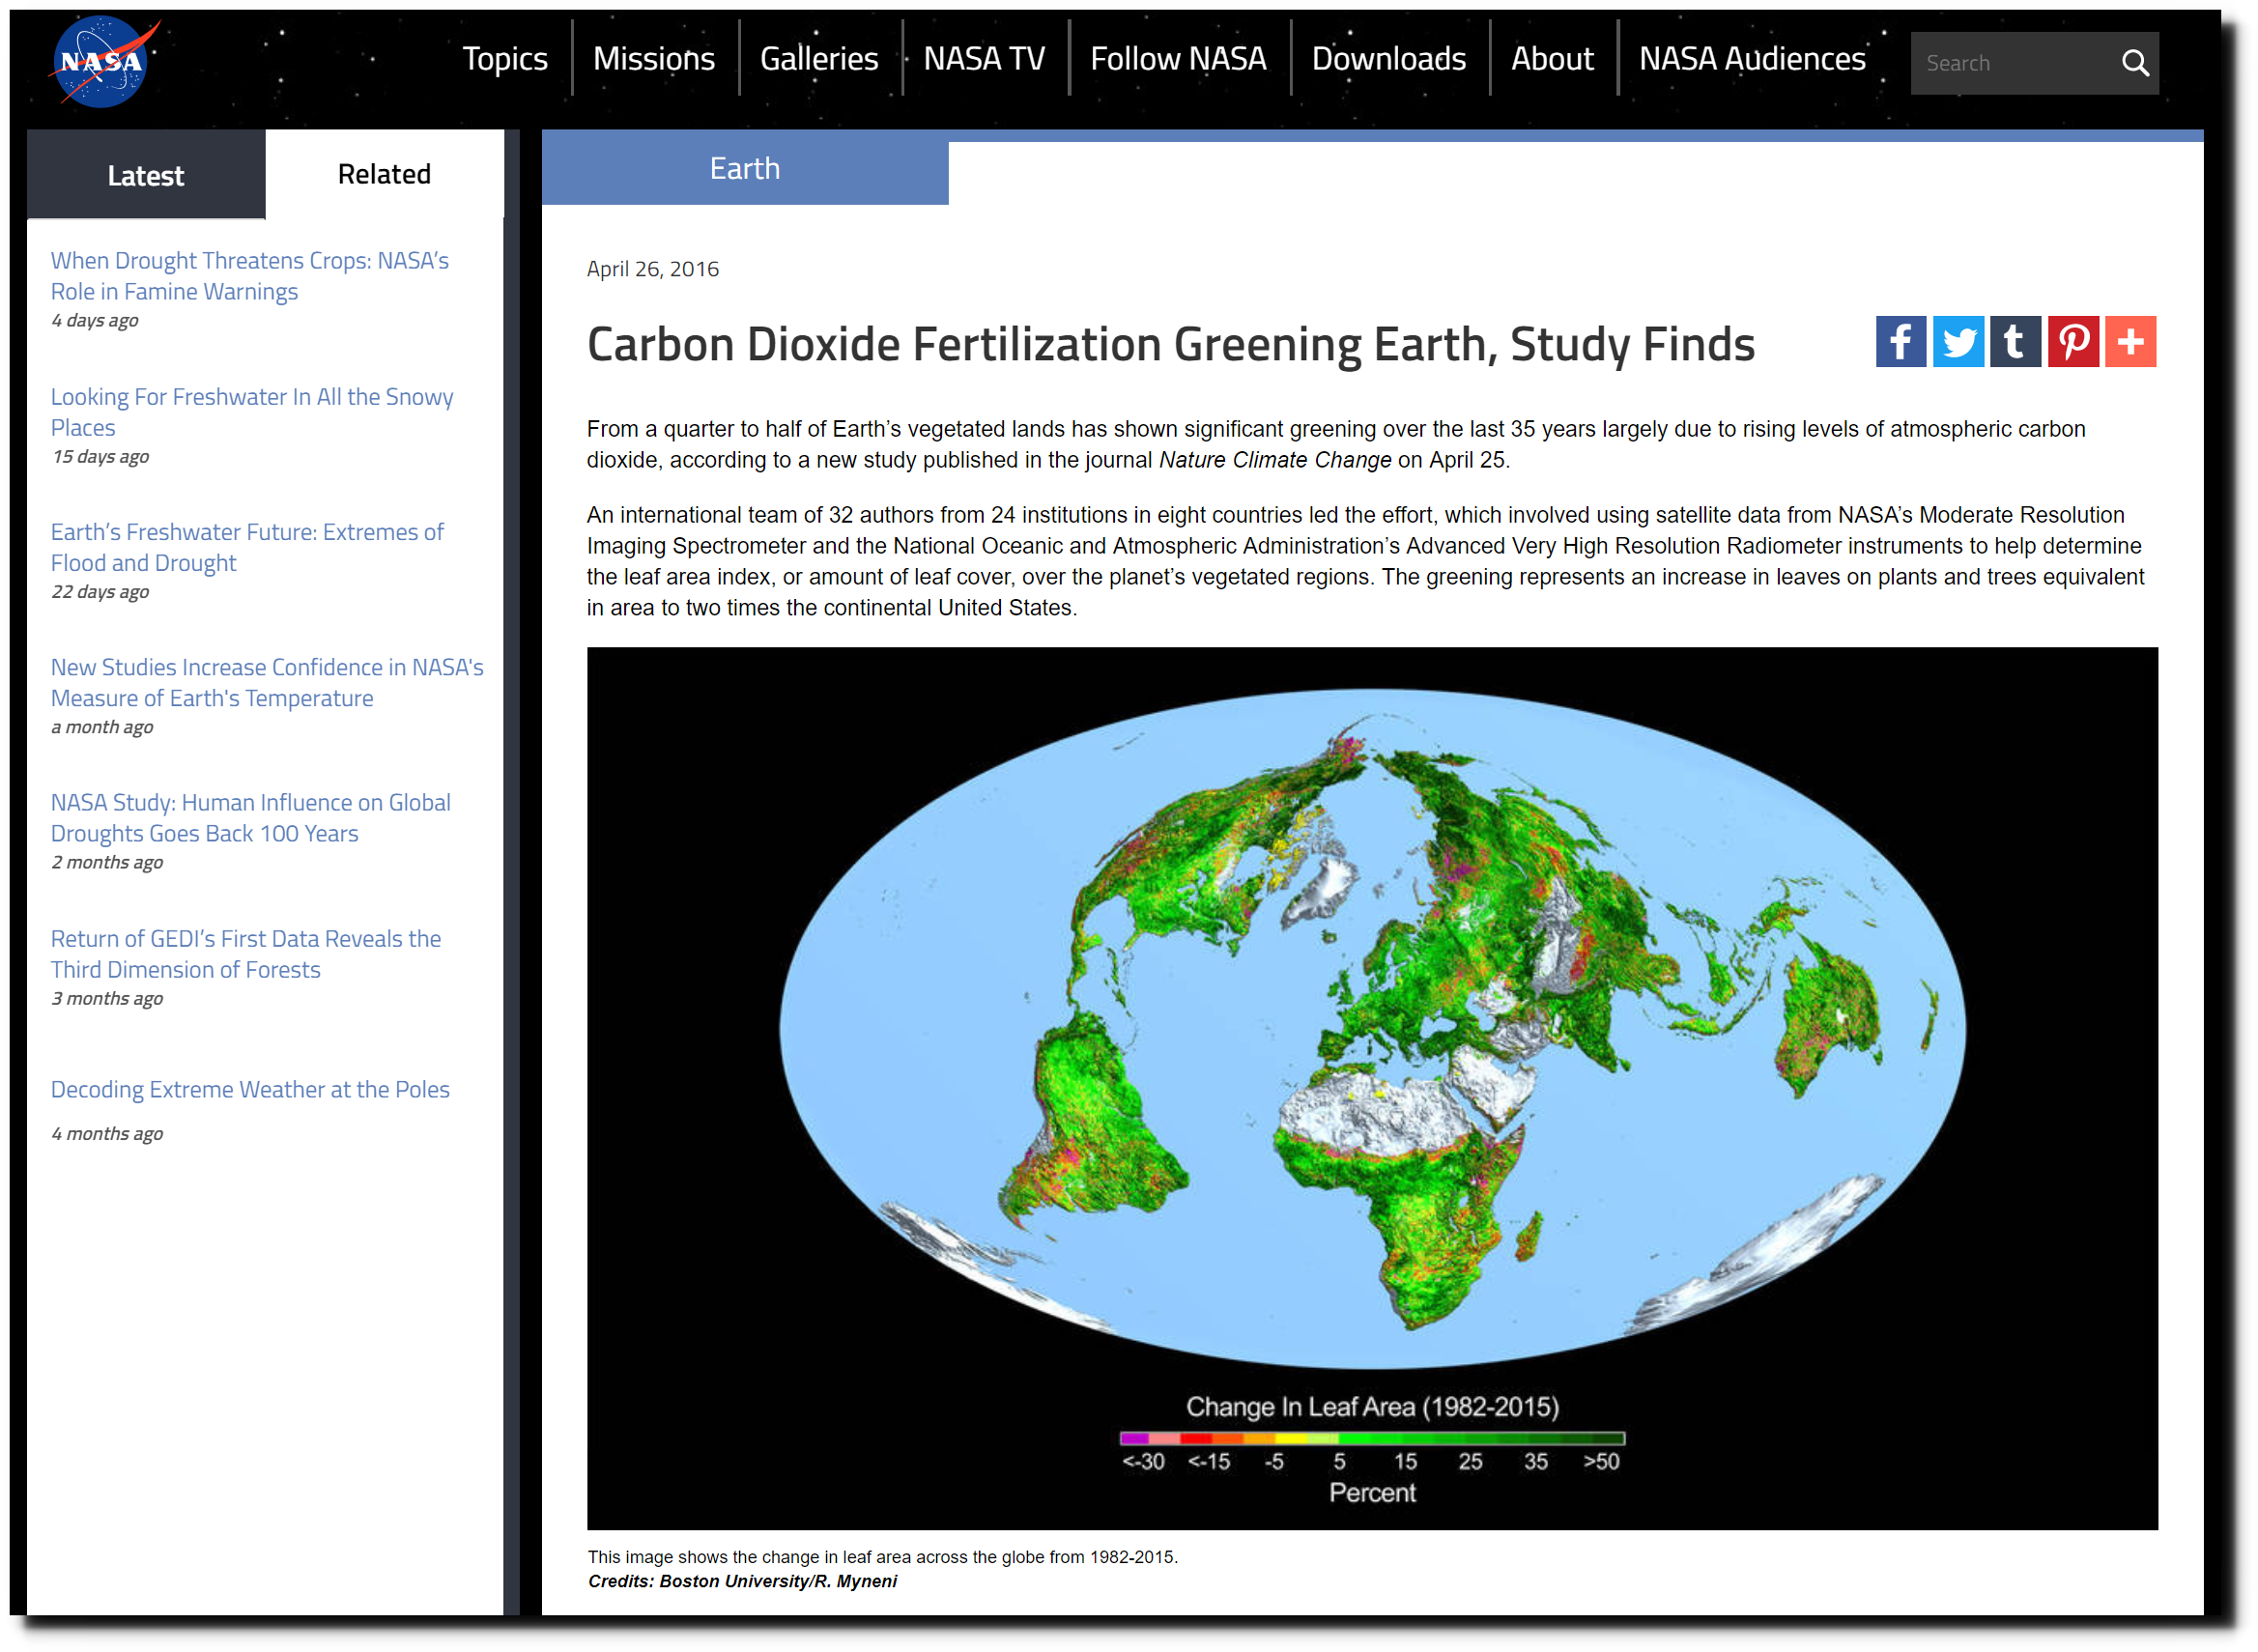
Carbon Dioxide Fertilization Greening Earth, Study Finds | NASA

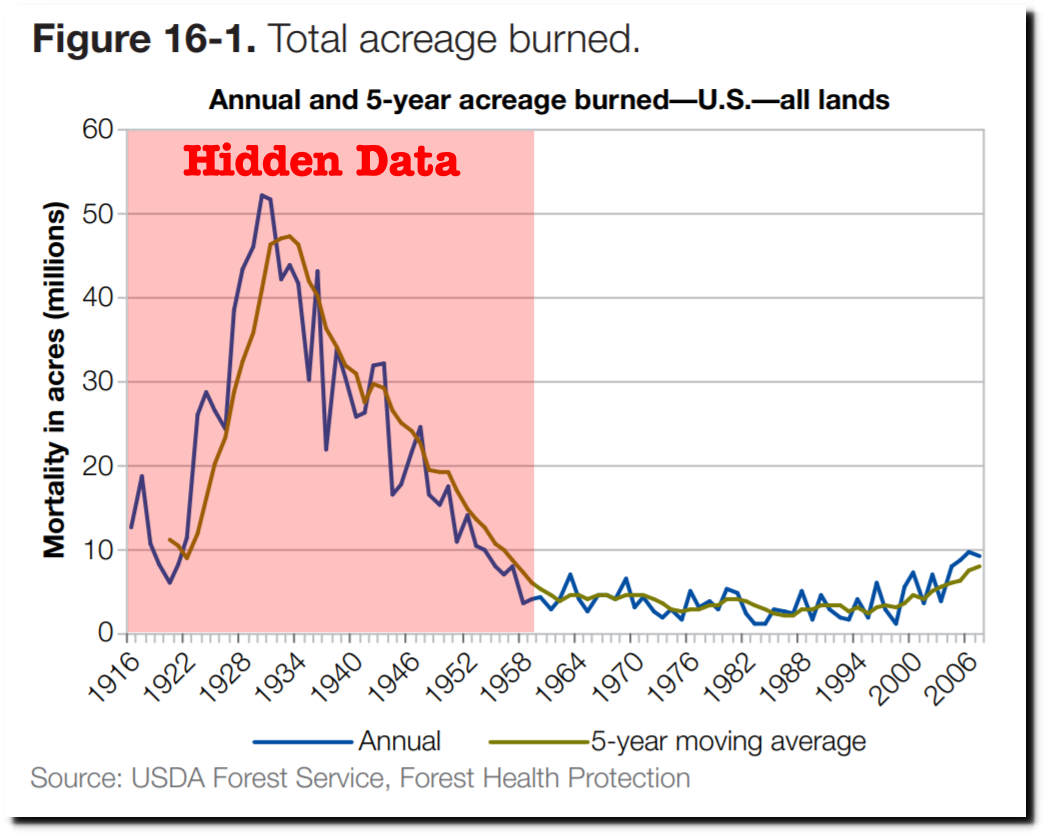
National Report on Sustainable Forests — 2010
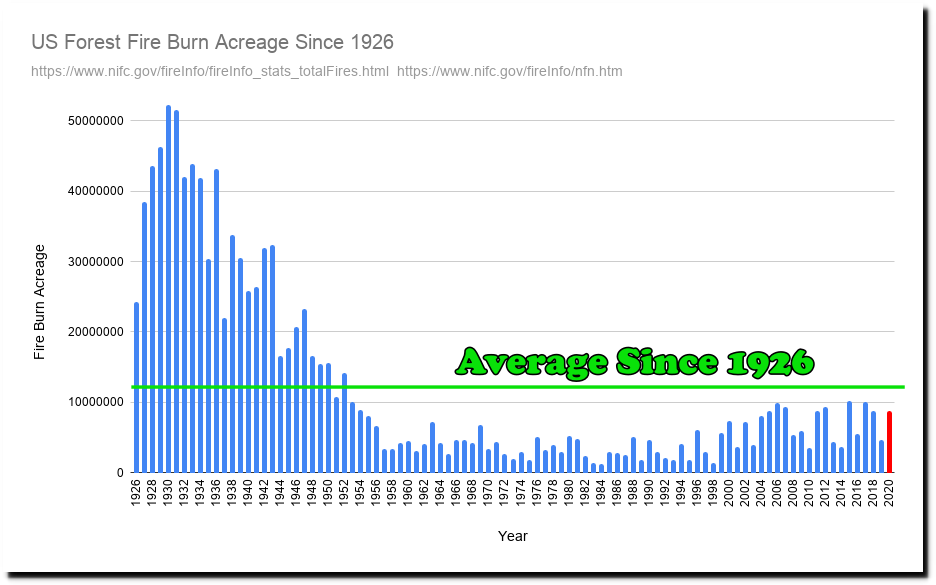
https://www.nifc.gov/fireInfo/fireInfo_stats_totalFires.html
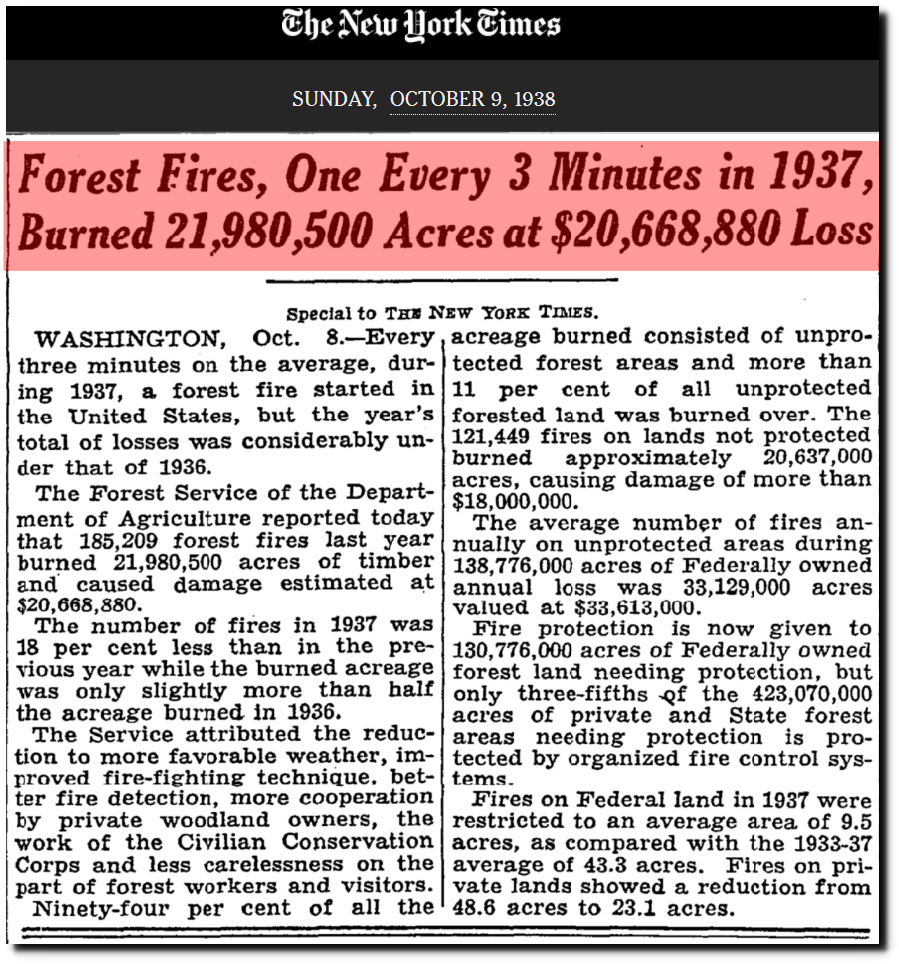
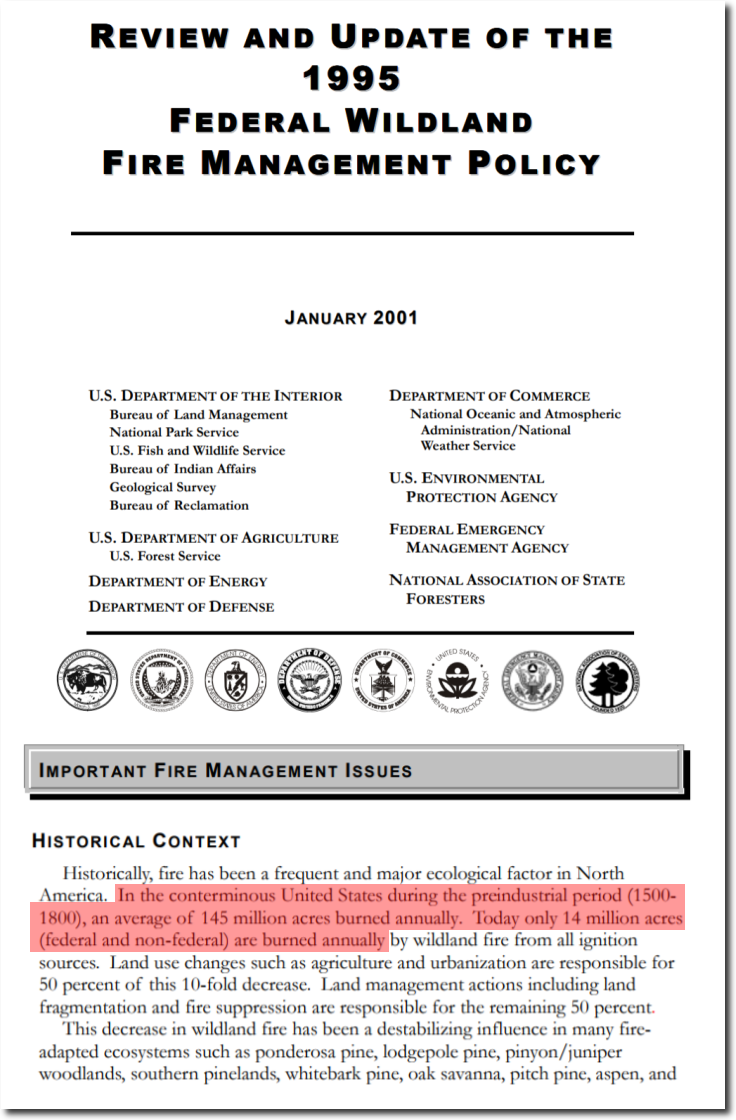
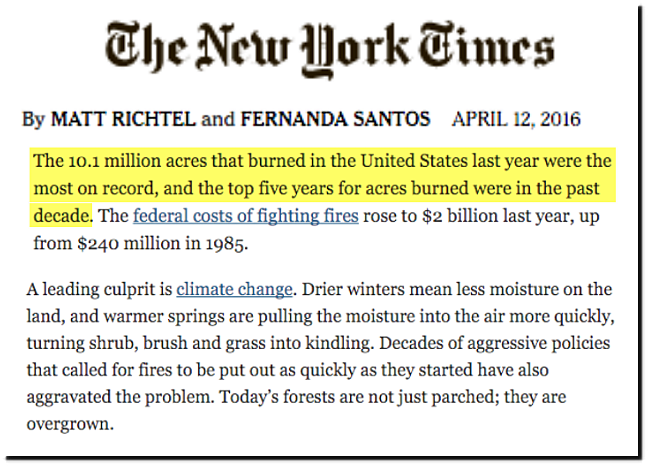
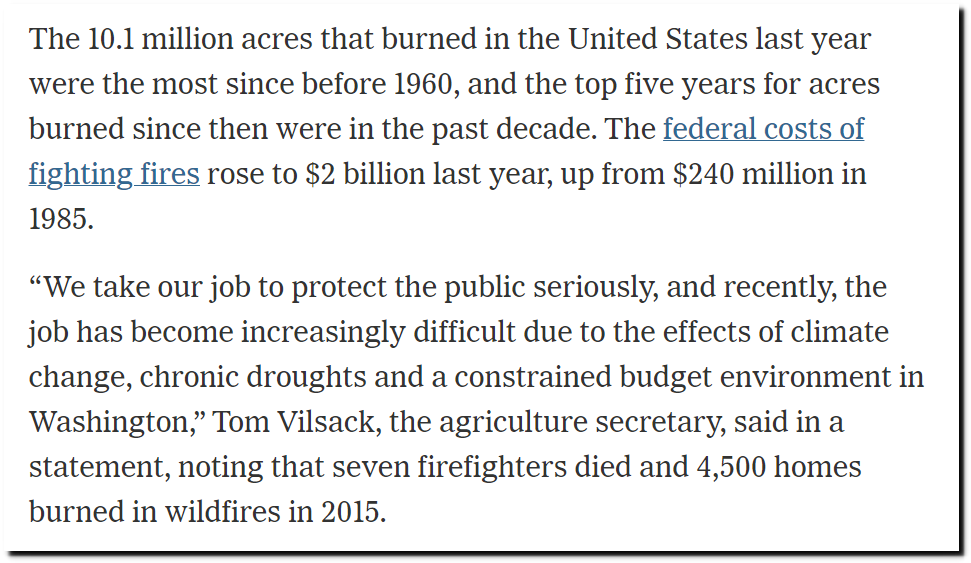
Forest fire burn acreage is down 90% since atmospheric CO2 was at pre-industrial levels.
The worst fires in US history occurred 150 years ago. On October 7, 1871 much of Minnesota and Wisconsin were burning.
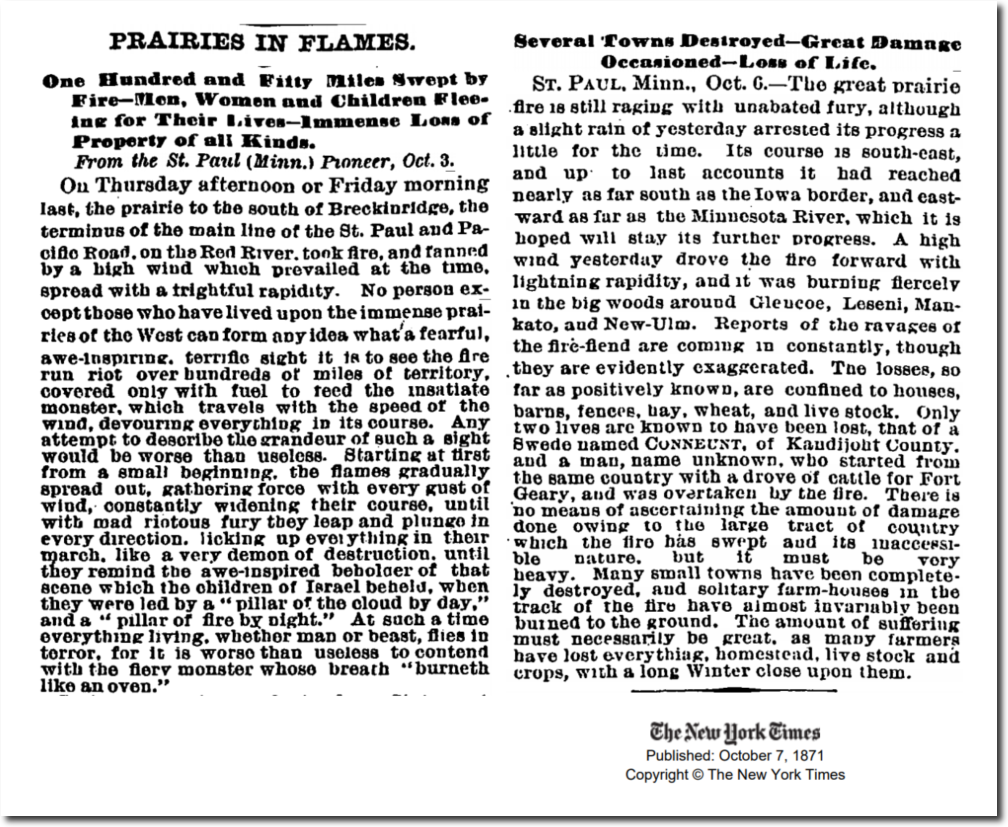
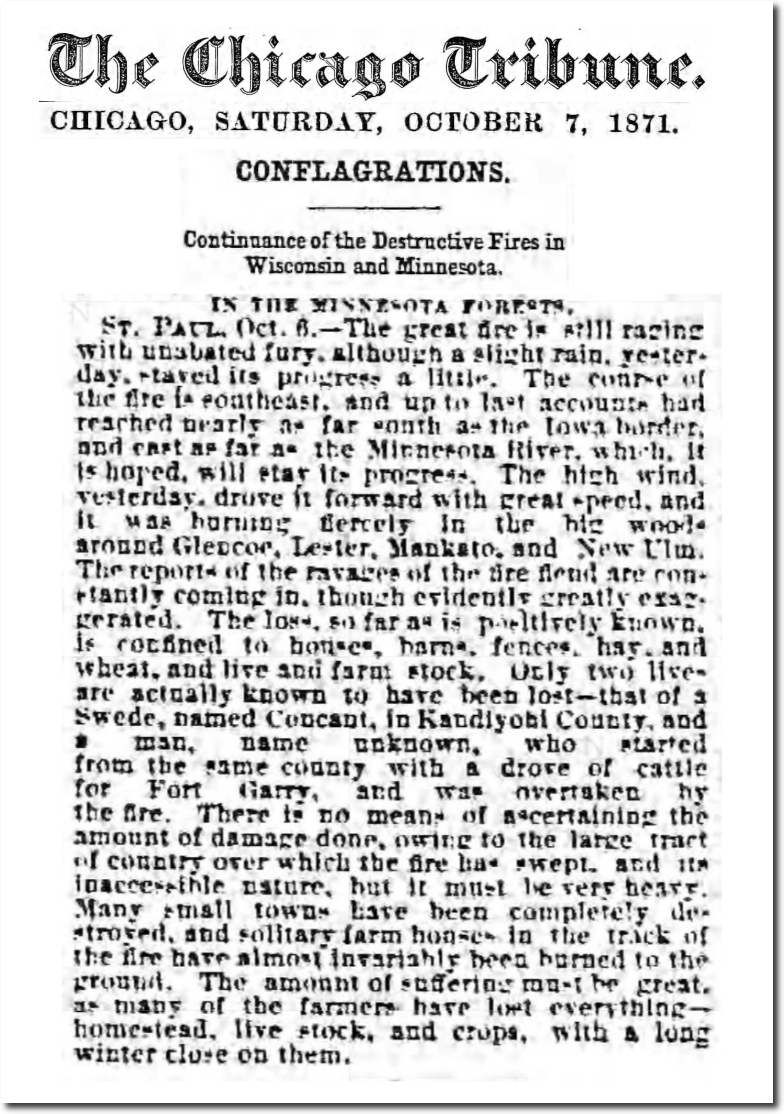
07 Oct 1871, 1 – Chicago Tribune at Newspapers.com
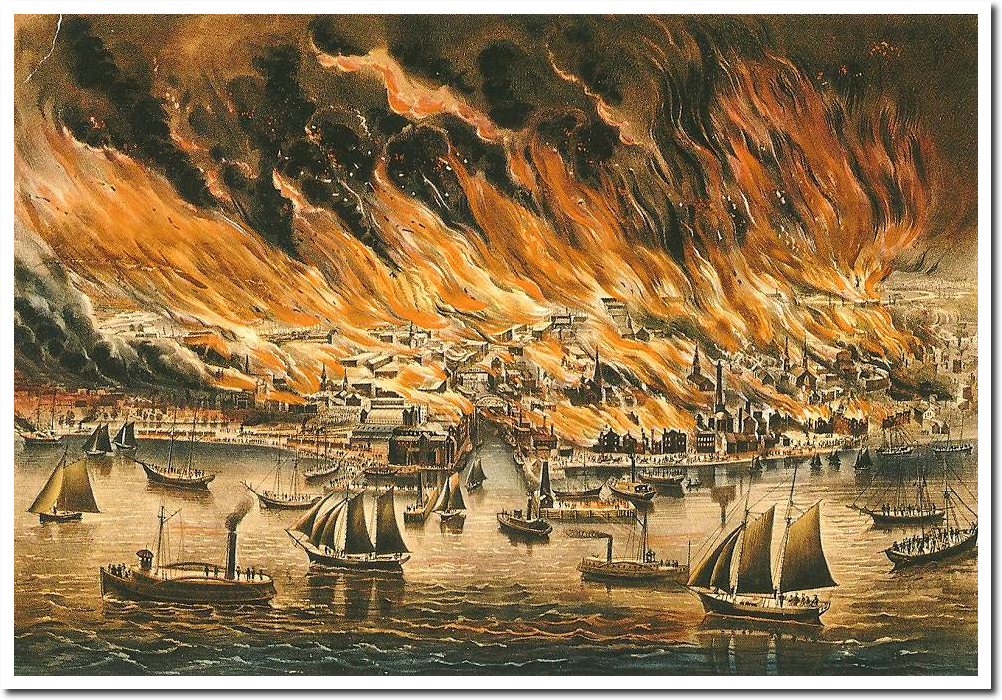
The following day was the worst fires in US history, with Chicago burning to the ground, and many other towns around the Great Lakes in flames.
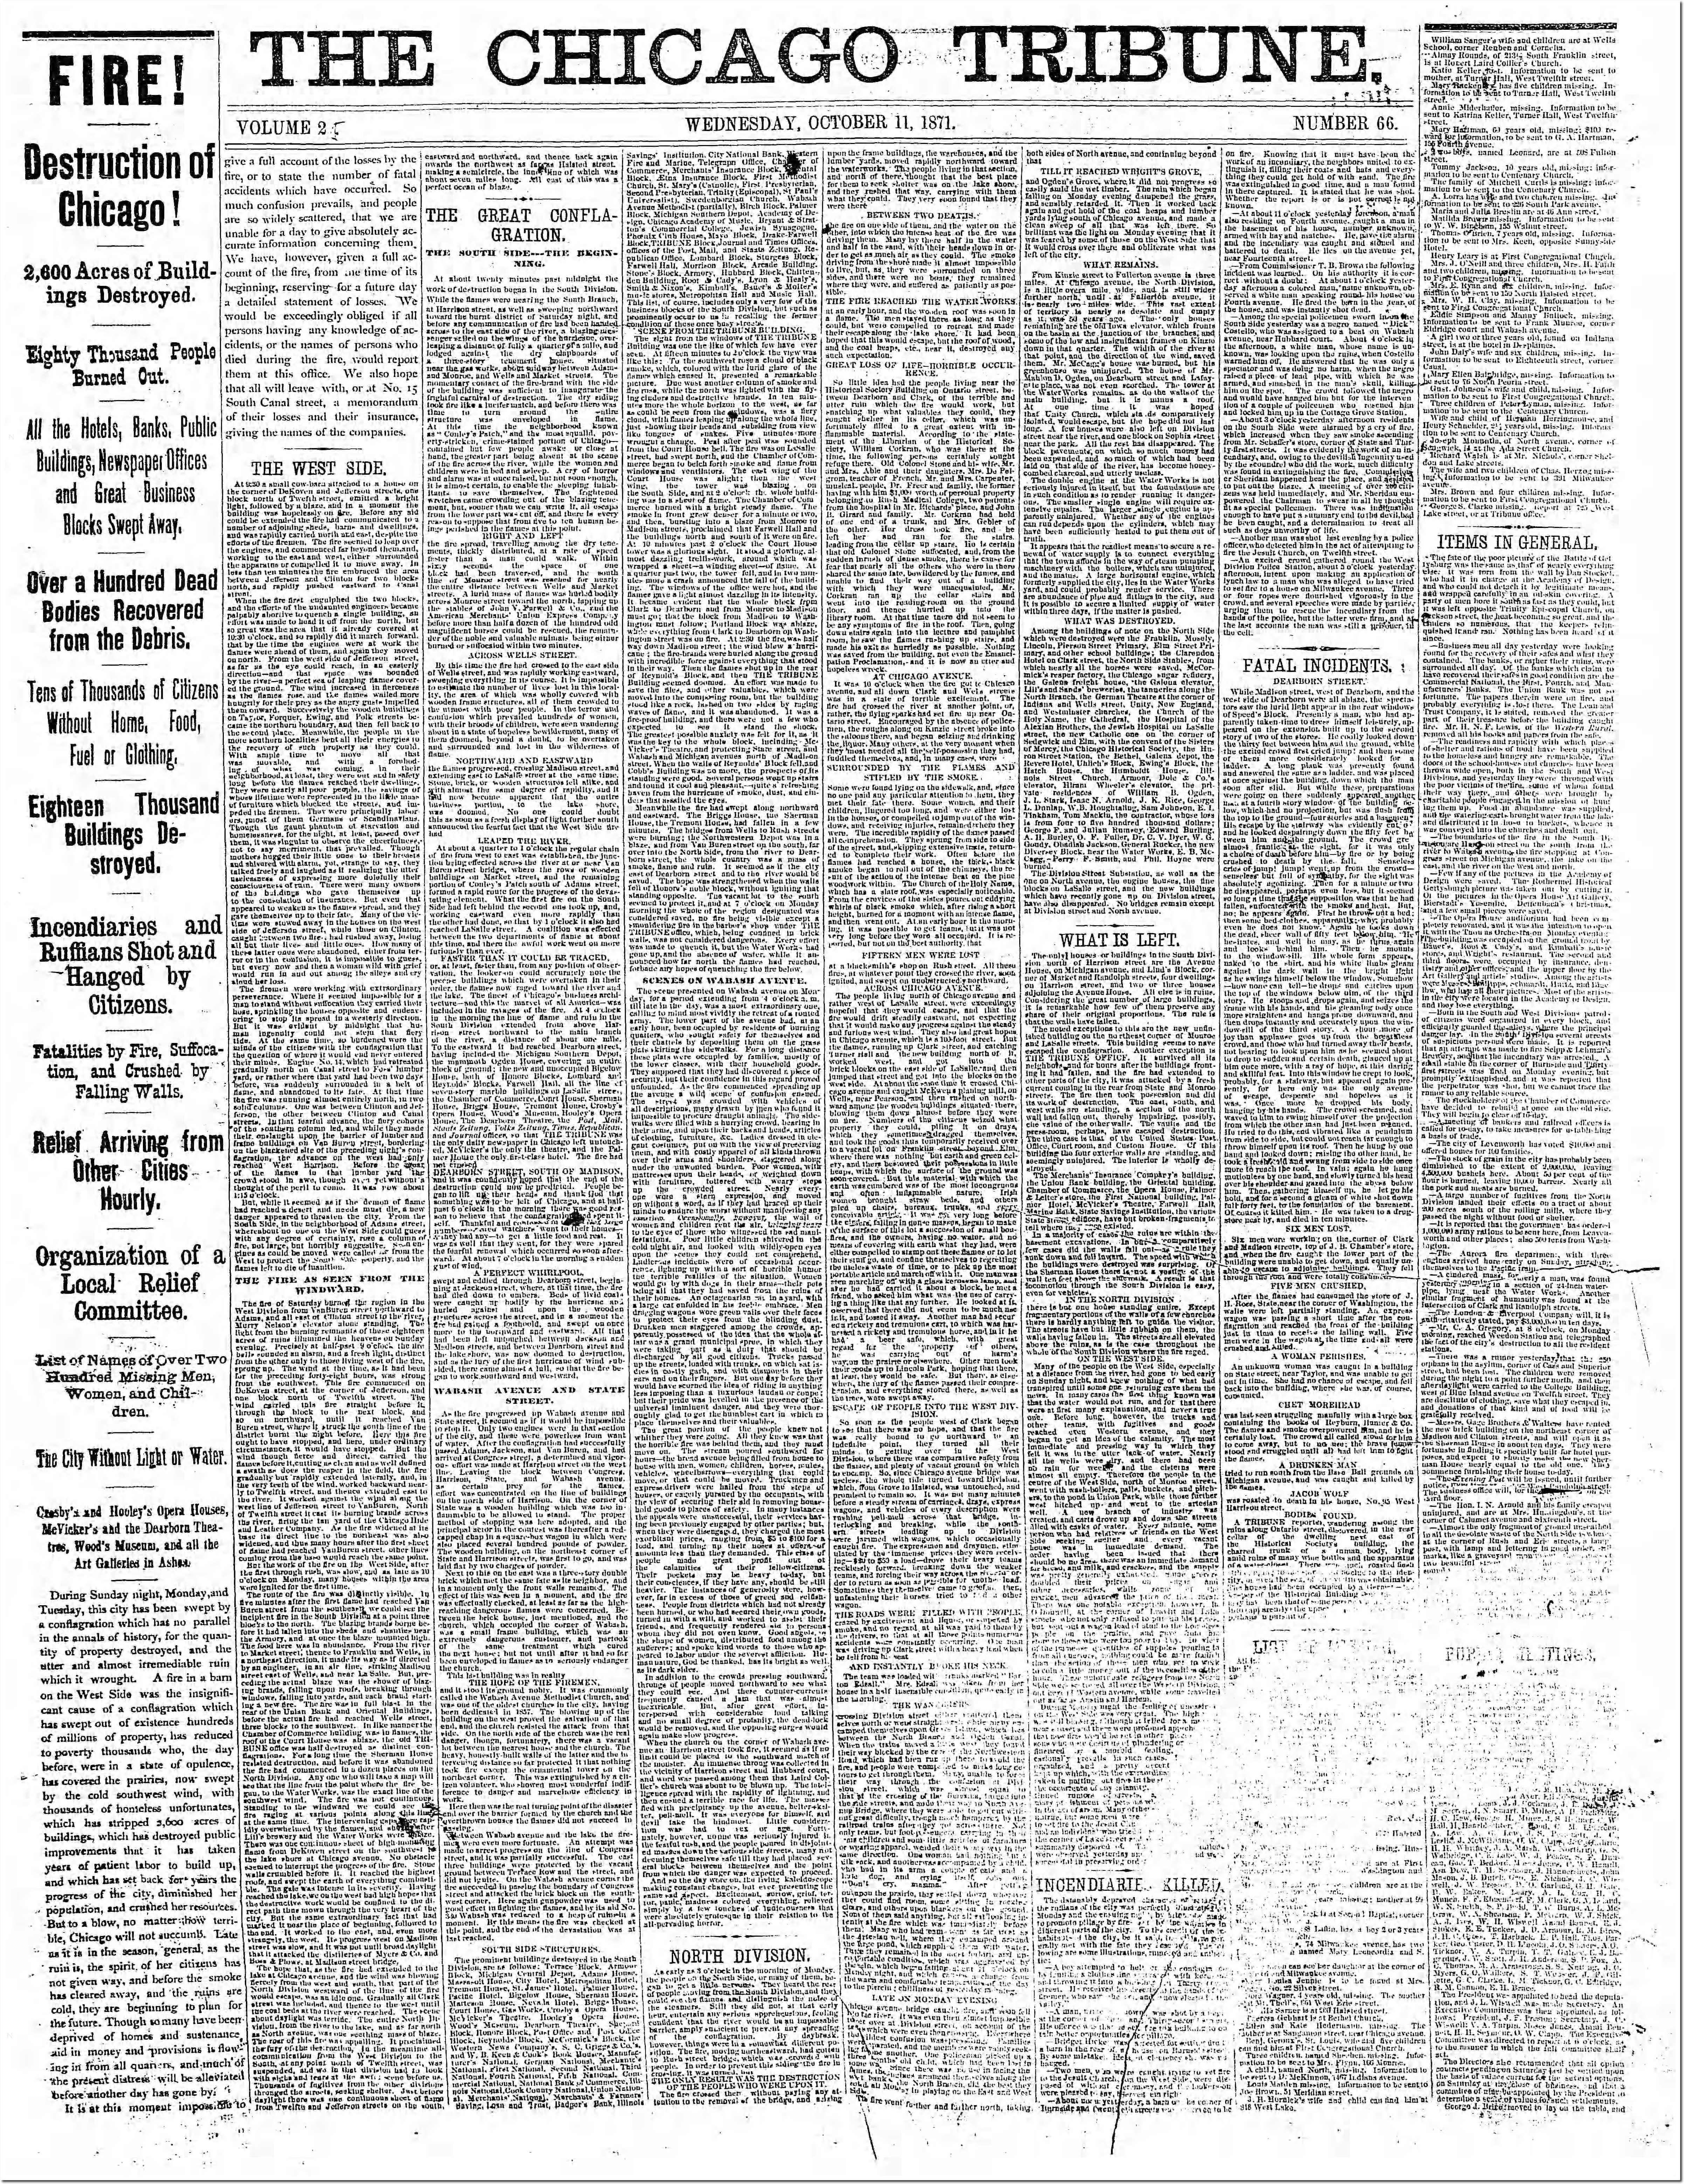
11 Oct 1871, 1 – Chicago Tribune at Newspapers.com
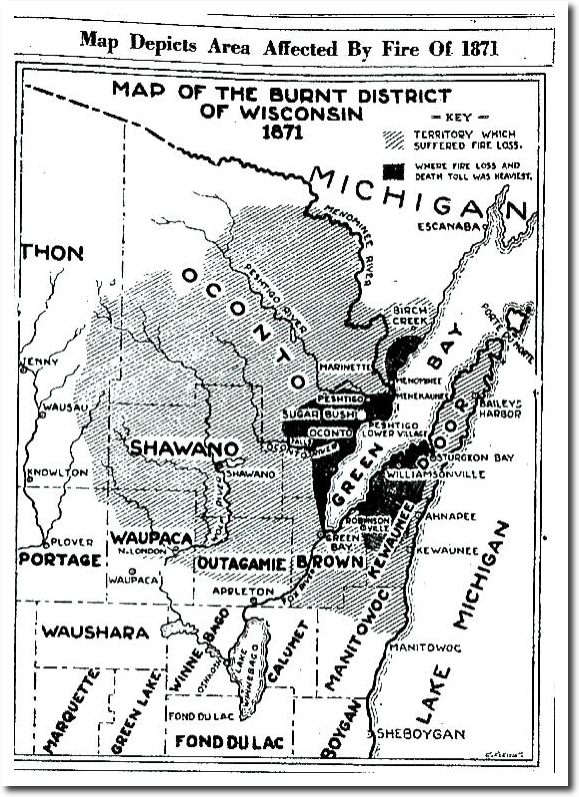
There were massive fires in Wisconsin, Michigan and the Rocky Mountains.
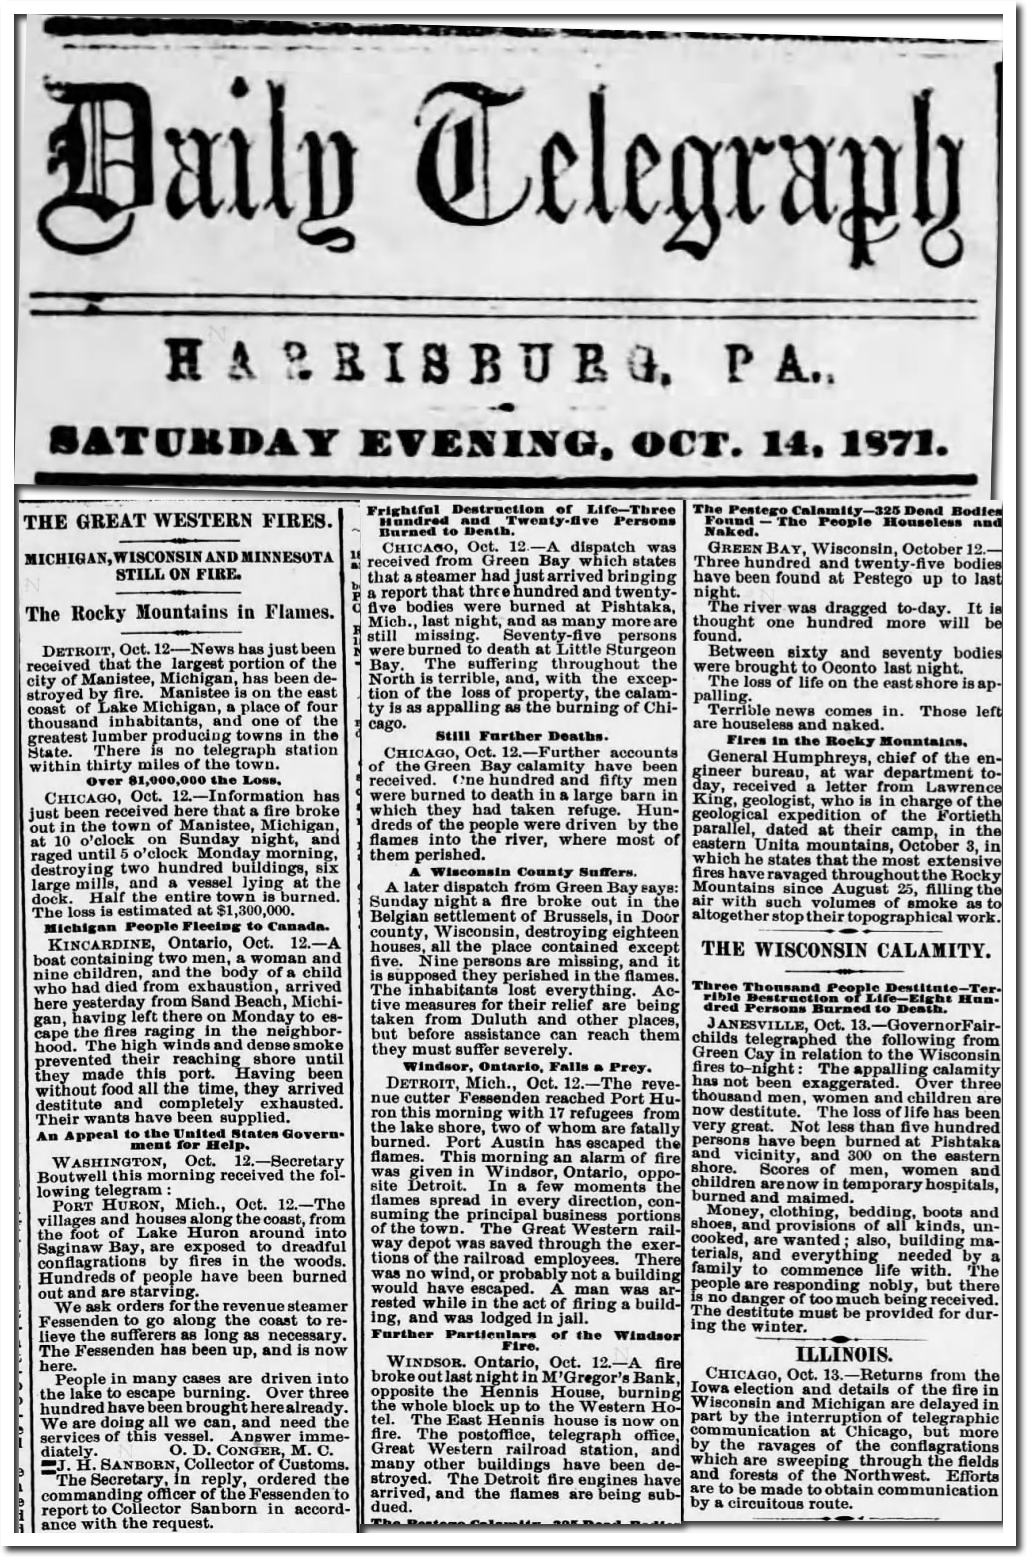
14 Oct 1871, Page 2 – Harrisburg Telegraph at Newspapers.com
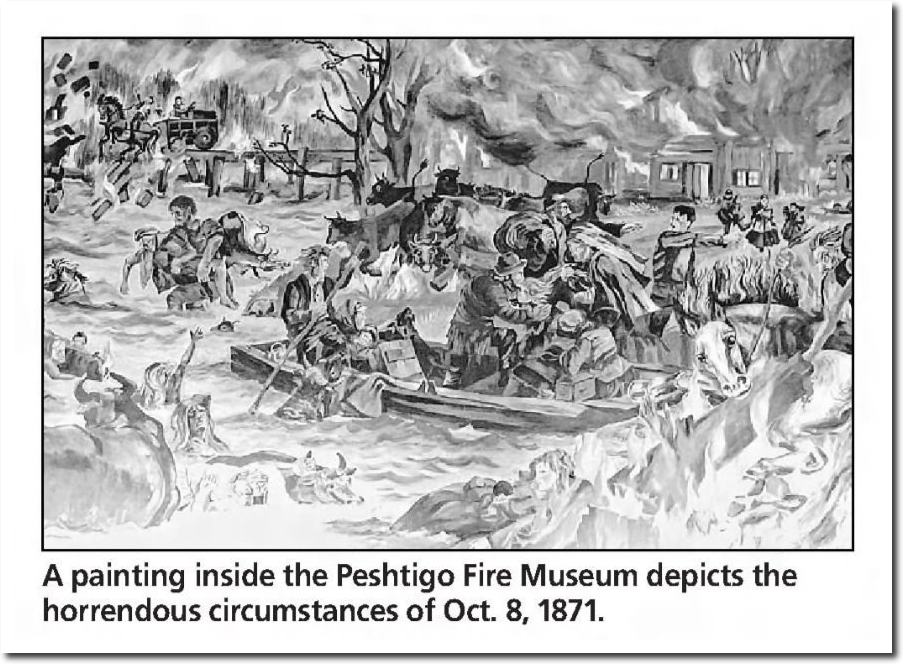
The worst of these fires occurred at Peshtigo, Wisconsin, where more than one thousand people burned to death.
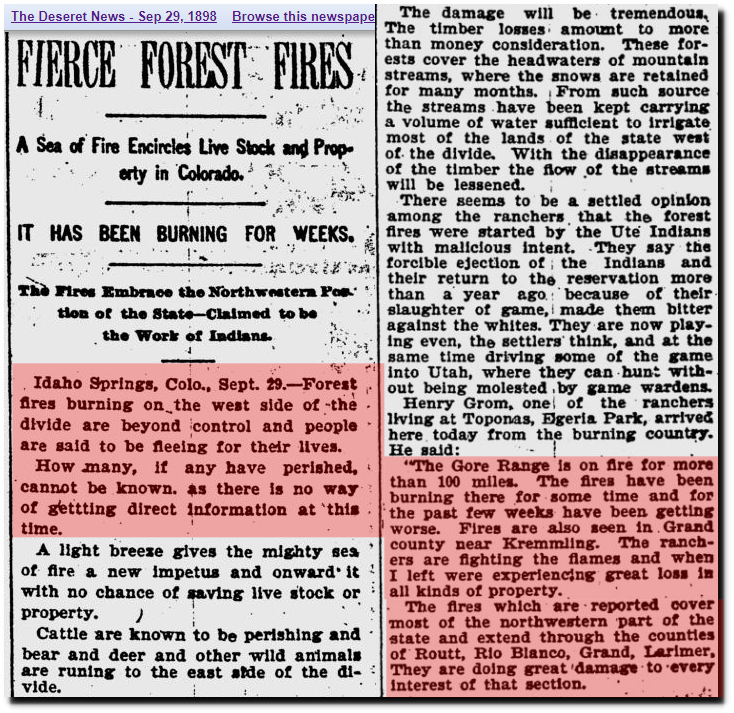
The Deseret News – Google News Archive Search
Spokane Falls Daily Chronicle – Google News Archive Search
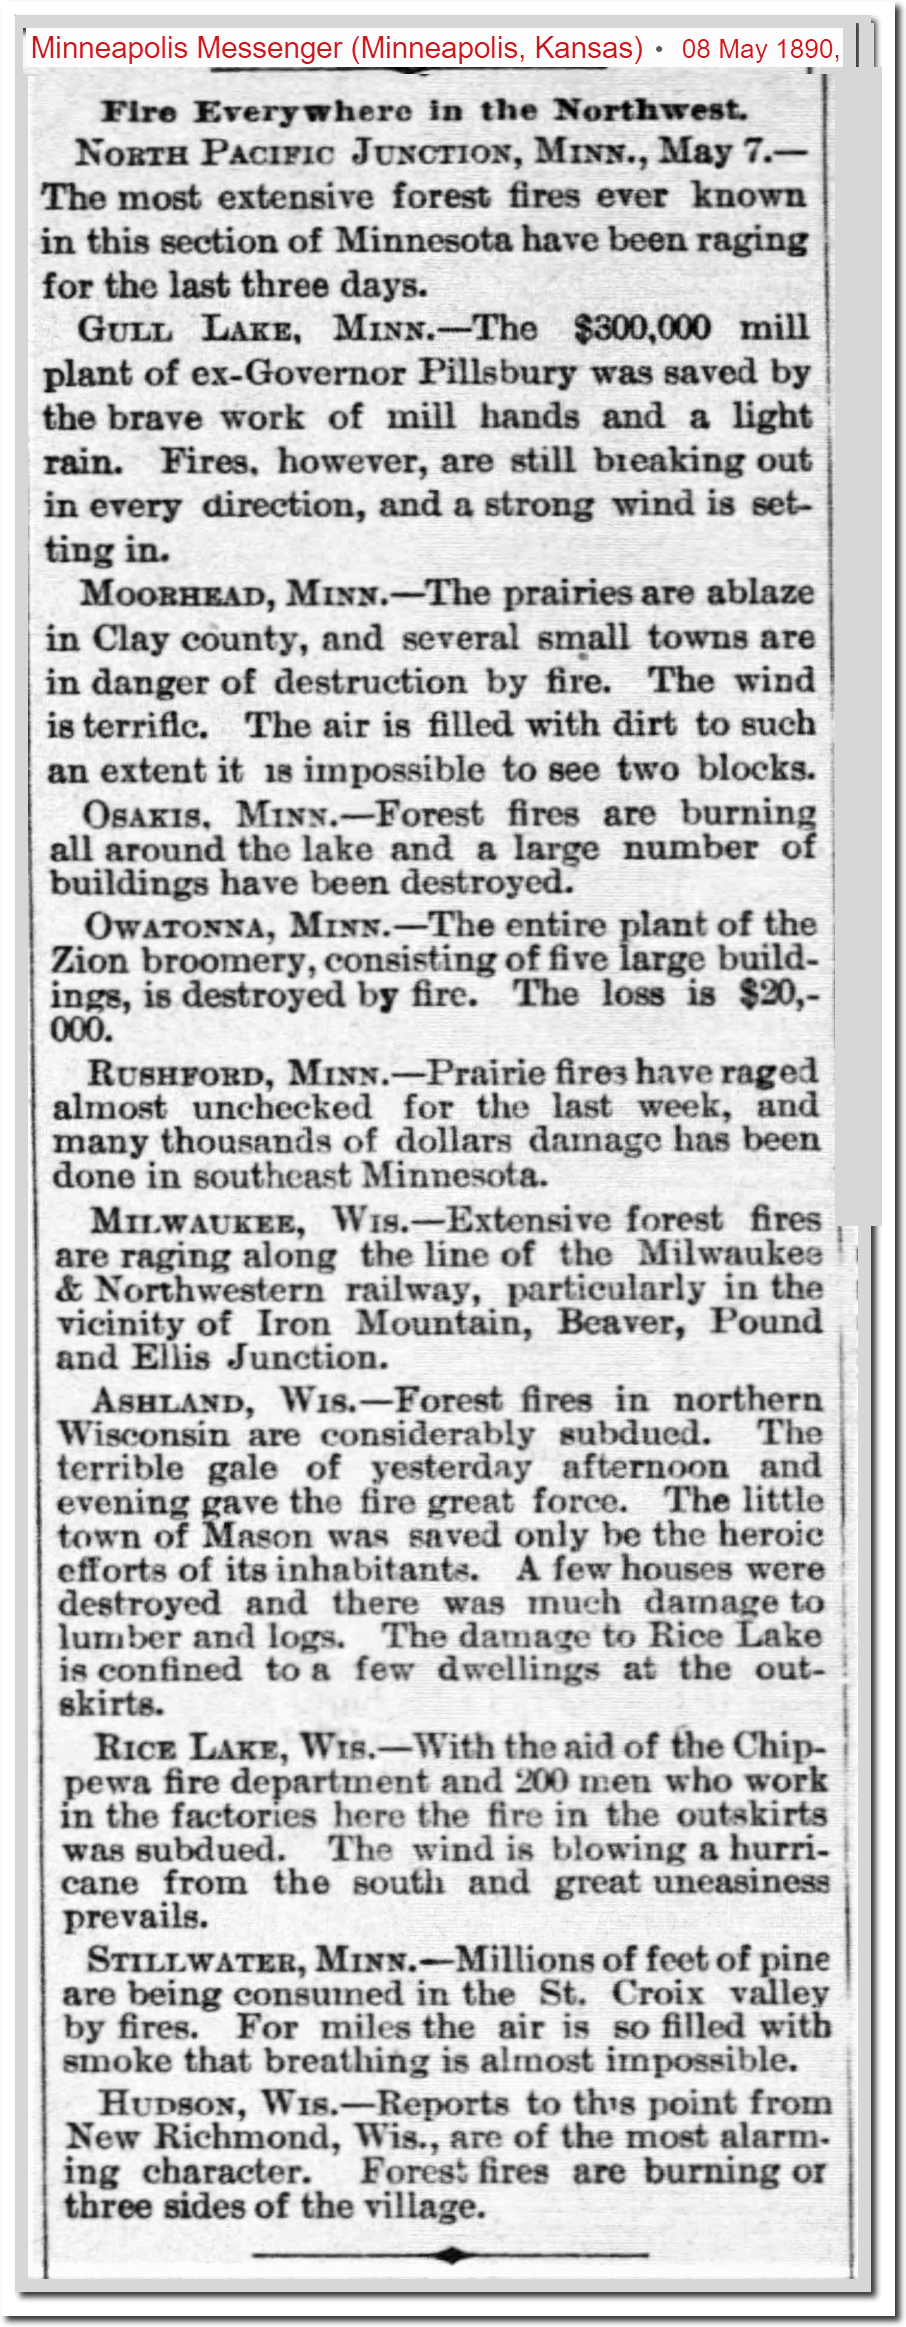
08 May 1890, 6 – Minneapolis Messenger at Newspapers.com
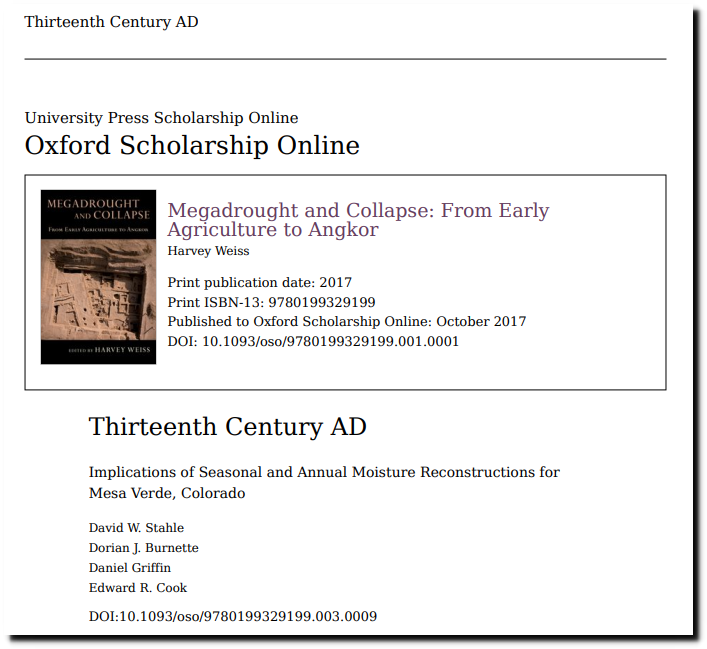
“Scientists who study the West’s long-term climate patterns say that California has had multiple droughts of 10 or 20 years in a row during the past 1,000 years — and two severe “megadroughts” of 180 years and 240 years.”
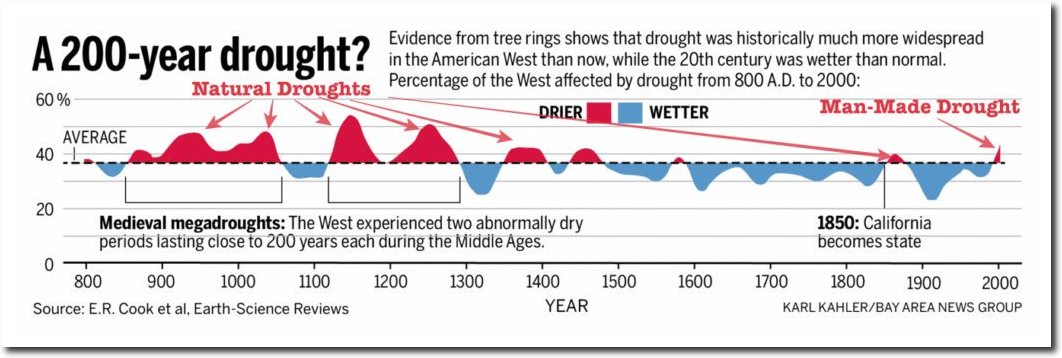
Graphic: California’s droughts in the past 1,200 years – The Mercury News
The New York Times used to know this.
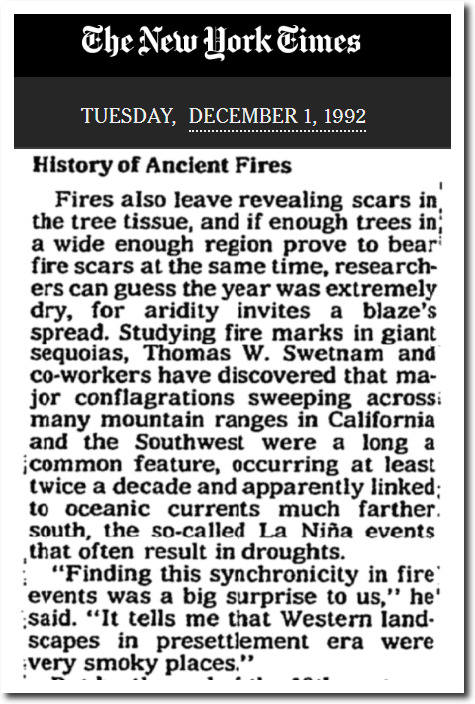
History Of Ancient Fires
Studying fire marks in giant sequoias, Thomas W. Swetnam and co-workers have discovered that major conflagrations sweeping across many mountain ranges in California and the Southwest were a long a common feature, occurring at least twice a decade and apparently linked to oceanic currents much farther south
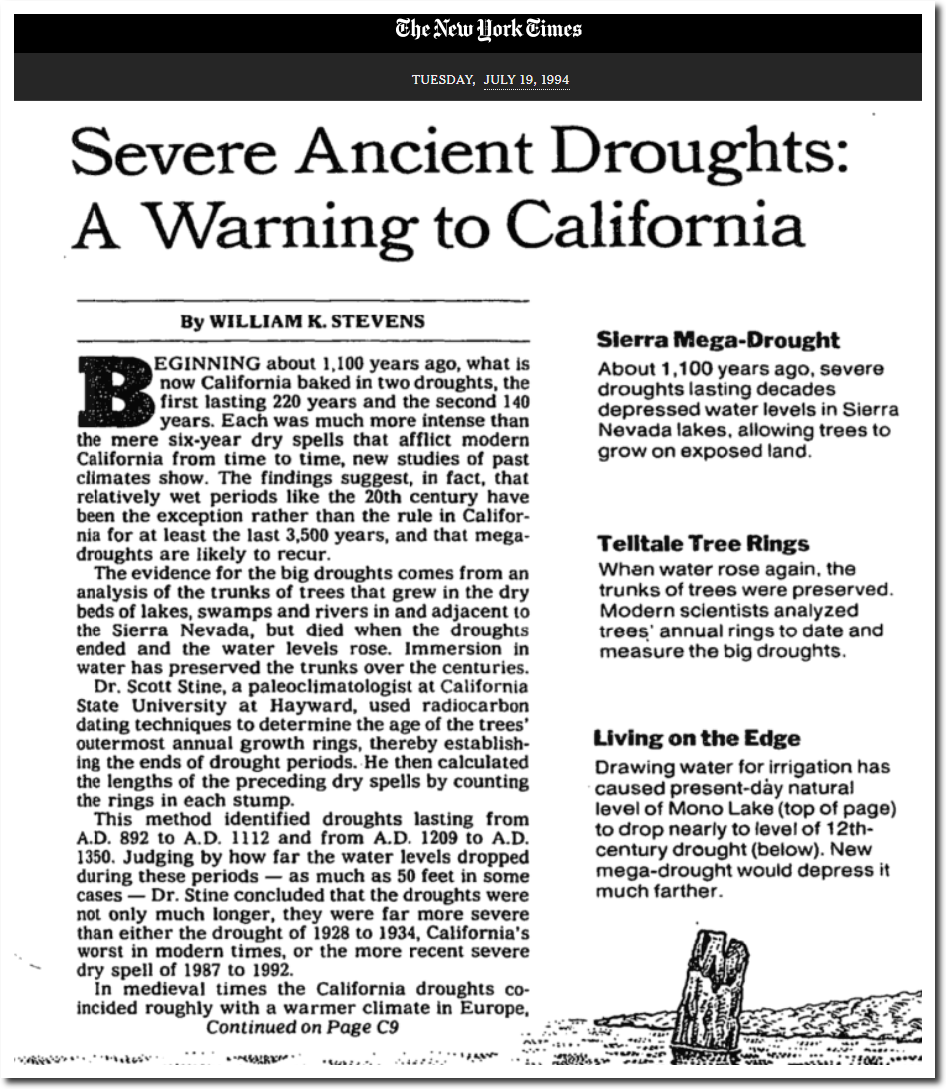
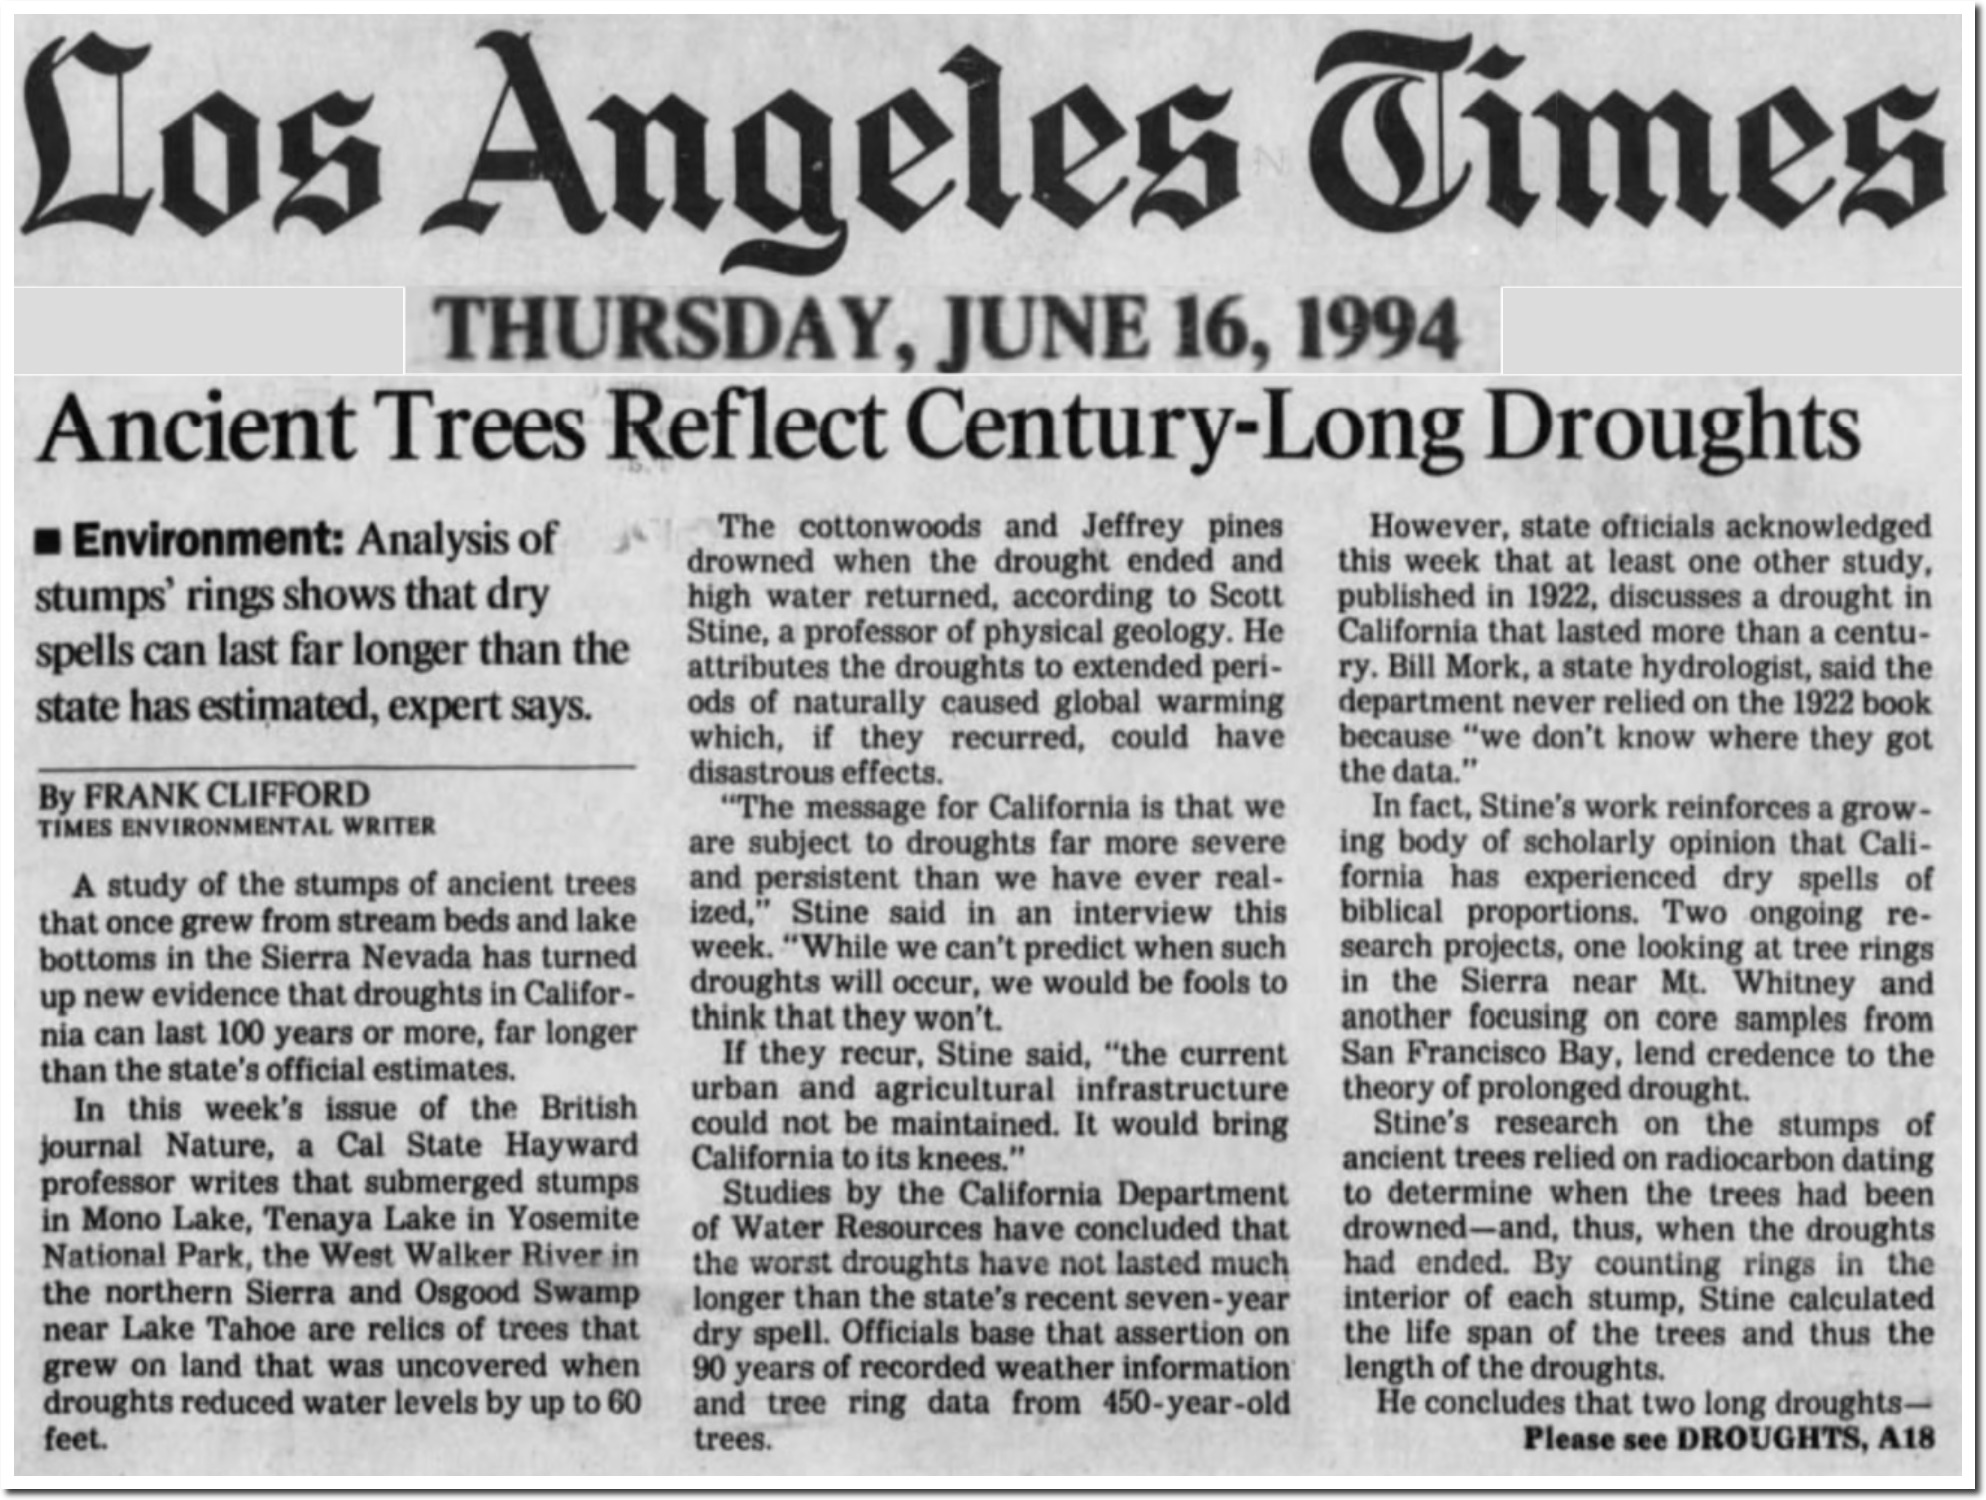
Severe Ancient Droughts: A Warning to California – The New York Times
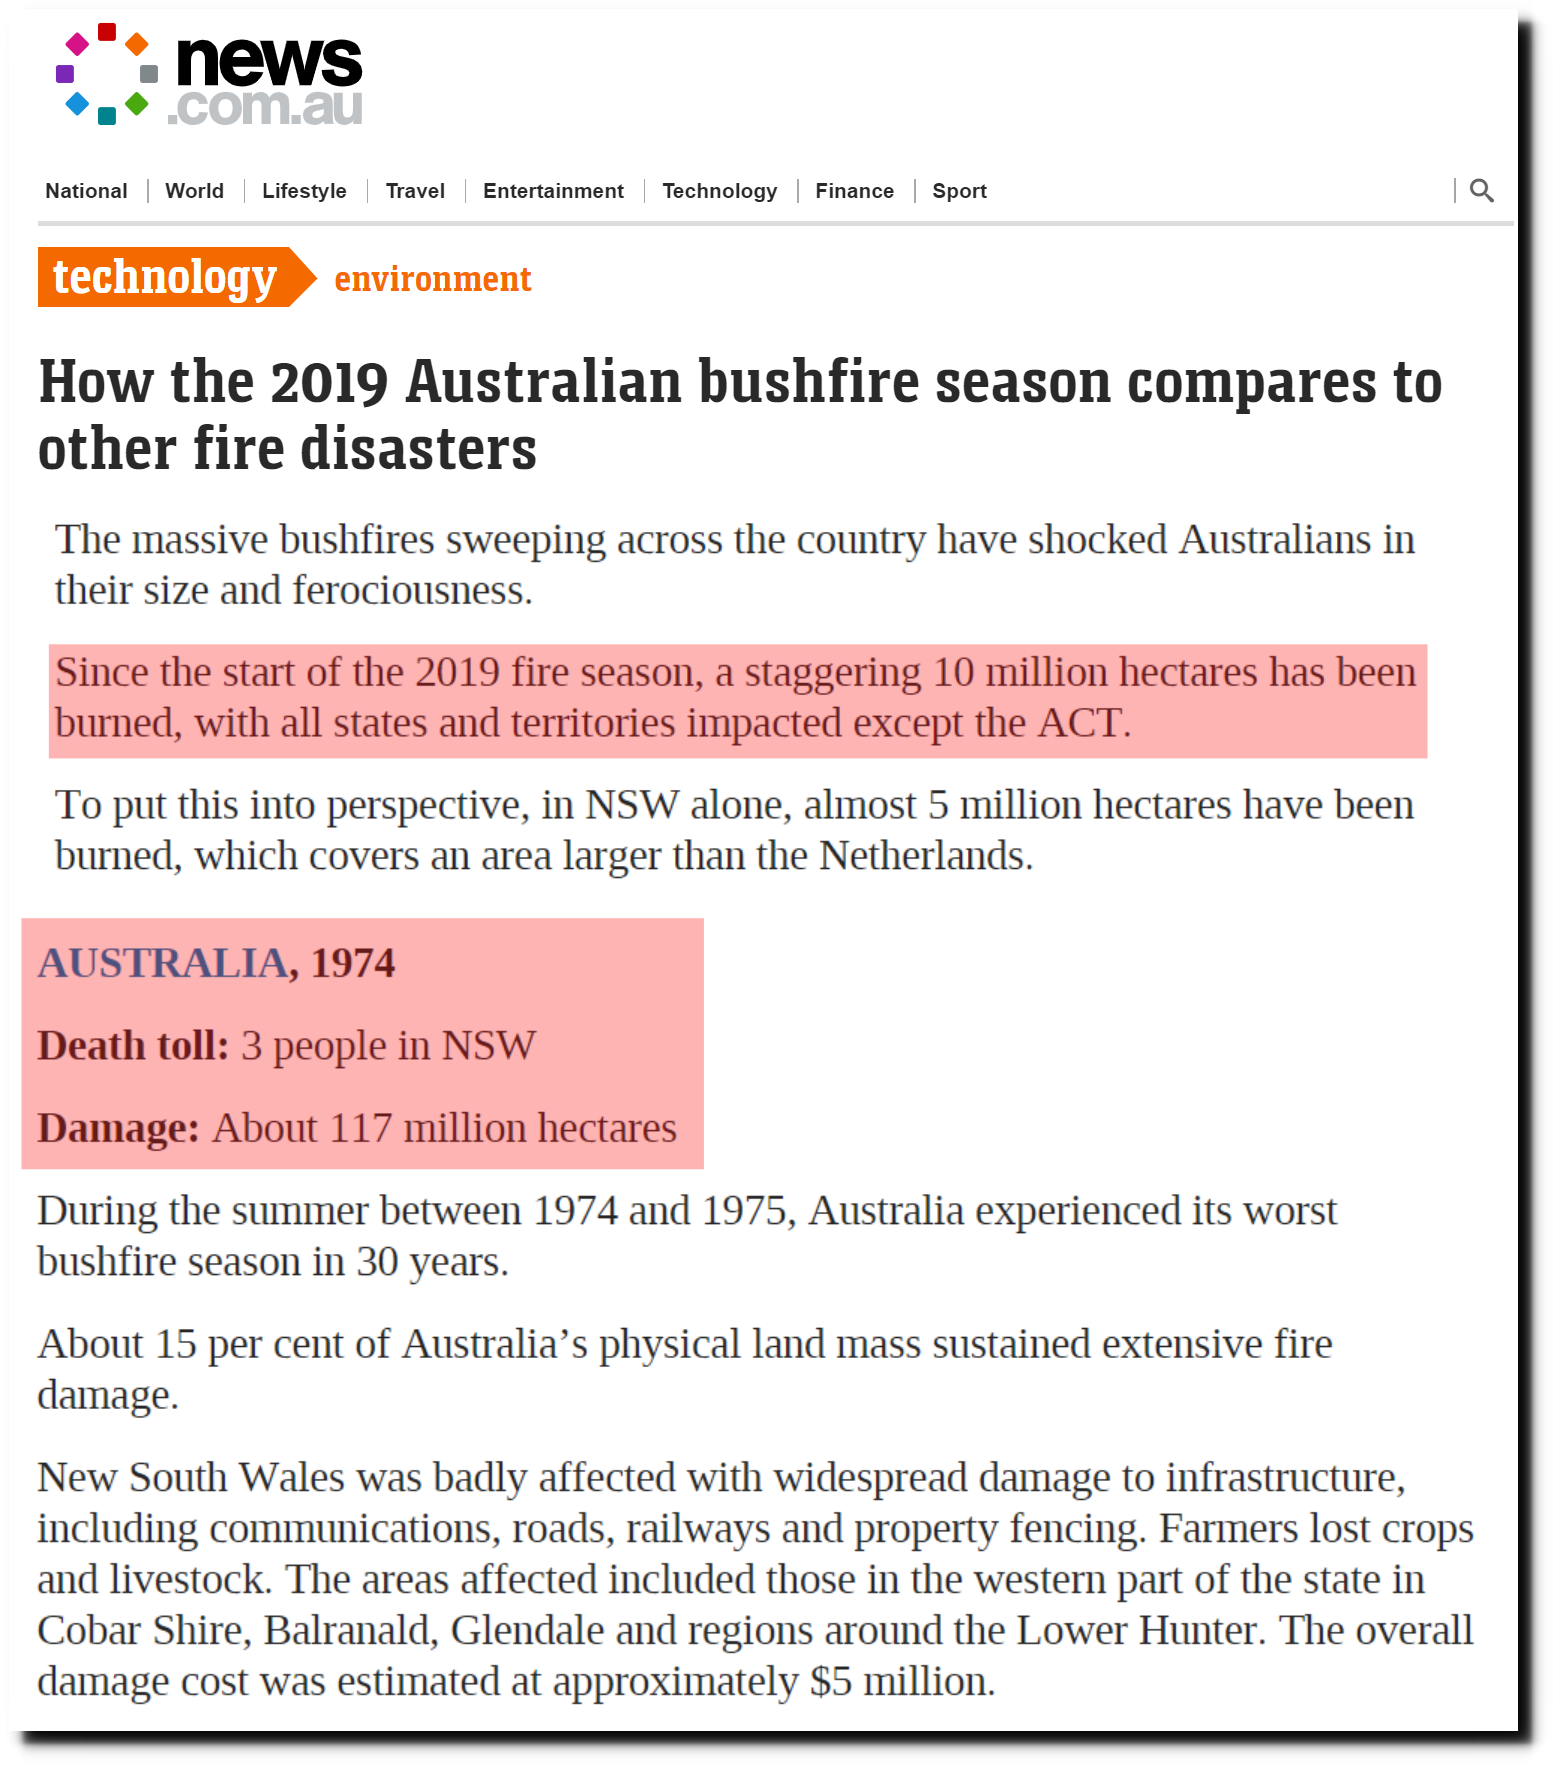
Australian bushfires: Why 2019 fire season is different from others
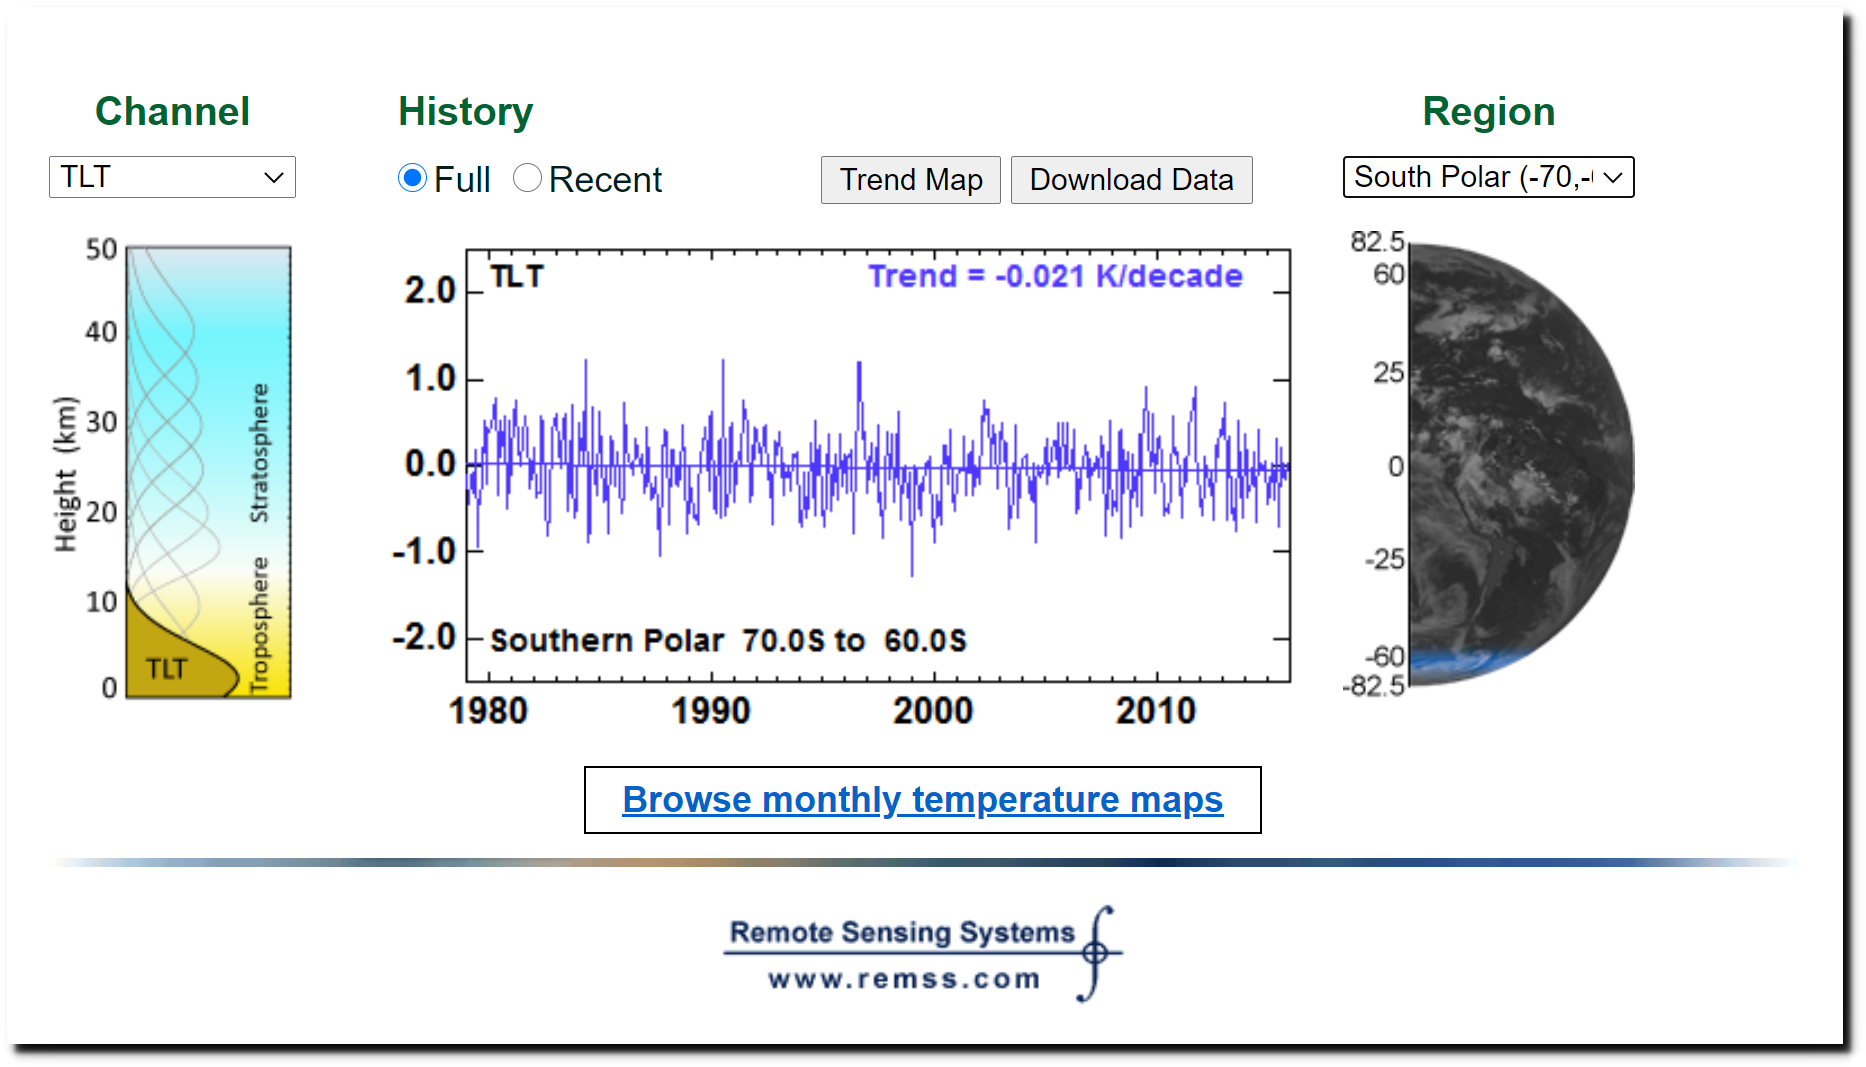
RSS / MSU and AMSU Data / Time Series Trend Browser
Pubs.GISS: Abstract of Shindell and Schmidt 2004
NASA Study: Mass Gains of Antarctic Ice Sheet Greater than Losses | NASA
During the global cooling scare 40 years ago, the National Science Foundation program manager for glaciology (Richard Cameron) said :
We’re seeing the west ice sheet on its way out. …. It has nothing to do with climate, just the dynamics of unstable ice.
Experts warned of 20 feet of sea level rise.
23 Jan 1977, Page 13 – Independent Press-Telegram at Newspapers.com
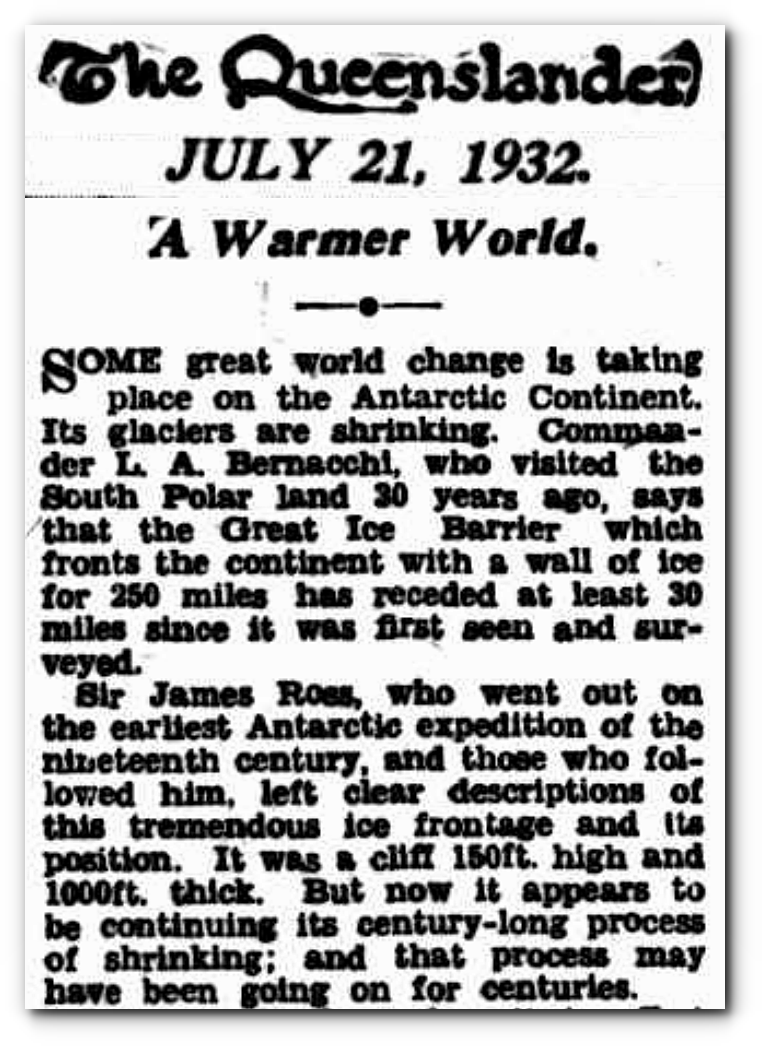
21 Jul 1932 – A Warmer World. – Trove
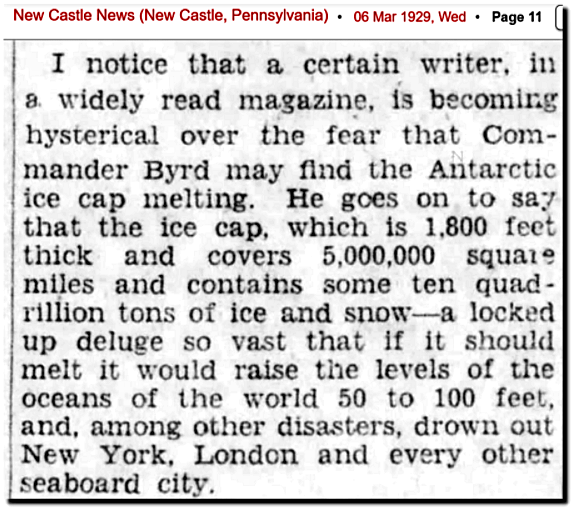
6 Mar 1929, Page 11 – at Newspapers.com
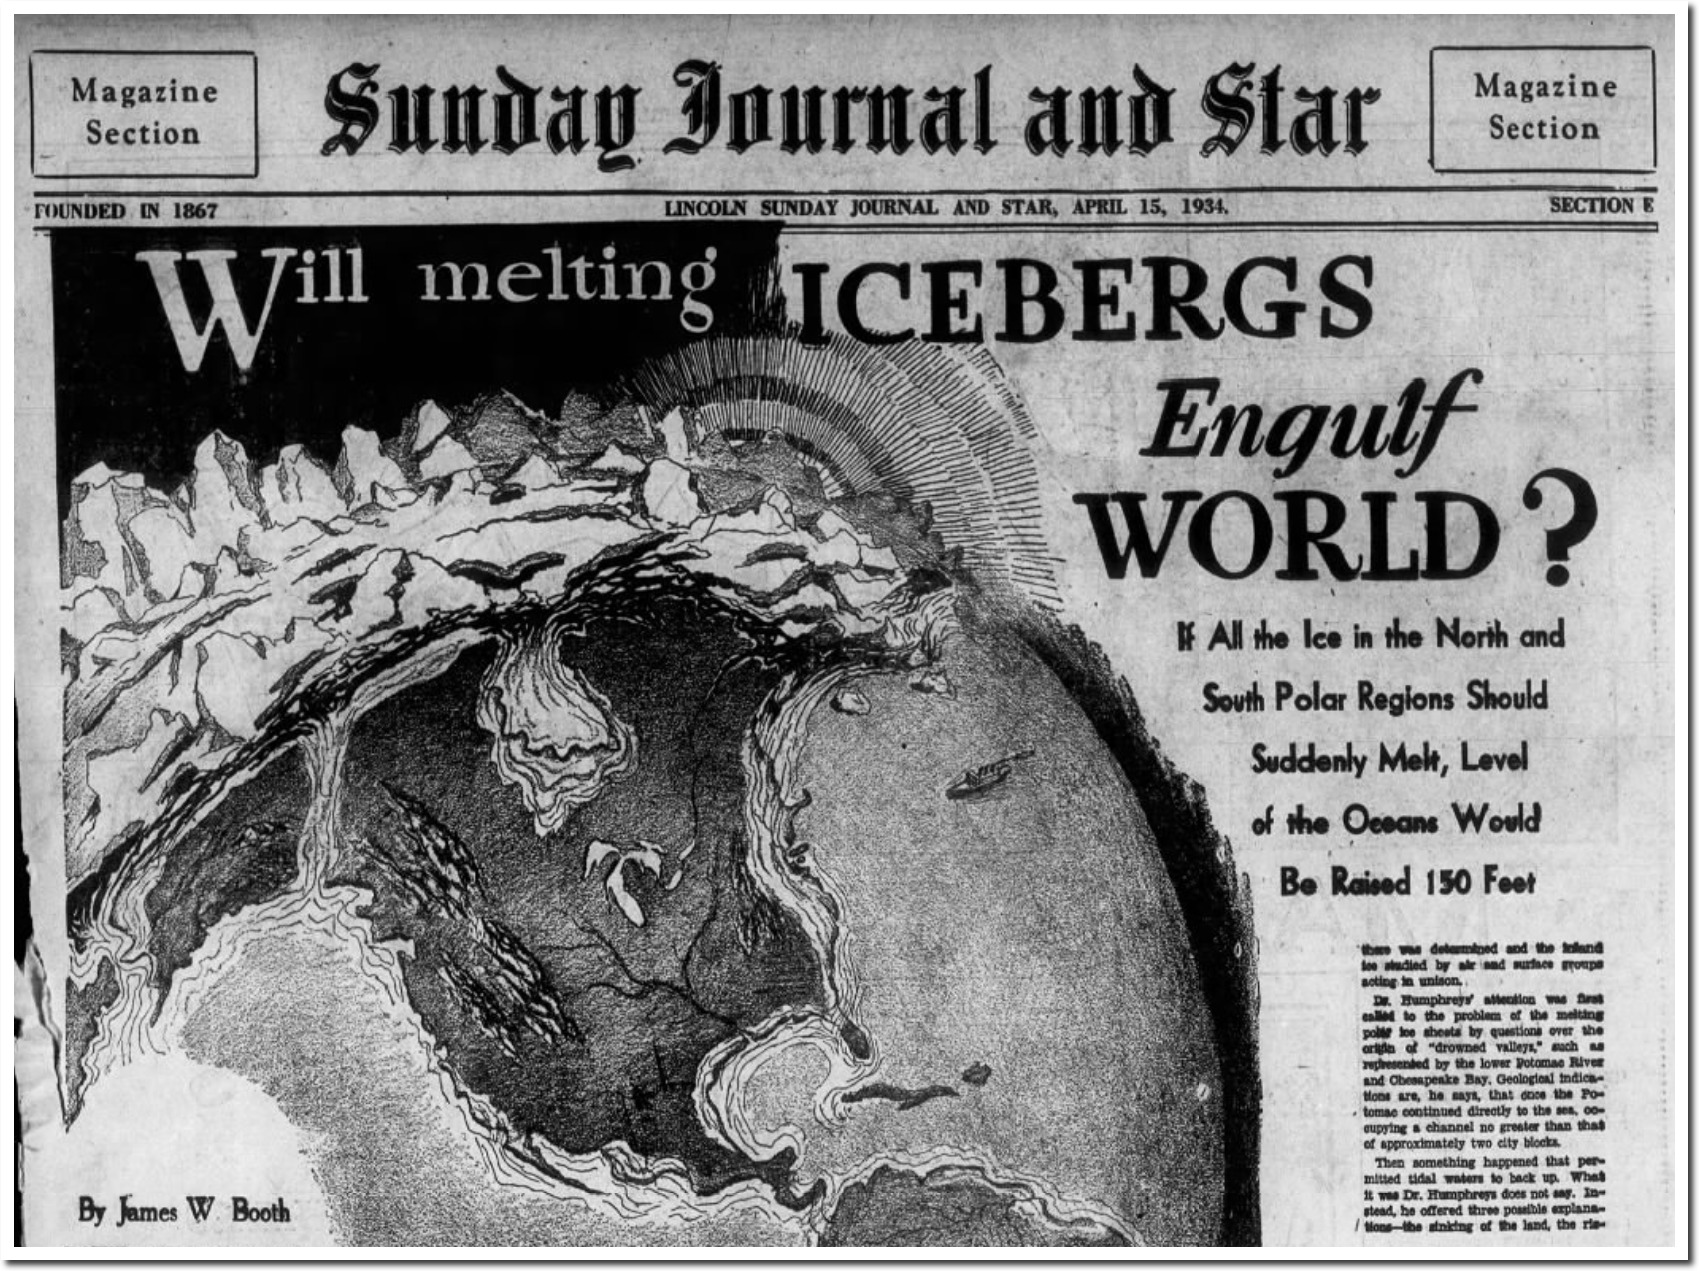

15 Apr 1934, 33 – The Nebraska State Journal at Newspapers.com
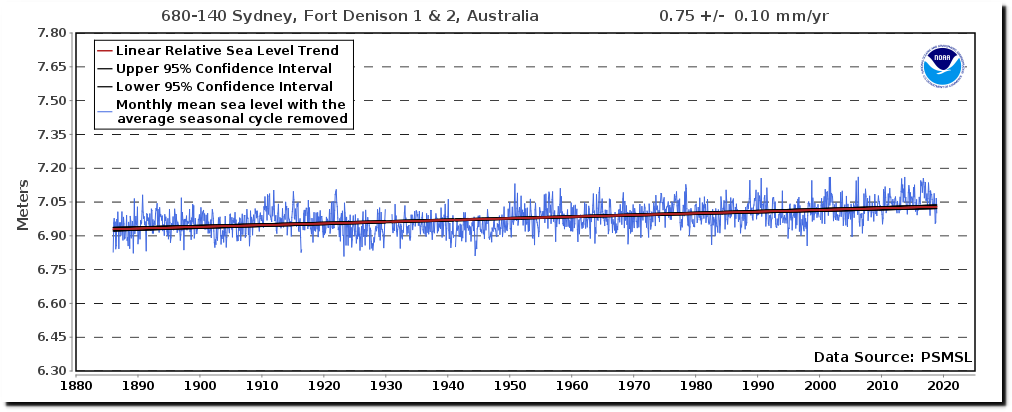
680-140 Sydney, Fort Denison 1 & 2, Australia
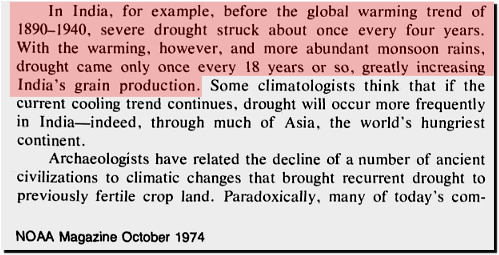
ftp://ftp.library.noaa.gov/docs.lib/htdocs/rescue/journals/noaa/QC851U461974oct.pdf


