
Disrupting the Borg is expensive and time consuming!

Google Search
-
Recent Posts
- You Can’t Fool Mother Nature
- Cattle And The Climate
- One Atomic Bomb Per Hour
- New Video : Analyzing Oil And Gas
- Is Antarctica Melting?
- High Speed Analysis And Visualization
- El Nino To The Rescue?
- Fake News Update
- Growth Of Antarctic Sea Ice
- 65 Years Of Progress!
- El Nino To The Rescue?
- Worst March Drought On Record
- ChartGL Process Control Demo
- The Biggest Money Laundering Scam
- Drought In The Headwaters Of Lake Powell
- Unrealistic Expectations Of Water Availability
- Did Bill Gates Do This?
- Worst March Drought On Record In The US
- The Real Hockey Stick Graph
- Analyzing The Western Water Crisis
- Gaslighting 1924
- “Why Do You Resist?”
- Climate Attribution Model
- Fact Checking NASA
- Fact Checking Grok
Recent Comments
- Bob G on You Can’t Fool Mother Nature
- Ivan G Wainwright on You Can’t Fool Mother Nature
- conrad ziefle on You Can’t Fool Mother Nature
- Bob G on You Can’t Fool Mother Nature
- Gordon Vigurs on You Can’t Fool Mother Nature
- arn on Cattle And The Climate
- Bob G on Cattle And The Climate
- Robertvd on Cattle And The Climate
- Bob G on Cattle And The Climate
- Robertvd on Cattle And The Climate
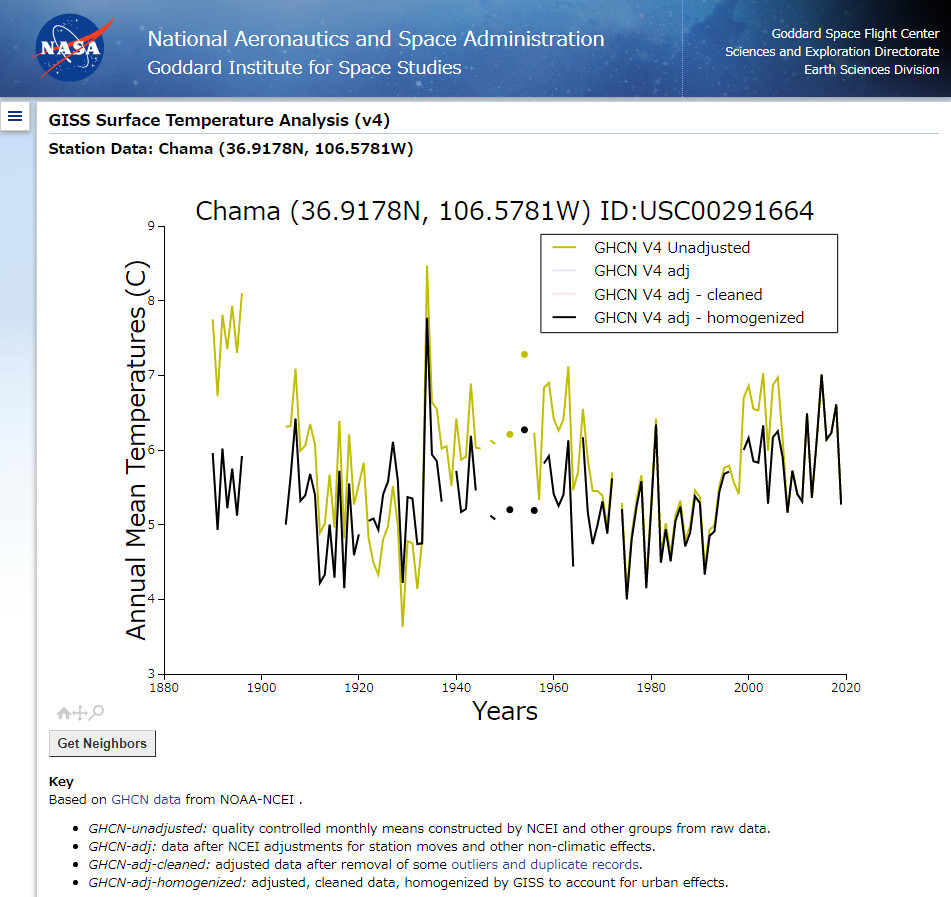
Chama, New Mexico Has Had A Cooling Trend Since 1890
Hi, everyone.
Today, I’d like to show you the animation chart below using the data from the NASA website.
As shown on the chart, the annual temperature in Chama, New Mexico has had a cooling trend of approximately 0.5? since 1890, but NASA changed the data.
You might have already seen a lot of similar cases. Examples: here and here.
Unfortunately, many people still haven’t heard any such reports from the media.
Posted in Uncategorized
Leave a comment
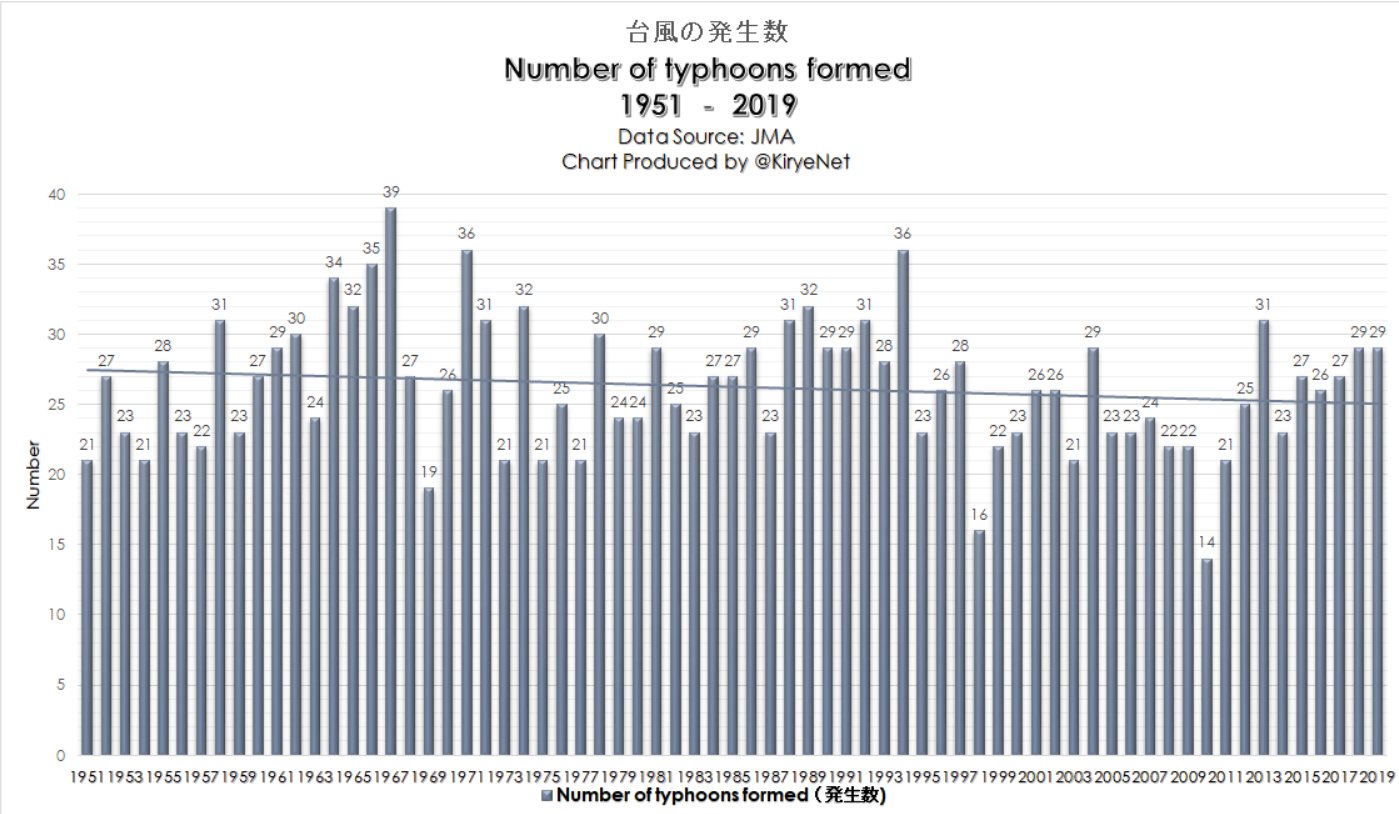
The Number Of Typhoons Formed Has Been Trending Down Modestly Since 1951
Hi, everyone.
Today, I’d like to show you the data for typhoons.
Japanese climate alarmists said that the number of typhoons has increased as the years rolled on.
However, in fact, the number of typhoons formed has been trending down modestly since 1951, and this July was the first July to have seen no typhoons formed at all.
During August seven typhoons formed, which was not particularly unusual.
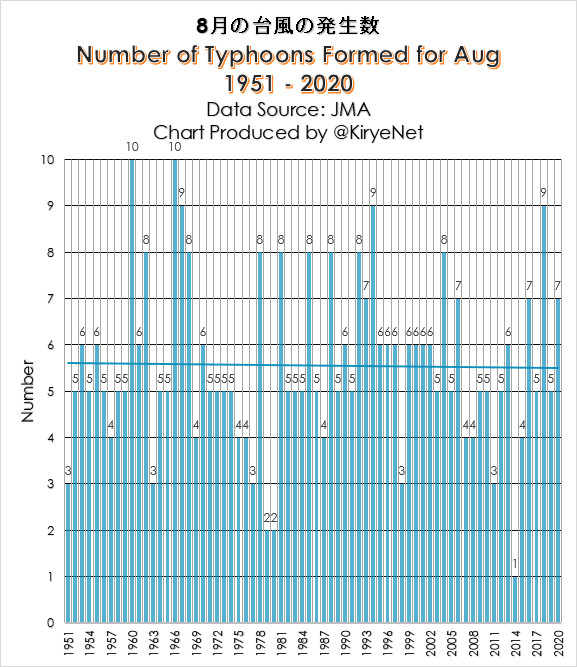
The following chart shows the number of typhoons formed in the Pacific each year from January through August.
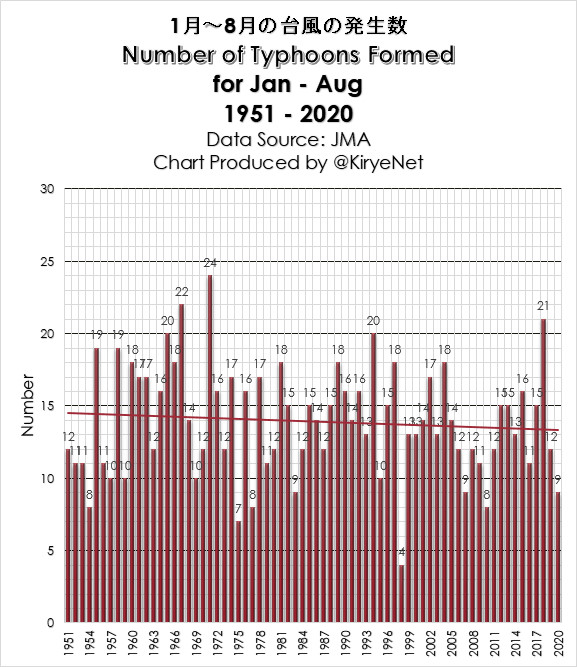
As you can see, this year so far, the number of typhoons is less than usual.
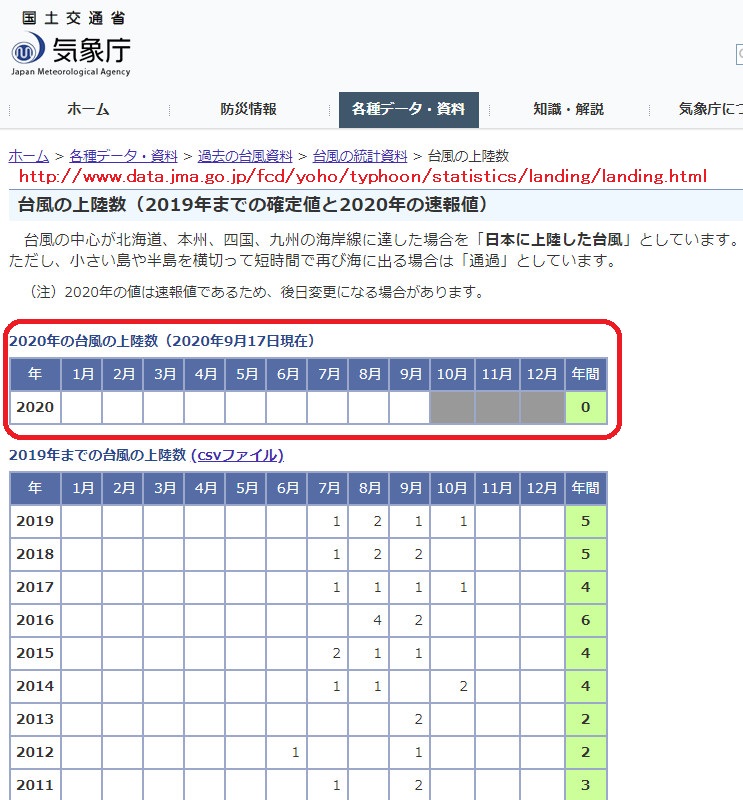
In addition, as of September 17, the number of typhoons landings in Japan this year is still zero, according to the Japan Meteorological Agency (JMA).
I think Japanese climate alarmists have never checked the data, or they are simply lying.
Posted in Uncategorized
Leave a comment