On this date in the year 1900, Iceland was hit by a major hurricane.

28 Sep 1900, 12 – The Guardian at Newspapers.com
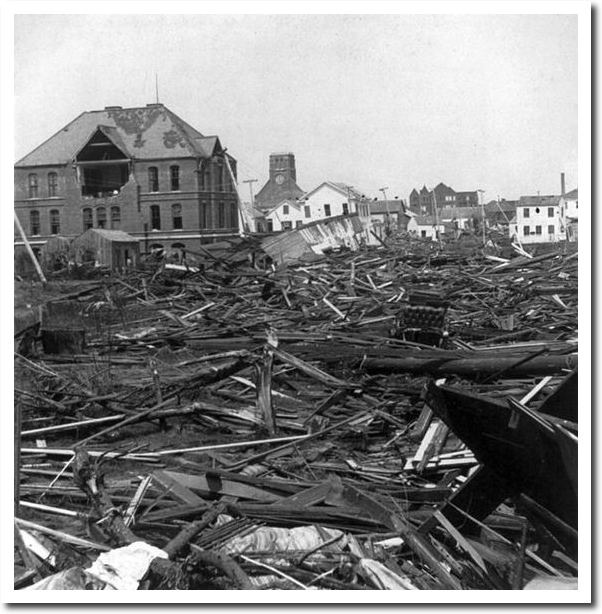
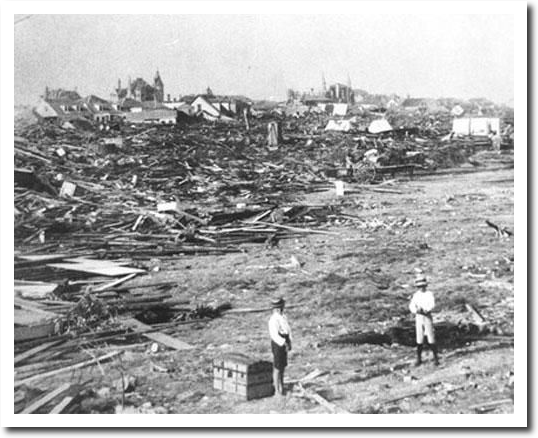
This came a few days after the deadliest hurricane in US history.
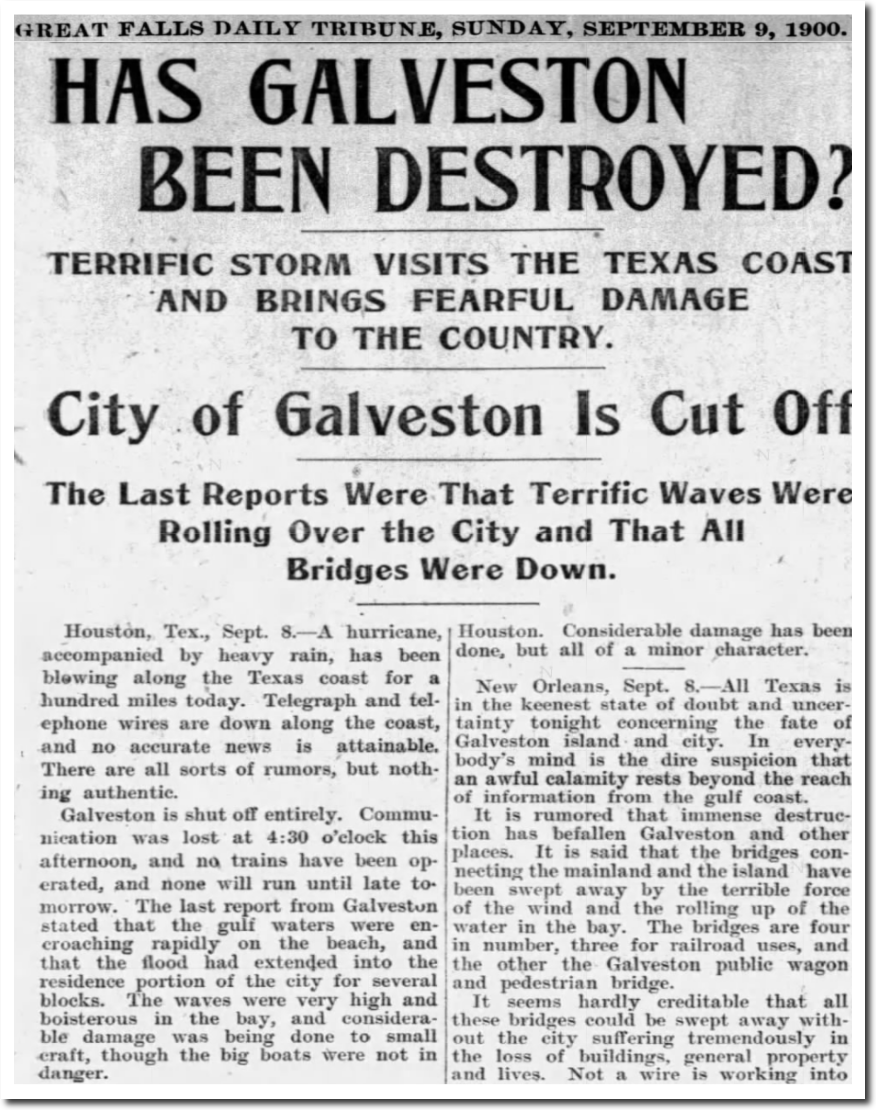
09 Sep 1900, 7 – Great Falls Tribune at Newspapers.com


On this date in the year 1900, Iceland was hit by a major hurricane.
28 Sep 1900, 12 – The Guardian at Newspapers.com
This came a few days after the deadliest hurricane in US history.
09 Sep 1900, 7 – Great Falls Tribune at Newspapers.com
Hi, everyone.
As you know, Tony has created many charts showing how the frequency of heat wave days has declined in the USA.
Today, I’d like to show Sapporo City‘s number of days over 30? for the period January 1 to August 31.
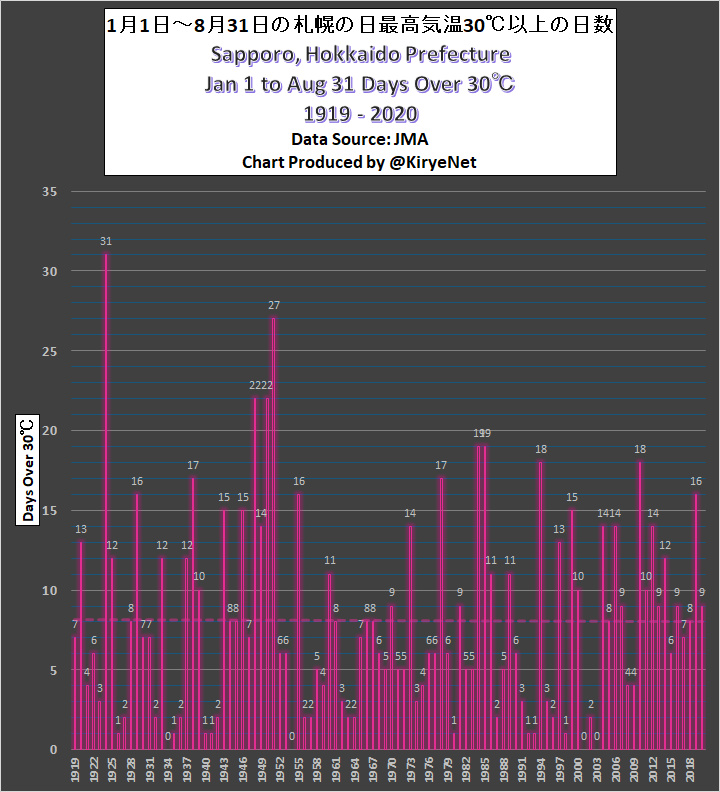
As you can see, there has been no trend since 1919.
However, last year the Asahi Shimbun says that even in Sapporo, the temperature has been over 30? more frequently recently.
Obviously the newspaper ignored the data.
Hi, everyone.
Almost certainly you’ve seen the temperature charts put out by government agencies like NASA and NOAA going back to about 1880 and often shown by our mainstream media.
However, as some climate realists include Tony, Mr. Joseph D’Aleo and Mr. Anthony Watts have already explained, humans don’t have enough thermometer data to truly estimate the Earth’s temperature change since 1880.
I tweeted about this, and again let me show you the map from NASA’s website.

I bet anyone who hasn’t been indoctrinated seeing the animation would feel the same way.
In addition, climatologist/former NASA researcher Dr. Mototaka Nakamura wrote that over the last 100 years “only 5 percent of the Earth’s area is able show the mean surface temperature with any certain degree of confidence.”
I’m sure that 5 percent area data cannot offset the 95 percent remaining area with no data. If climate alarmists noticed that, what percent of them would continue to believe the AGW hypothesis, I wonder.
Hi everyone!
As Tony announced, I, @KiryeNet, am a new member on his Real Climate Science team! Have you seen his video? If not, please do take a look at it.
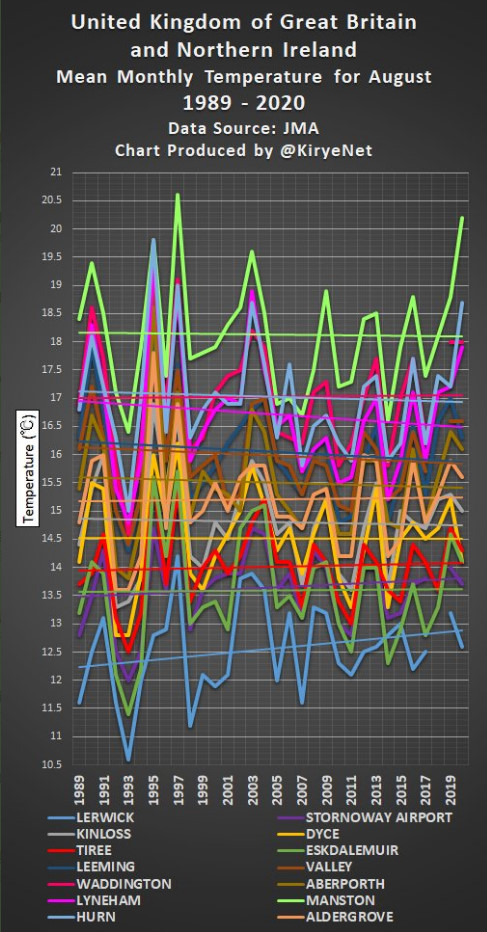
I like charting data, and so I made this one today.
As you can see, 8 of 14 stations in UK show August mean temperatures have had a cooling or no warming trend since 1989.
(Note: those 14 stations have sufficient data dating back at least to 1980’s on the Japan Meteorological Agency’s website).
People gripped in fear by climate alarmists need to understand there is nothing to worry about in the UK when it comes to catastrophic warming, which is just a scam.
If you want to check out other charts I made, you can see them on Pierre Gosselin’s blog: NoTricksZone or my tweets.