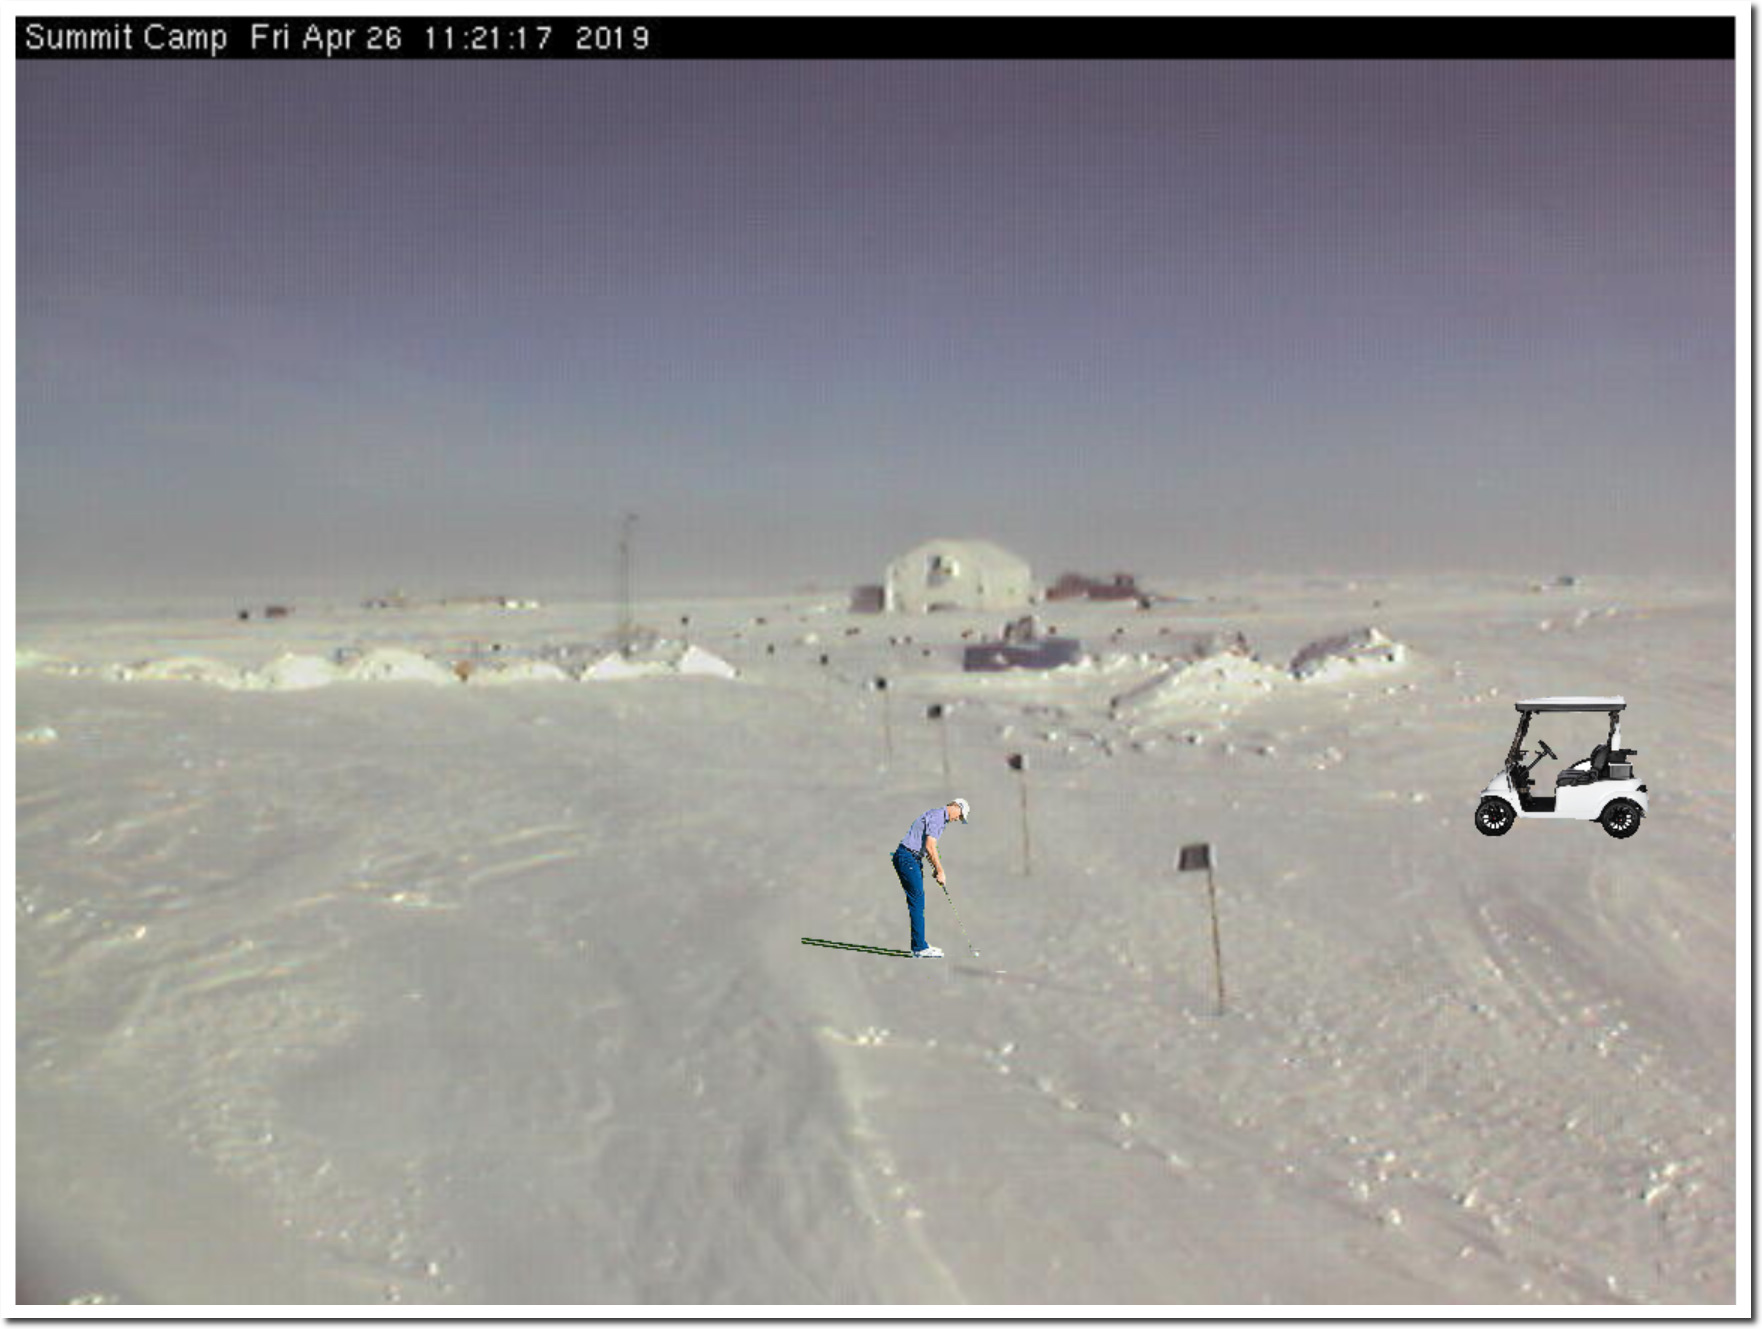
Day Two At The Greenland Open

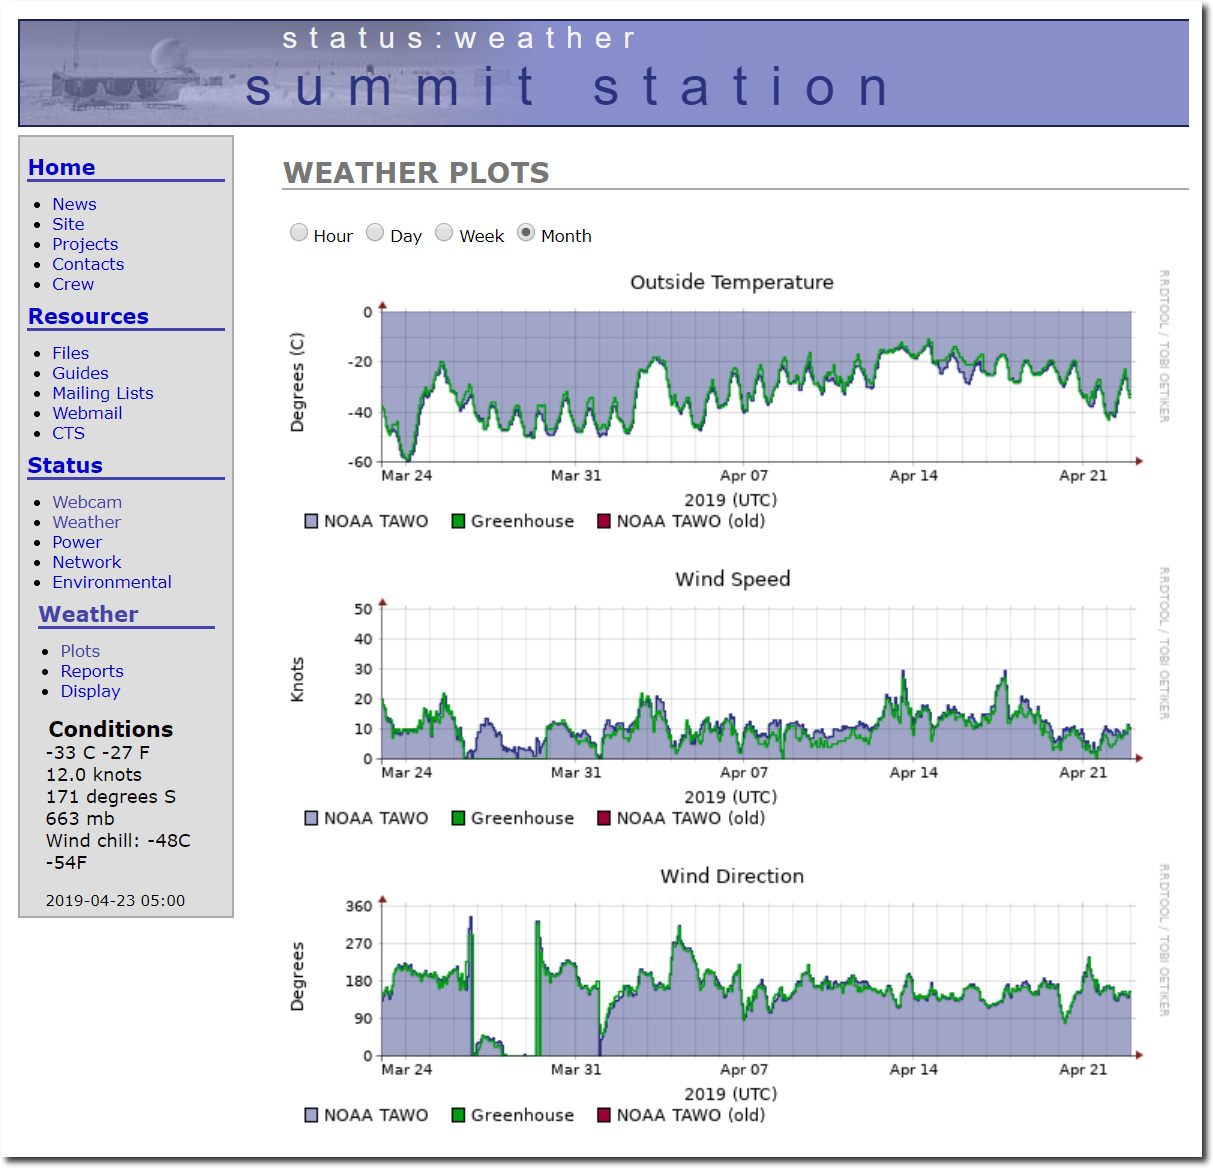
After receiving 100 billion tons of snow this month, the Greenland Open is having  a beautiful day today – with temperatures up to a balmy -18C.

summit:status:webcam

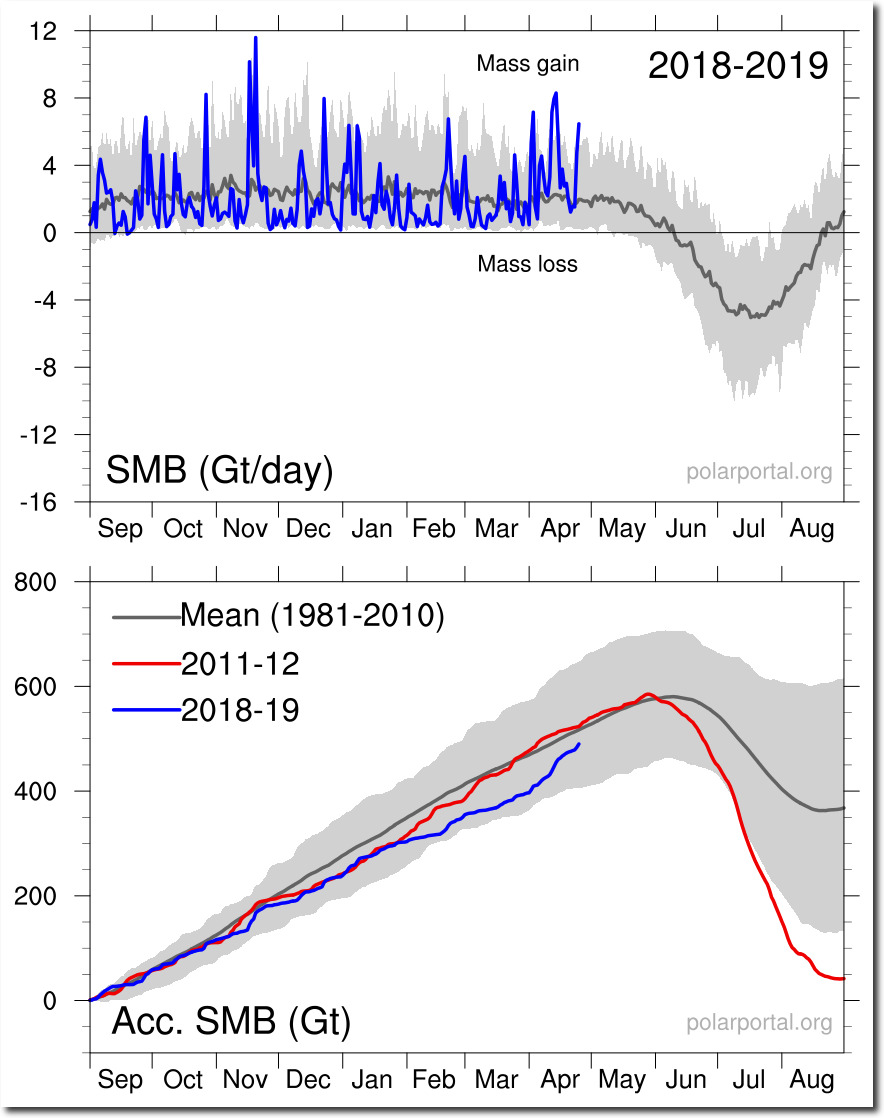
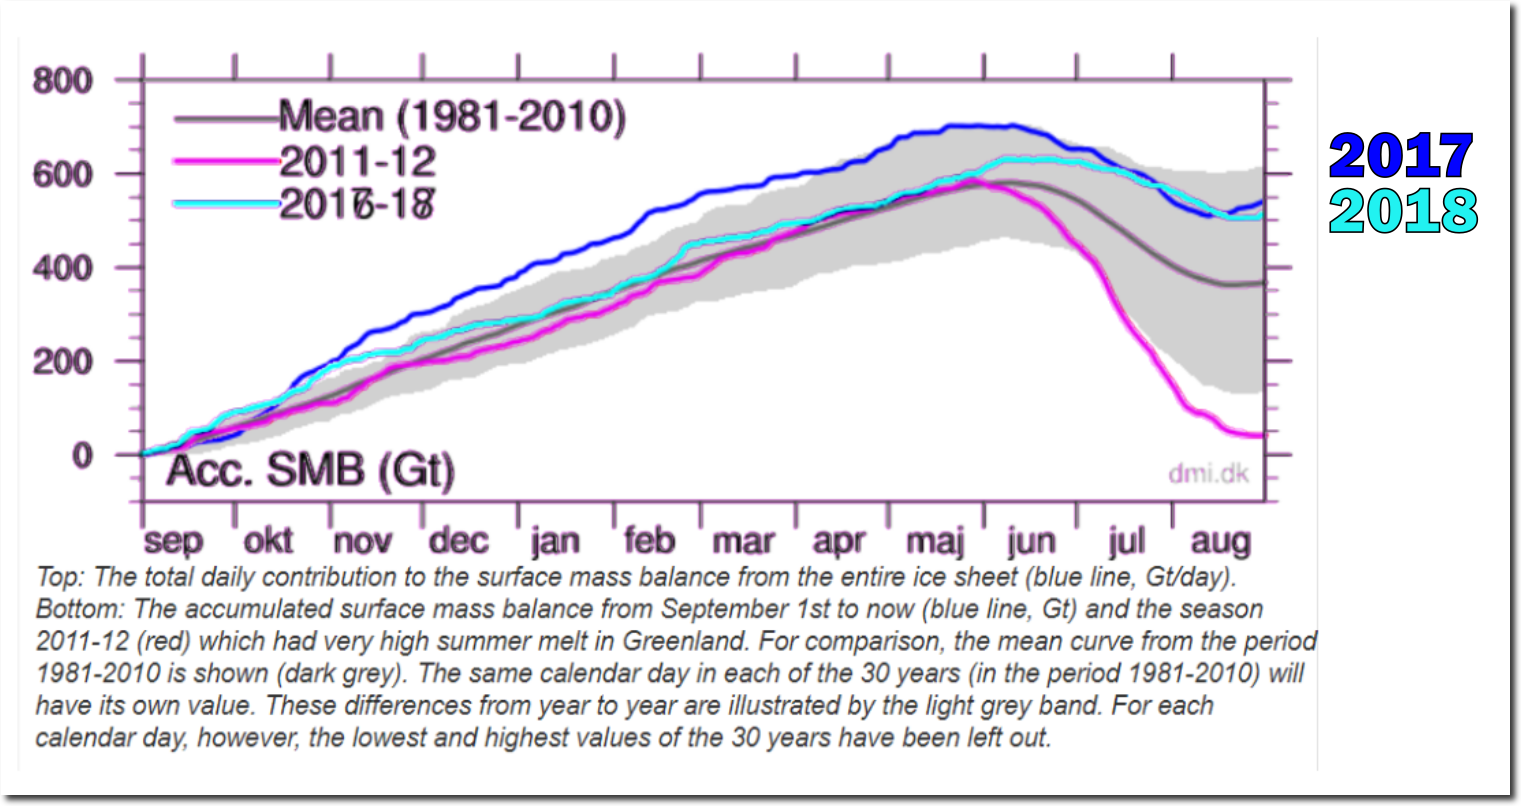
Greenland’s surface has not loss mass on any day since September 1 of last year, and has gained nearly 500 billion tons of ice.

SMB_curves_LA_EN_20190425.png (846×1080)

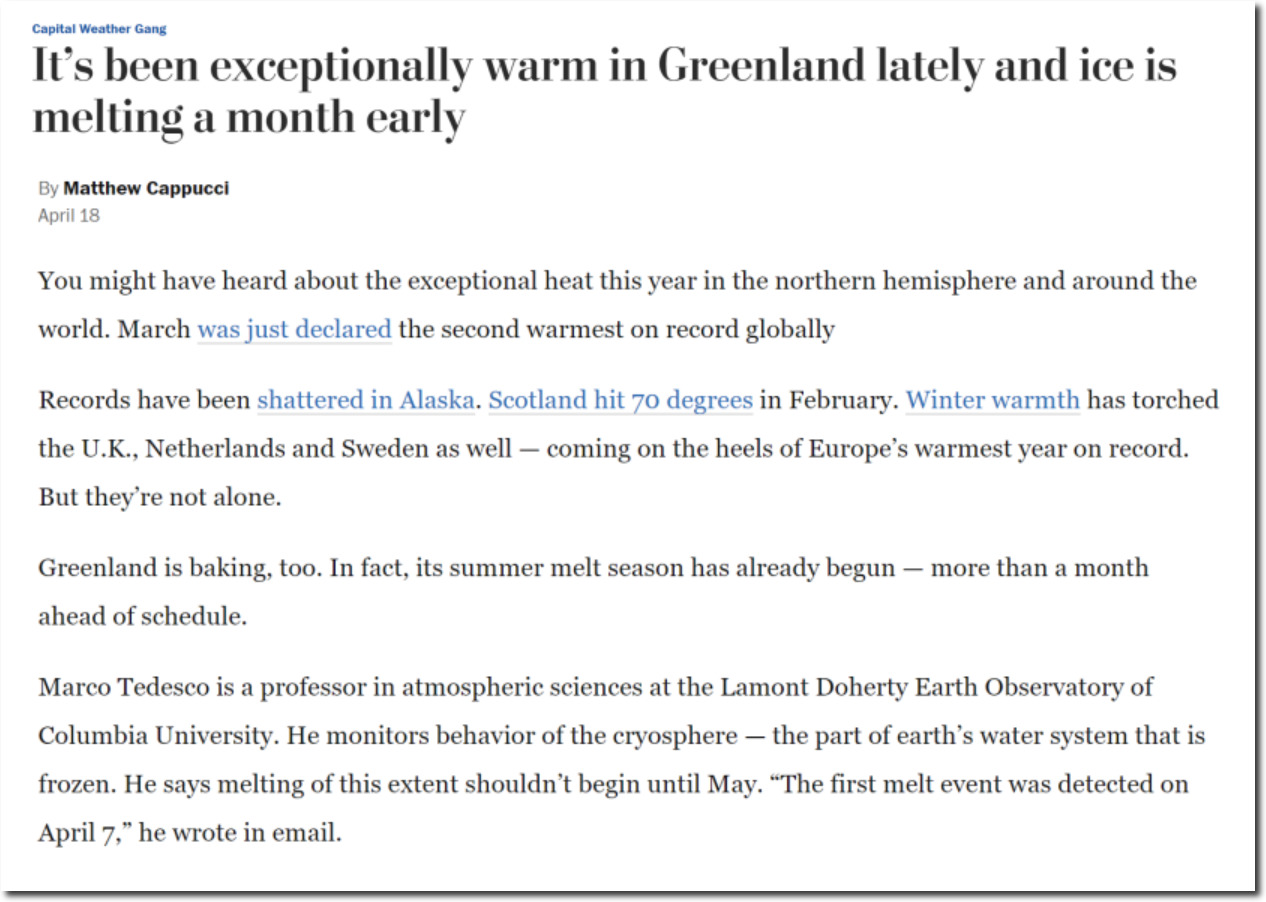
US Experts say Greenland is baking has been experiencing unusual melting this month.

Greenland is baking, too. In fact, its summer melt season has already begun — more than a month ahead of schedule.

It’s been exceptionally warm in Greenland lately and ice is melting a month early – The Washington Post


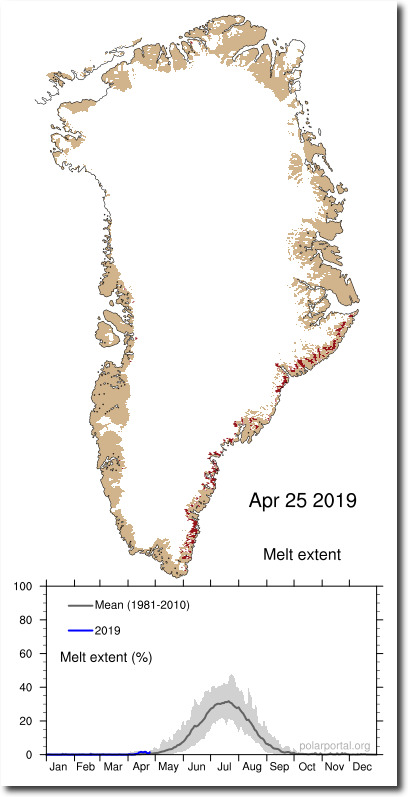
Data from the Danish Meteorological Institute doesn’t back up their claims, but the Danes will be sorry about their denial when the world ends in eleven years and eight months.

Surface Conditions: Polar Portal

Posted in Uncategorized | Leave a comment

Driver Swerved Away From The Runaway Truck Ramp

Video shows a semitrailer out of control in mountains ahead of fiery I-70 crash | FOX31 Denver

Posted in Uncategorized | Leave a comment

Birds Are Always Keeping An Eye Out For Global Warming

Posted in Uncategorized | Leave a comment

A Man Of High Ethics

Experts say Robert Mueller is a man of high ethical standards.

Posted in Uncategorized | Leave a comment

Adjusting Good Data To Make It Match Bad Data

mwr-035-01-0007b.pdf

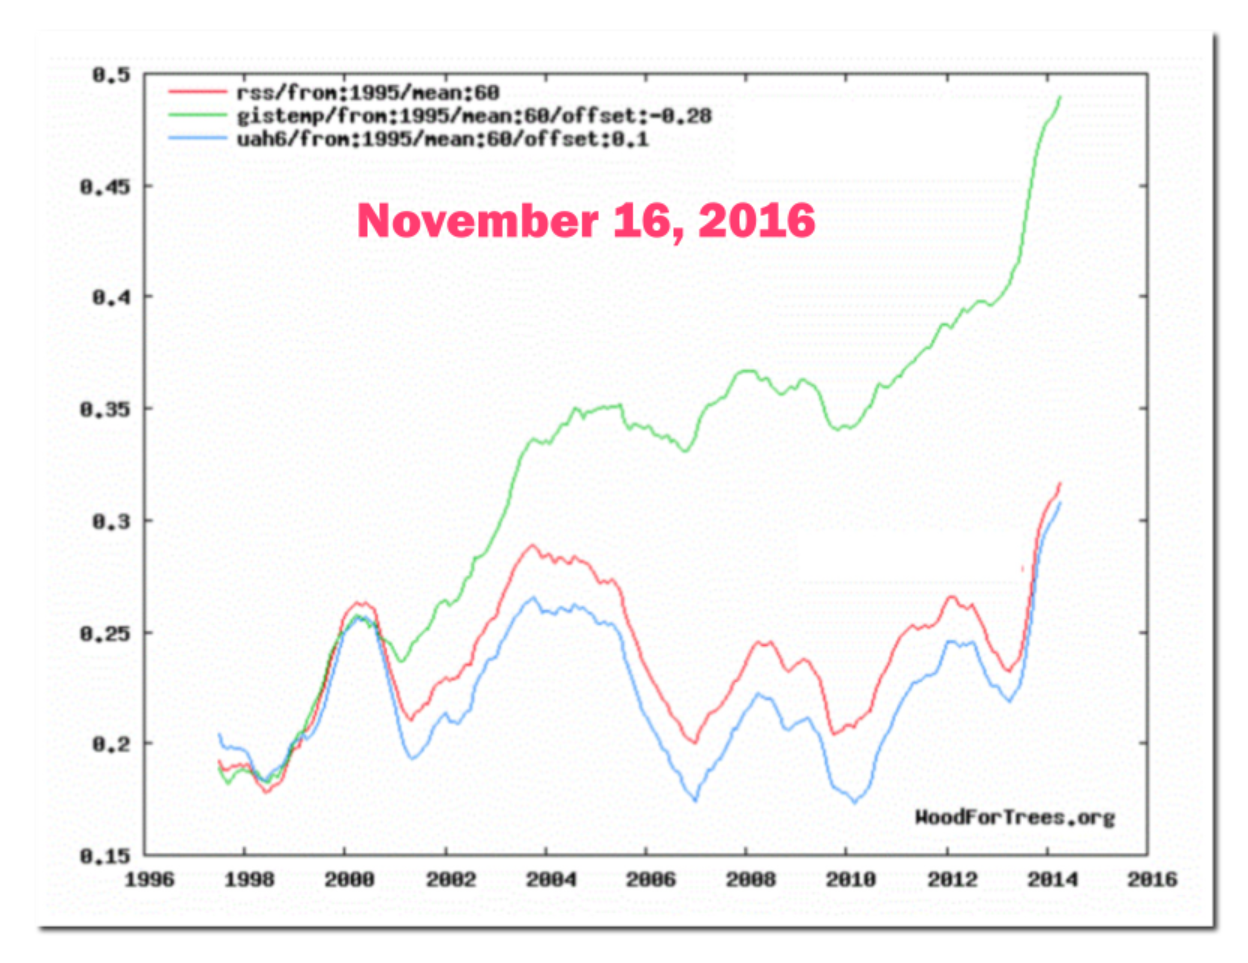
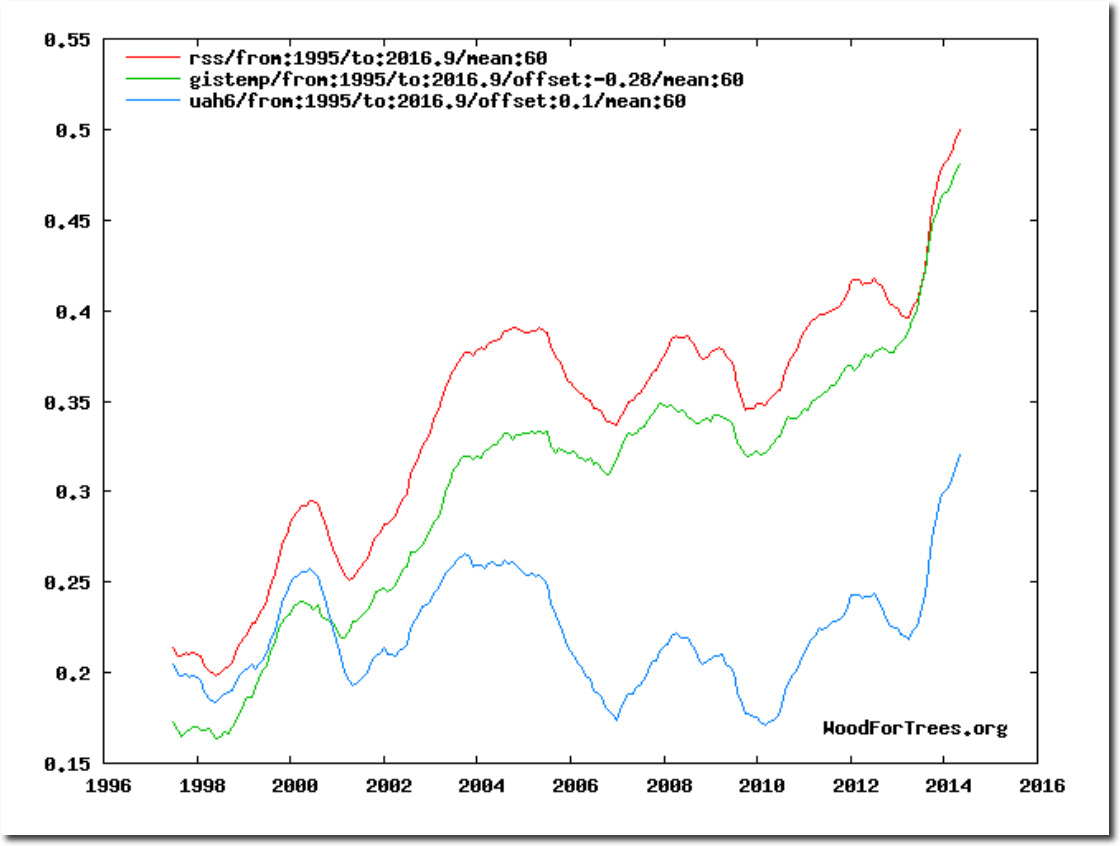
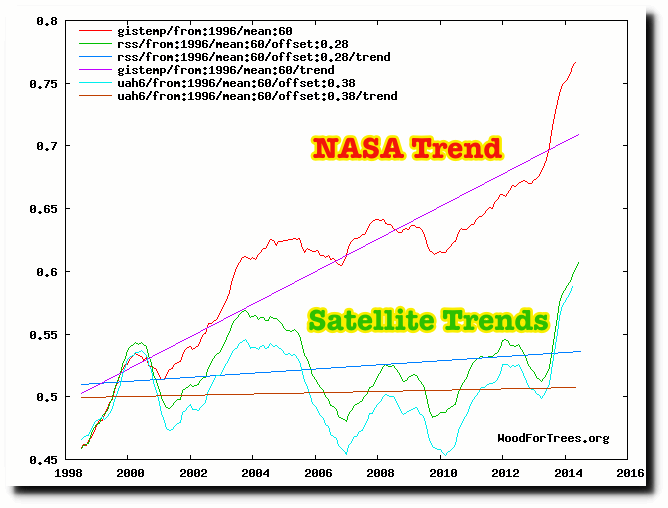
On election day in 2016, both satellite data sets (UAH and RSS) showed a 15 year long hiatus in global warming, and bore no resemblance to the warming trend being generated by NOAA and NASA.  I captured this image in a November 16, 2016 blog post.
Gavin Schmidt Promises To Resign | The Deplorable Climate Science Blog

This is what the same graph looks like now.
Wood for Trees: Interactive Graphs

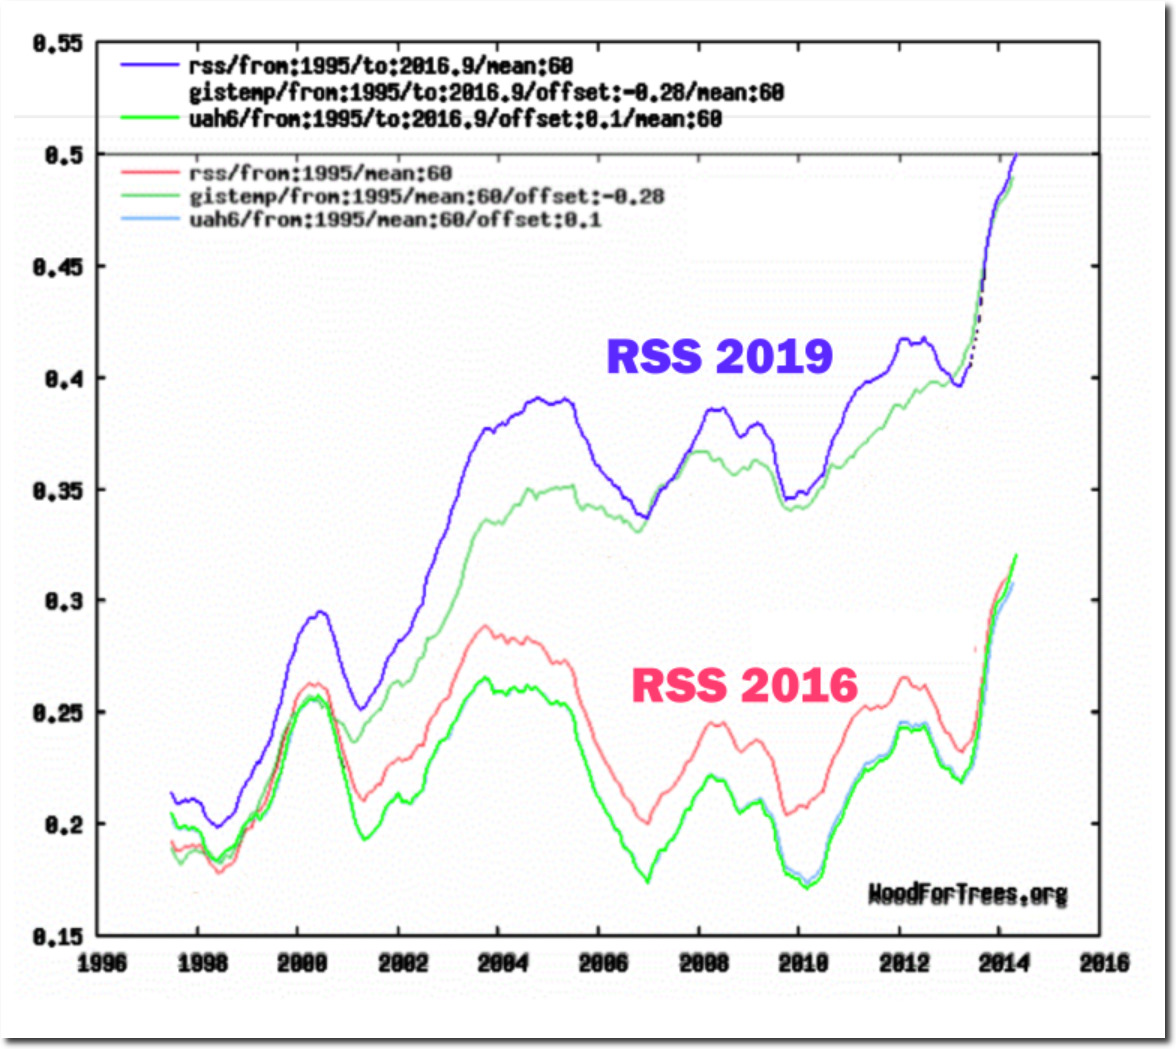
In the next image, I overlaid the current RSS graph on the 2016 image.  You can see how RSS was adjusted to match the NASA data.
I predicted this would happen on

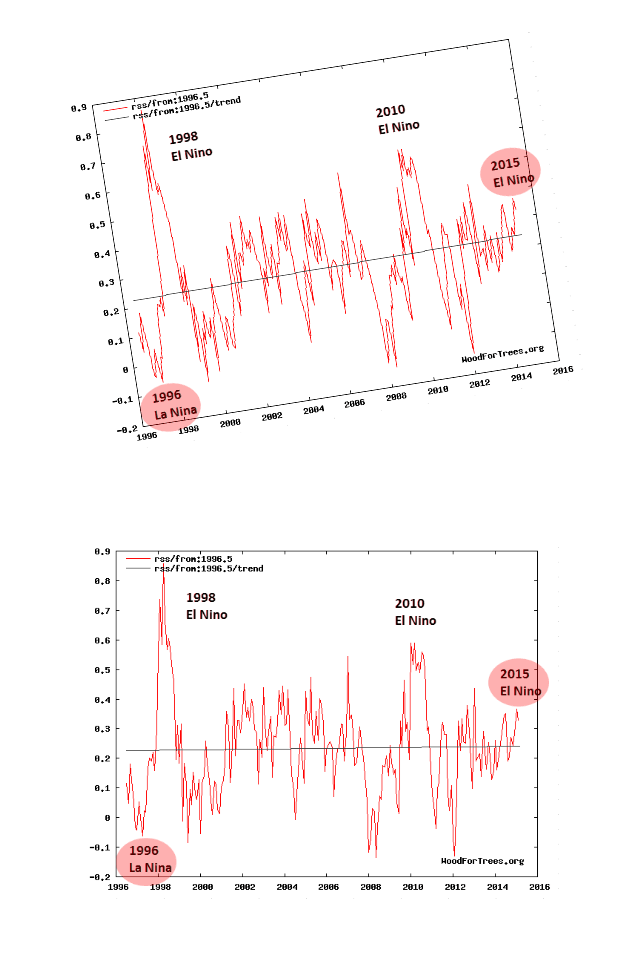
Look for the satellite data to be adjusted to bring it into compliance with the fully fraudulent surface temperatures. The Guardian is now working to discredit UAH, so it seems likely that RSS will soon be making big changes – to match the needs of the climate mafia. Bookmark this post.
RSSChanges

Roy Spencer at UAH made the same prediction on January 9, 2017

“I expect there will soon be a revised TLT product from RSS which shows enhanced warming, too.

Here’s what I’m predicting:

1) neither John Christy nor I will be asked to review the paper

2) it will quickly sail through peer review (our UAH V6 paper is still not in print nearly 1 year after submission)

3) it will have many authors, including climate model people and the usual model pundits (e.g. Santer), which will supposedly lend legitimacy to the new data adjustments.

Let’s see how many of my 3 predictions come true.

-Roy”
Wood for Trees: Interactive Graphs

The reason I made this prediction was because Ted Cruz used an RSS graph in a Senate hearing in March of 2015. Carl Mears at RSS then came under intense pressure to make his data match the surface temperature data.
My particular dataset (RSS tropospheric temperatures from MSU/AMSU satellites) show less warming than would be expected when compared to the surface temperatures. All datasets contain errors. In this case, I would trust the surface data a little more because the difference between the long term trends in the various surface datasets (NOAA, NASA GISS, HADCRUT, Berkeley etc) are closer to each other than the long term trends from the different satellite datasets. This suggests that the satellite datasets contain more “structural uncertainty” than the surface dataset.

Ted Cruz says satellite data show the globe isn’t warming

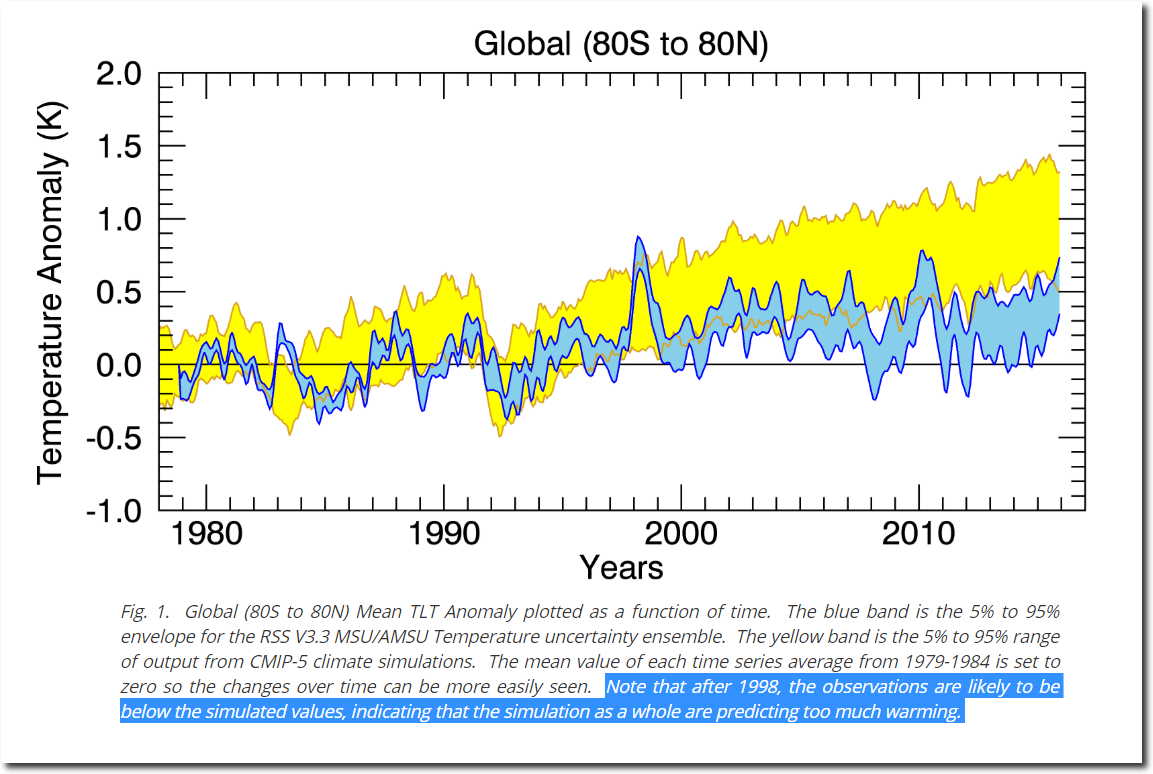
You can see what Mears did to bring his data into compliance. This was his web page in November 2016.

Note that after 1998, the observations are likely to be below the simulated values, indicating that the simulation as a whole are predicting too much warming.
Climate Analysis | Remote Sensing Systems

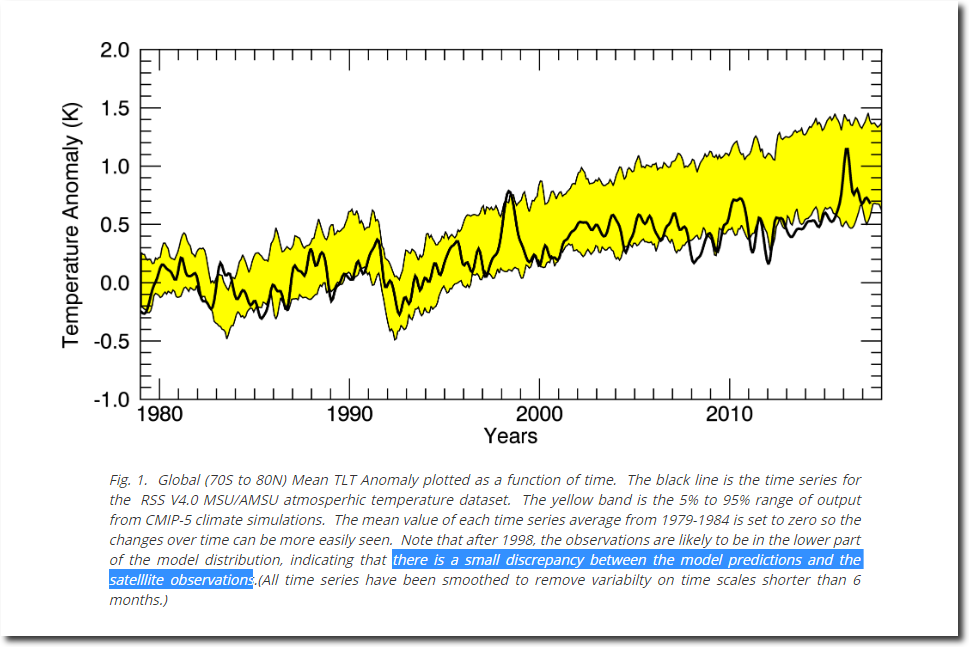
But under intense pressure,  Mears altered his own data to bring it into compliance.  The large discrepancy became a small discrepancy.

there is a small discrepancy between the model predictions and the satellite observations.
Remote Sensing Systems

The image below overlays Mears’ old graph (V3) on his new one (V4.) It is clear what he did – he  eliminated the blue error interval, and started using the high side of the interval as his temperature.
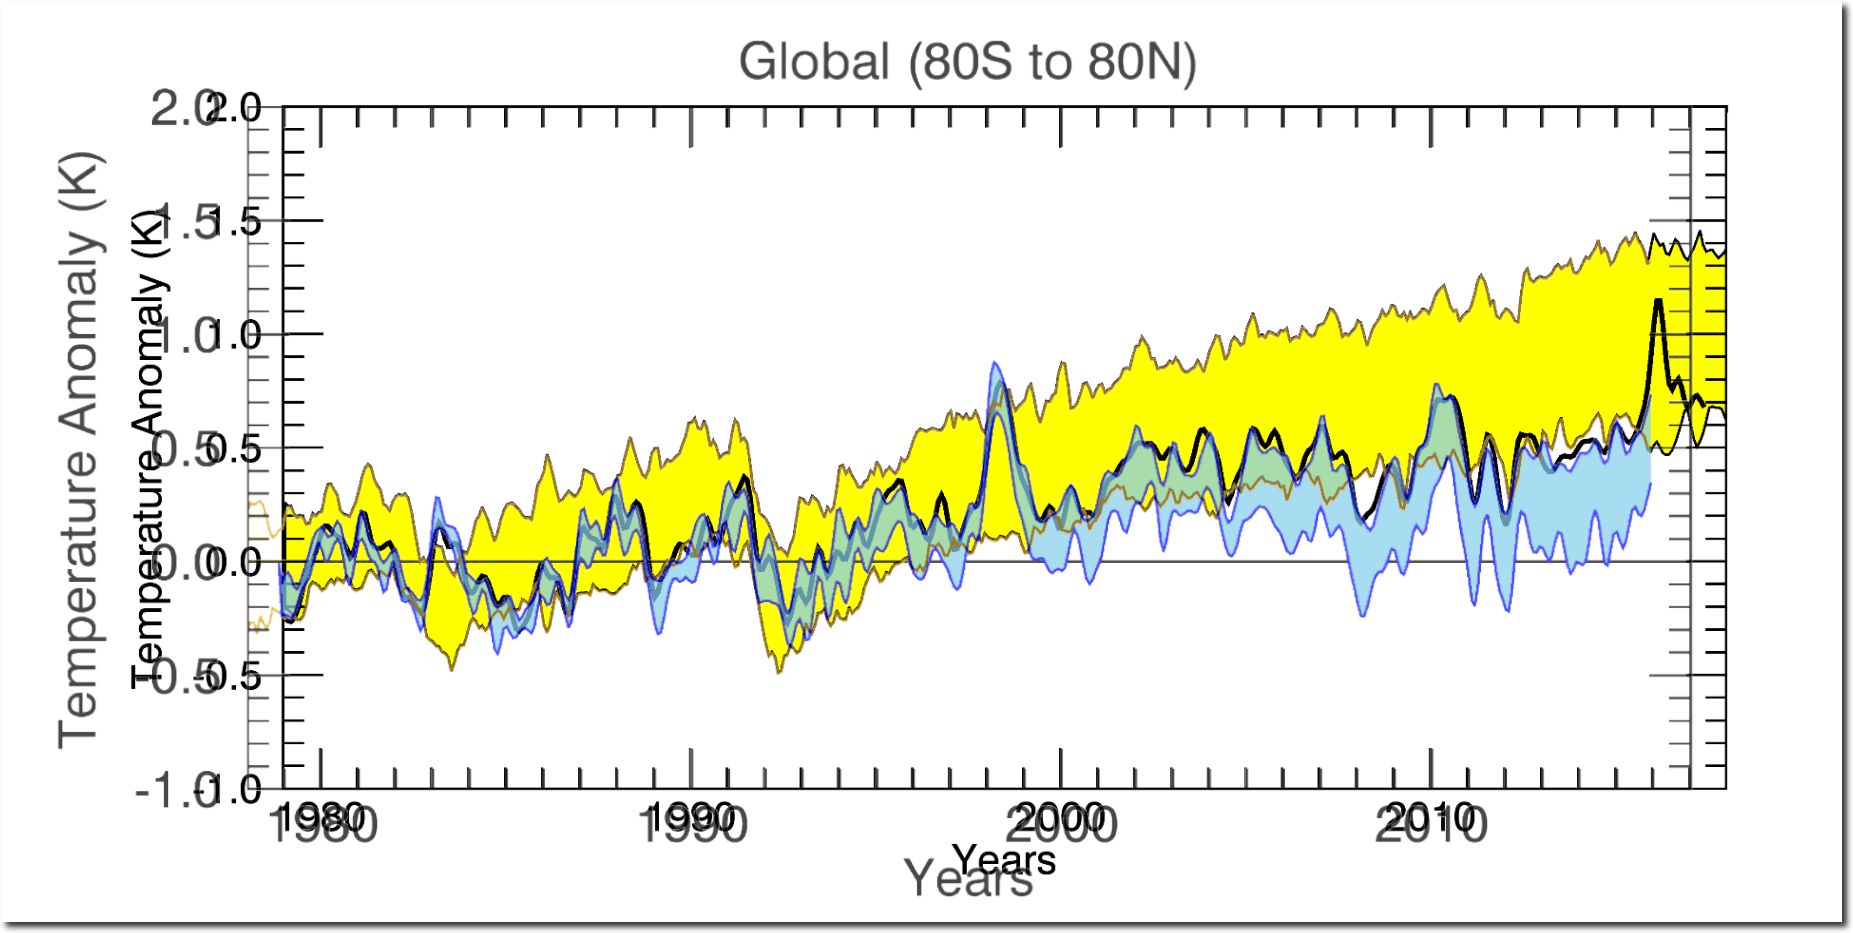
RSS V3 shows no warming since 2002.
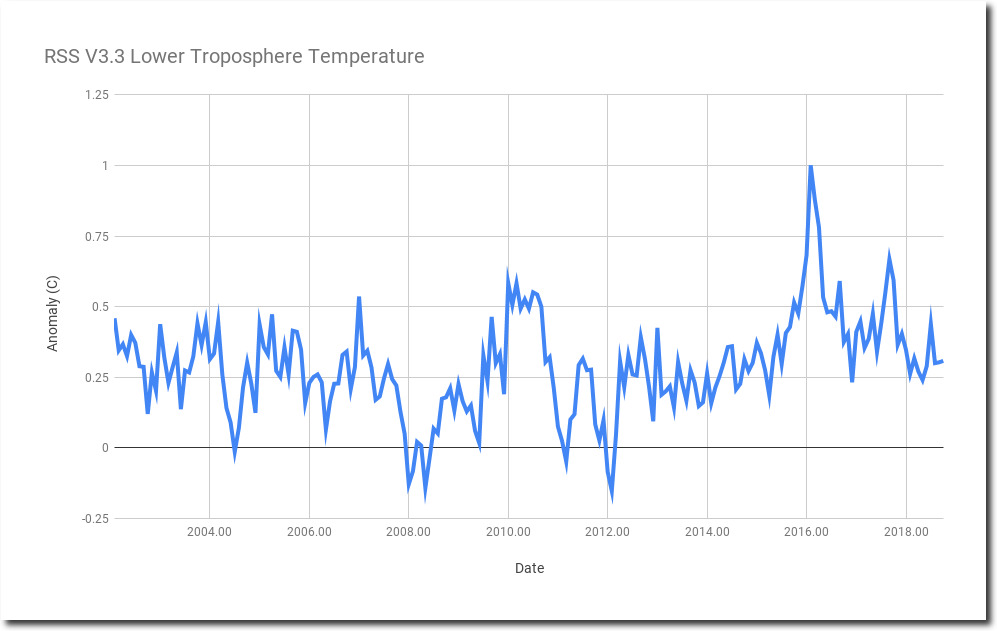
The warming was all created by tampering with the data to eliminate the error interval.
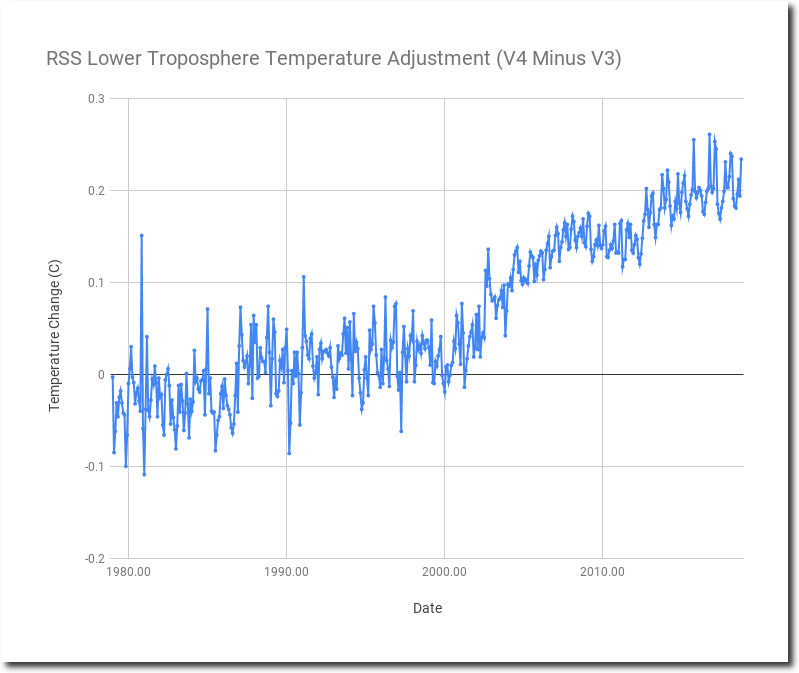
Spreadsheet

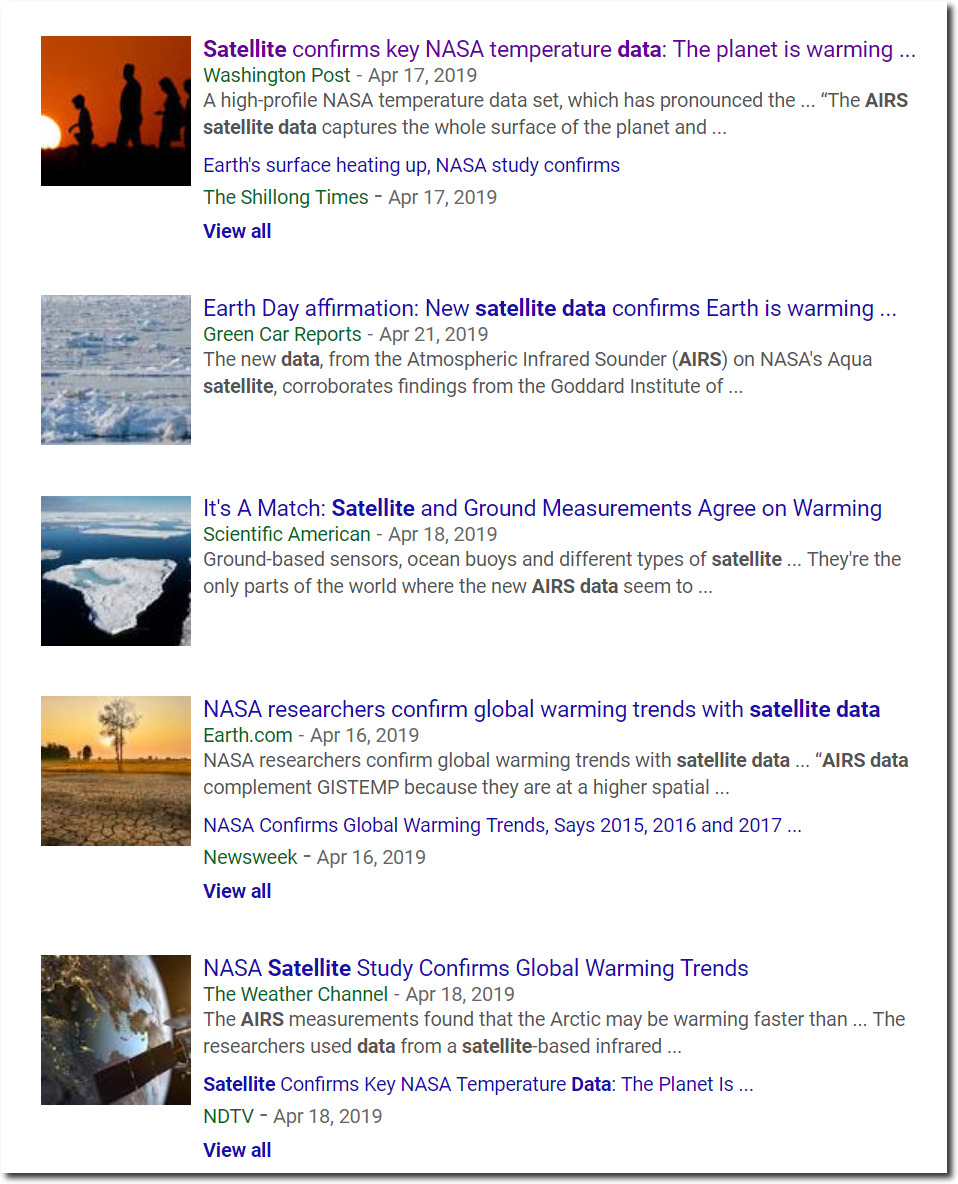
The corruption is now complete.  NASA has announced that new satellite data matches their surface temperature data. This was done to keep the President’s Commission on Climate Security from having accurate data to work with.
All government climate data goes through the same transition in support of global warming alarm. The past keeps getting cooler, and recent years keep getting warmer.
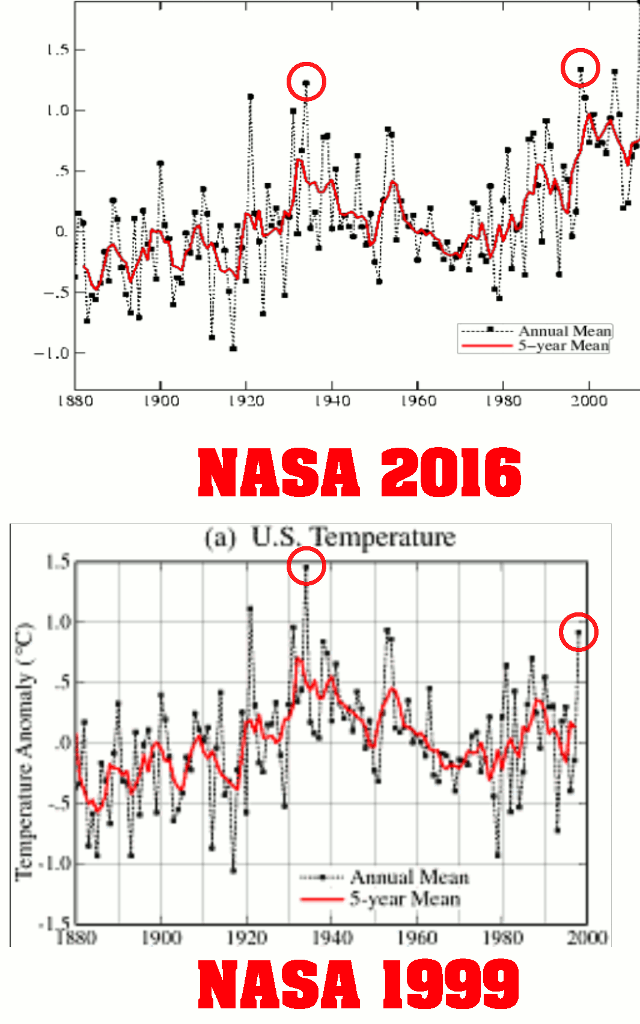
NASA 1999   NASA 2016

Government climate agencies appear to be using Orwell’s 1984 as Standard Operating Procedure.

Posted in Uncategorized | Leave a comment

Climate Change In 1909


Democrats tell us that terrorism is driven by climate change.  This month in 1909, thirty-thousand Christians were killed in Turkey. Some people did something.

16 Apr 1909, 1 – The Boston Globe at Newspapers.com

Posted in Uncategorized | Leave a comment

Dilbert Vs. Scott Adams

Steve Goddard on Twitter: “Dilbert disagrees with you, and I normally side with Dilbert.…

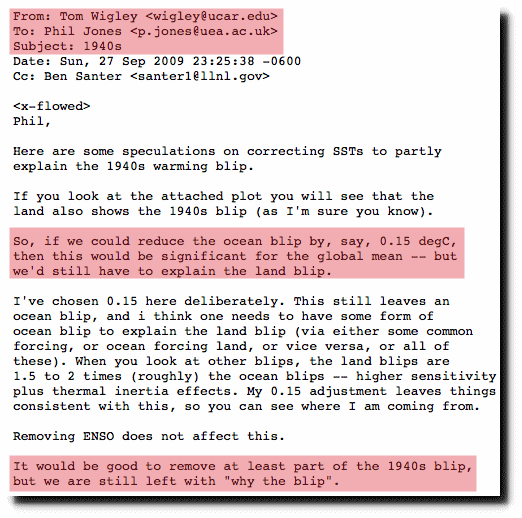
This Climategate e-mail shows unequivocally that scientists from different groups colluded to get the same result, and that result involved cooling the past – without any justification.

di2.nu/foia/1254108338.txt

I don’t always dress up for Halloween, but when I do I go as Dilbert.

Posted in Uncategorized | Leave a comment

Geology Is Now Conspiracy Theory

The party of science now believes the Carboniferous Period is oil company propaganda.

Posted in Uncategorized | Leave a comment

Buzzfeed Weighs In On Terror

Steve Goddard on Twitter: “Miriam found a way to blame a massive Islamic terror attack on white people, so she earned her pay for the day.… “

Posted in Uncategorized | Leave a comment

More Spectacular BS From The Washington Post

The Capital Weather Gang says Greenland is baking.

Greenland is baking, too. In fact, its summer melt season has already begun — more than a month ahead of schedule.

It’s been exceptionally warm in Greenland lately and ice is melting a month early – The Washington Post

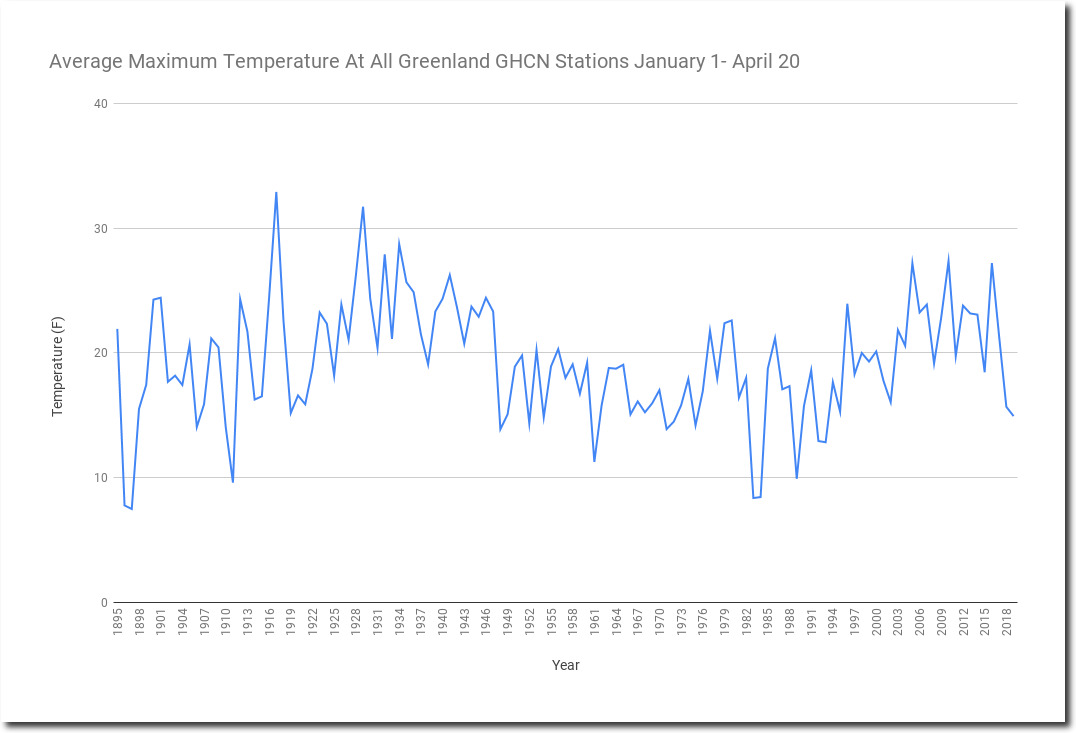
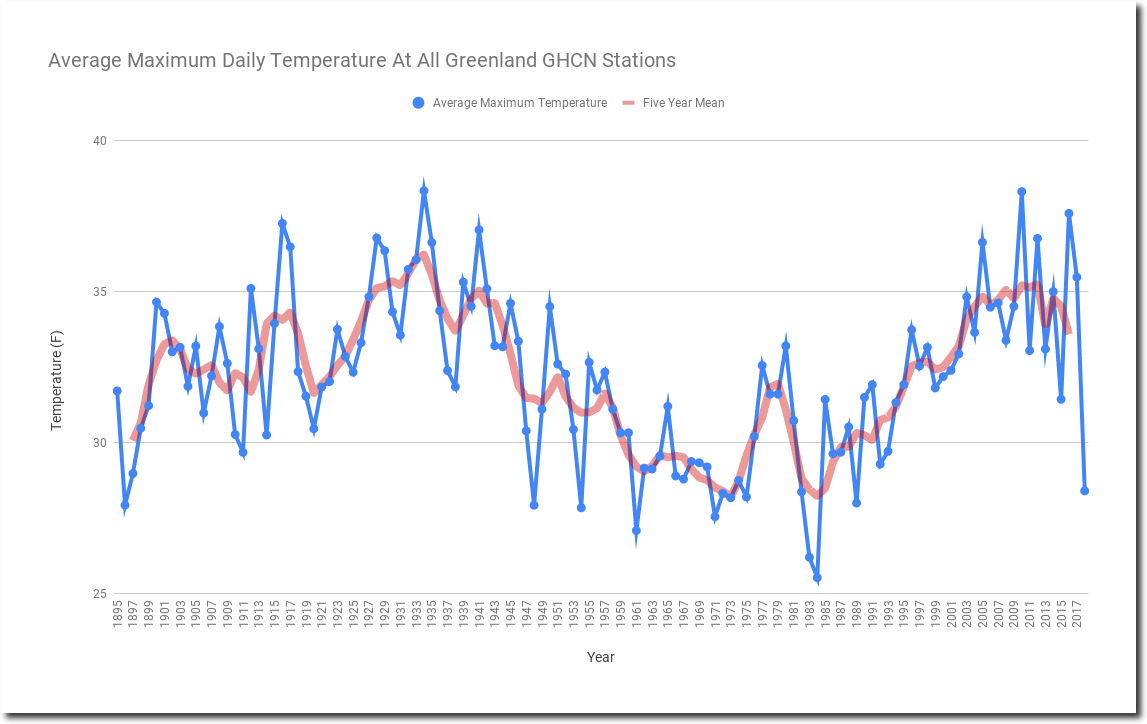
Temperatures in Greenland so far this year have been coldest since 1995, and 18th coldest since 1885..

Spreadsheet

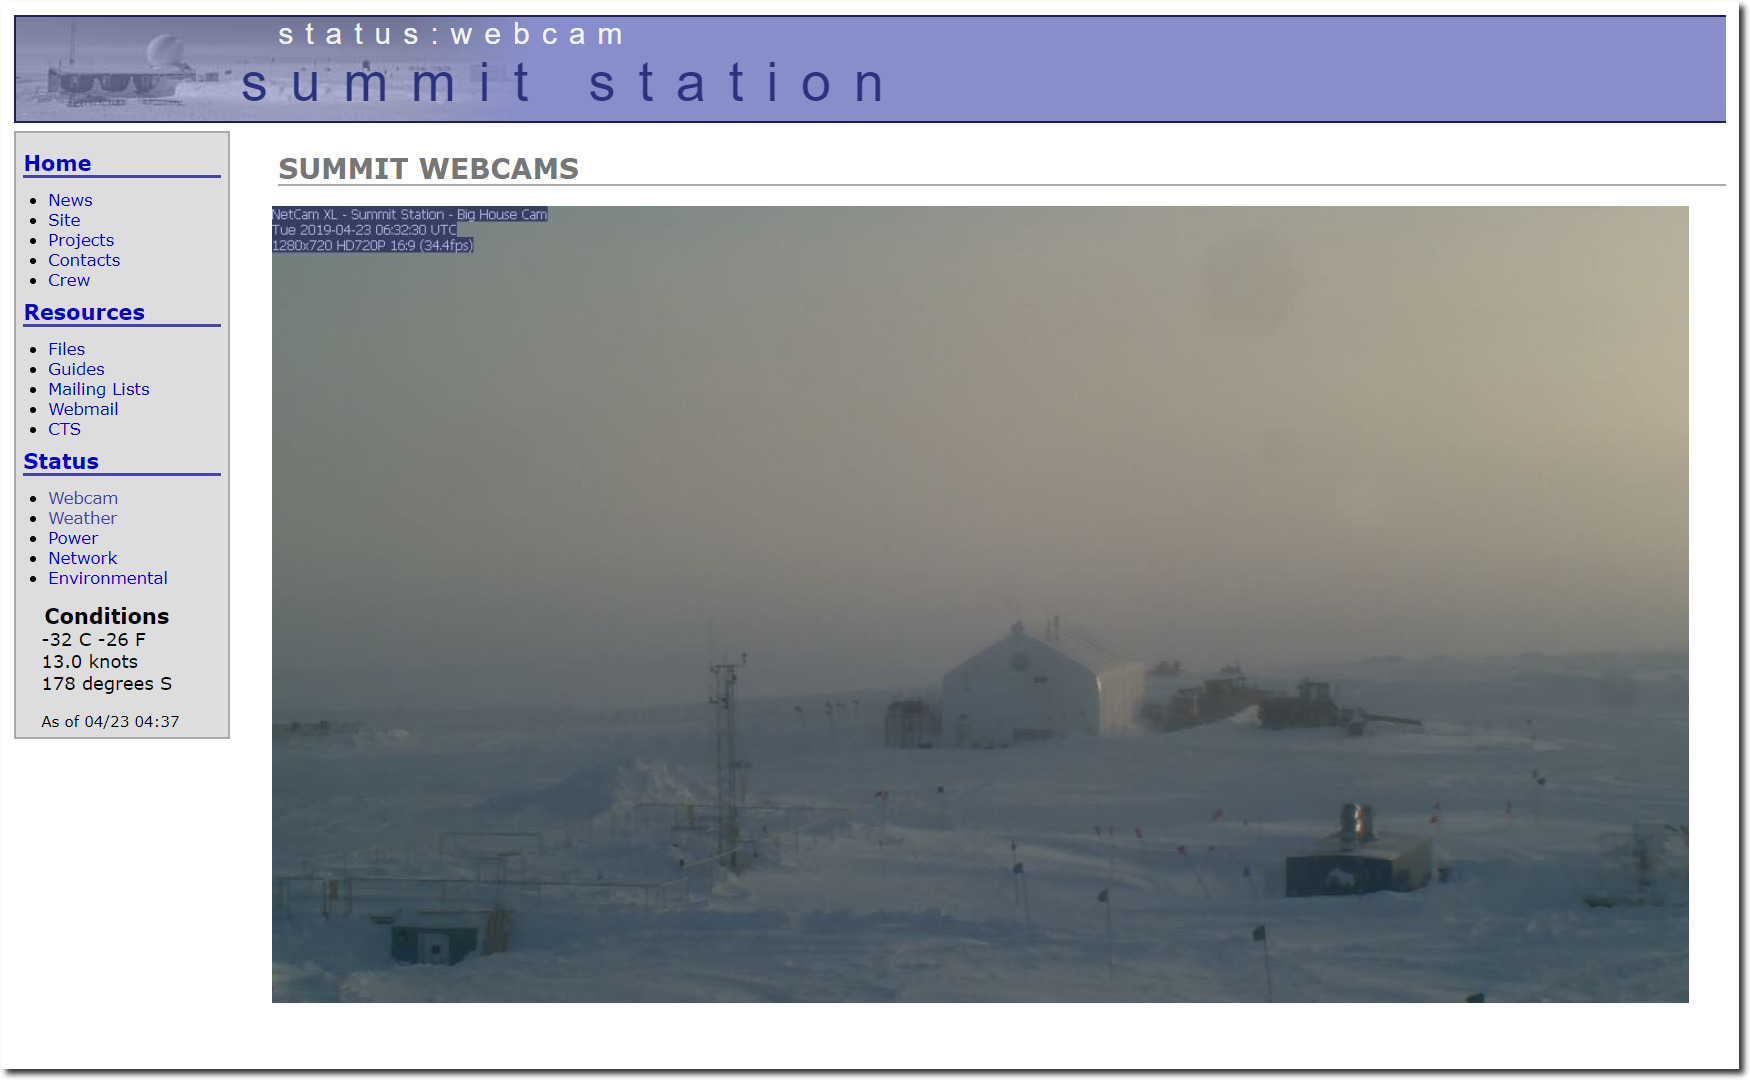
It is currently -32C in the interior of Greenland.

summit:status:webcam

It has been very cold there.

summit:status:weather

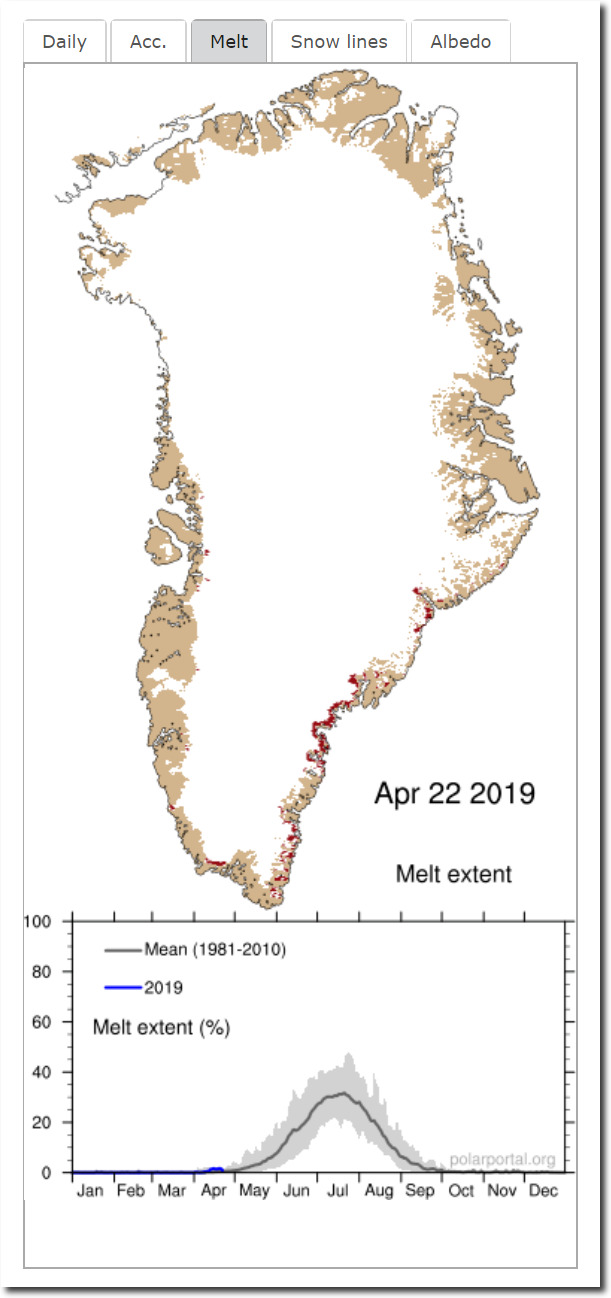
There has been close to zero melt in Greenland this year.

Surface Conditions: Polar Portal

Temperatures are dropping rapidly in Greenland, with last year being the coldest year since 1989.

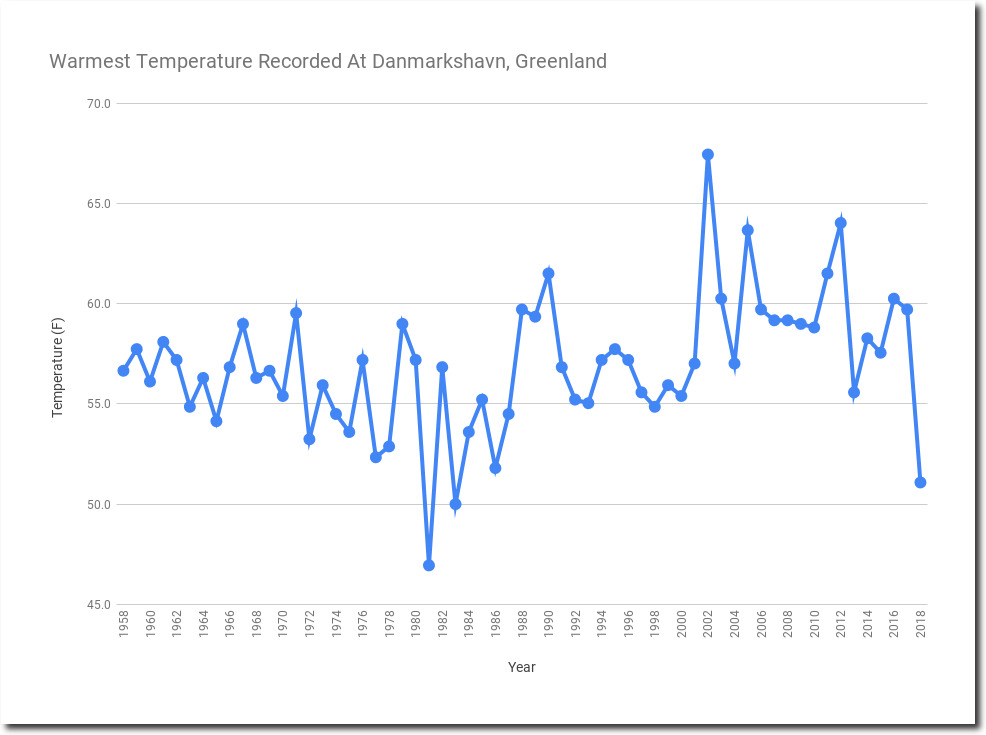
Last summer was the third coolest on record in Greenland, with only 7% of days last year above 50F.  Yet climate experts continue to claim that Greenland is melting down.

Last summer Danmarkshavn, Greenland never got above 51 degrees.  Their coolest summer since 1983, when skies were obscured by dust from the eruption of El Chichon.

Greenland has gained near record amounts of ice over the last two years.

2017   2018

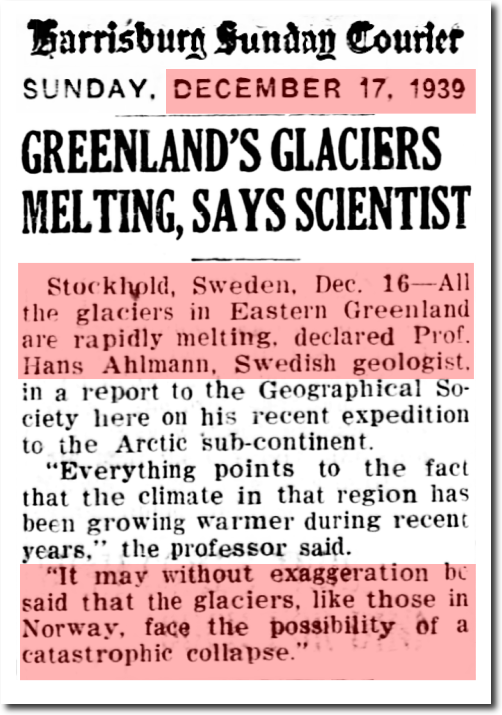
But eighty years ago, Greenland’s glaciers were rapidly melting and facing “catastrophic collapse.”

17 Dec 1939, Page 15 – Harrisburg Sunday Courier at Newspapers.com

The Capital Weather Gang doesn’t seem to do a lot of fact checking. They apparently parrot any alarmist BS they get told by academics.

Posted in Uncategorized | Leave a comment