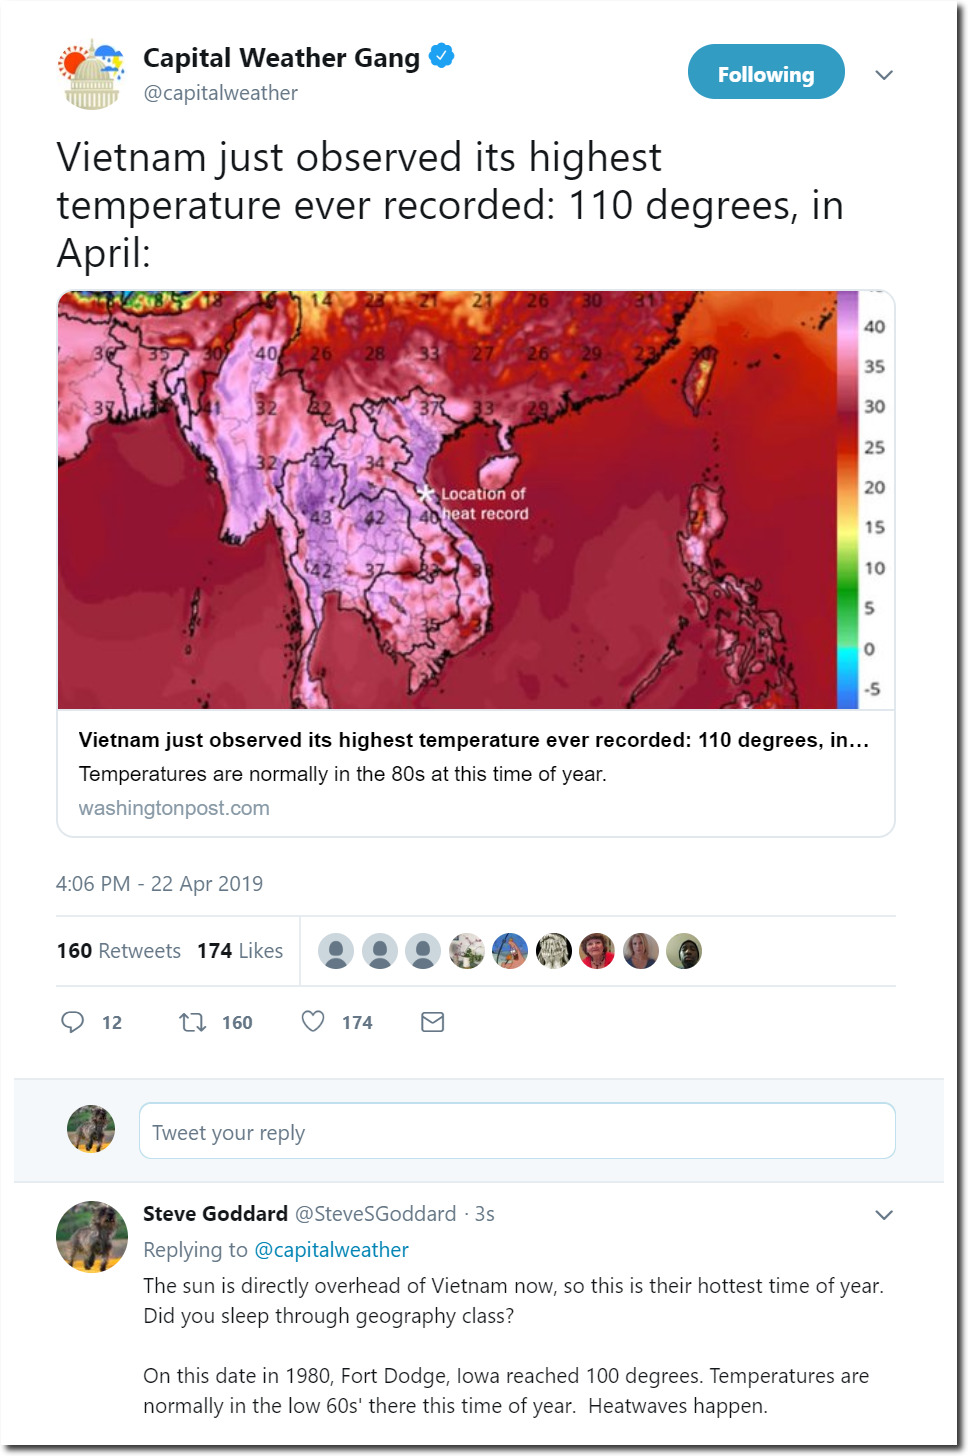
Capital Weather Gang Weighs In …

The Capital Weather Gang is shocked that April is hot in Vietnam (at latitude 10N.)

Did you sleep through geography class? 

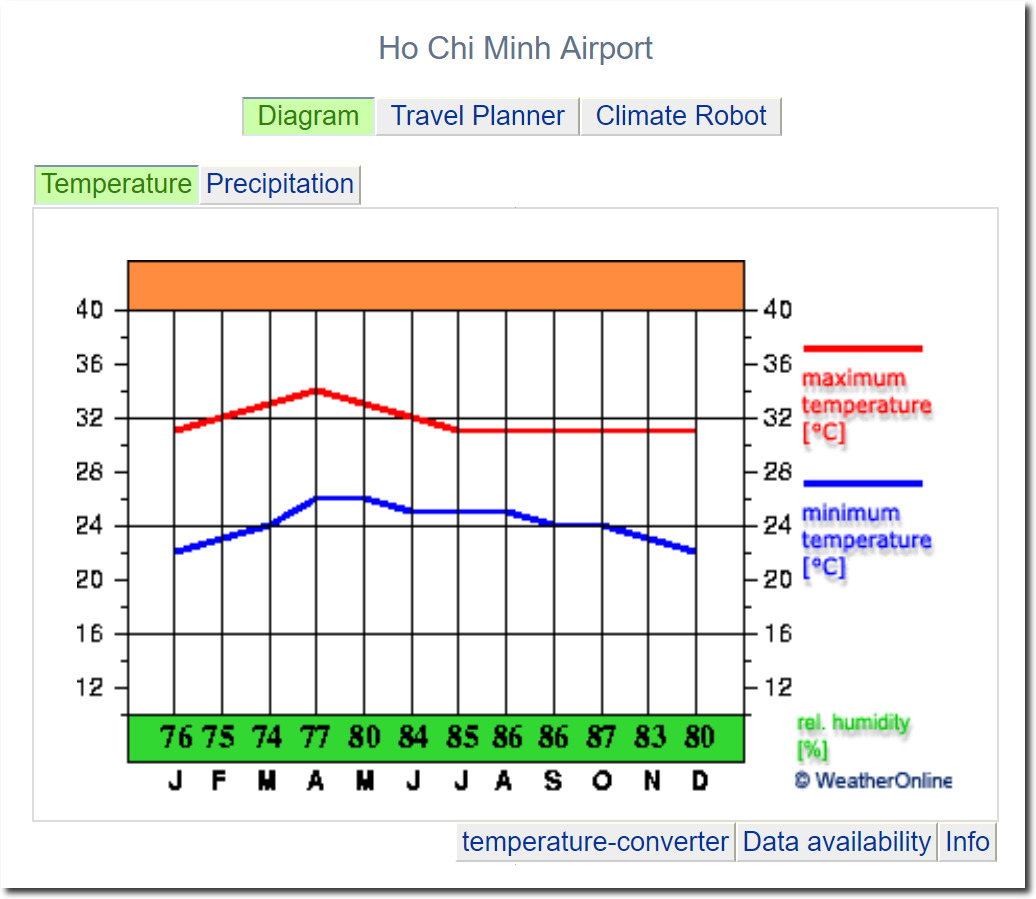
Peak temperatures occur in April in Vietnam.

climate – Graph – Ho Chi Minh Vietnam – WeatherOnline

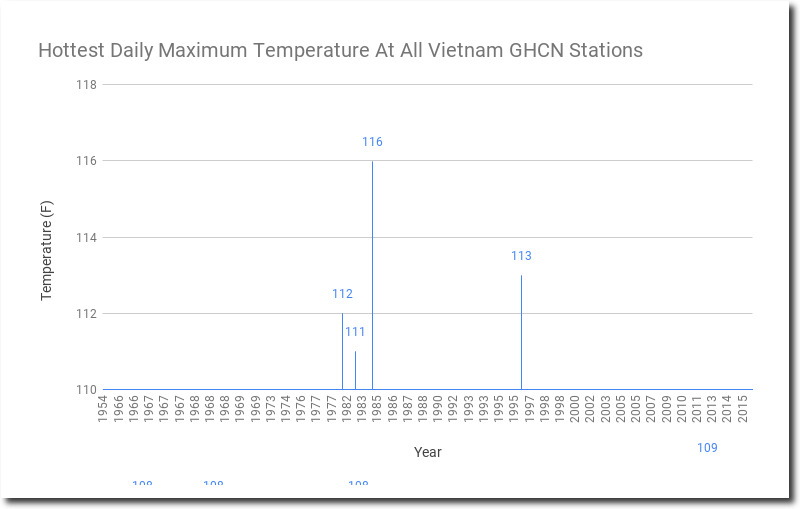
Vietnam was over 110 degrees in 1982, 1983, 1984 and 1996.  Their hottest temperature was 116 degrees on June 22, 1984.  On April 25, 1983, Vietnam reached 111 degrees.

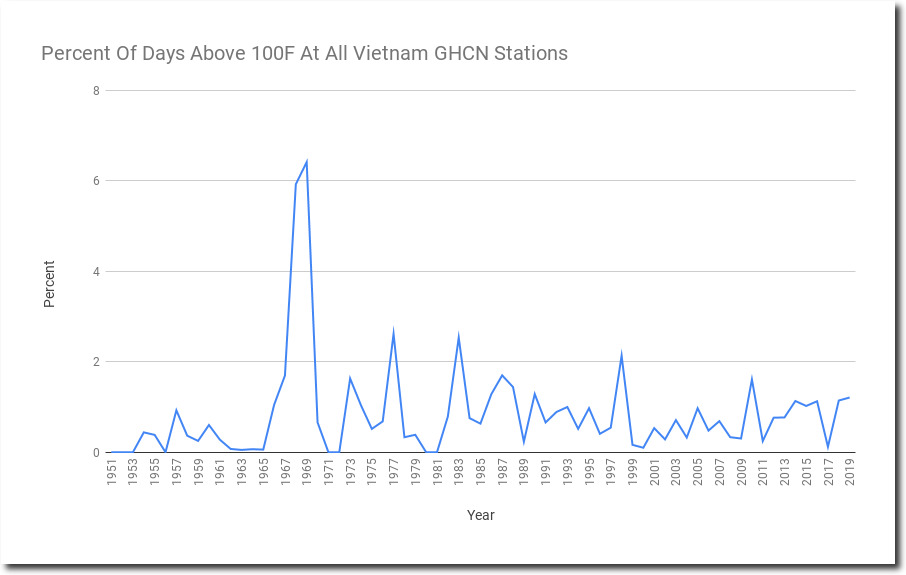
The frequency of 100 degree days peaked fifty years ago in Vietnam, in 1968 and 1969 – during the Vietnam War.

Spreadsheet

Capital Weather Gang got everything wrong in this article.  Will they retract?

Posted in Uncategorized | Leave a comment

Celebrating 150 Years Of Imaginary Climate Change

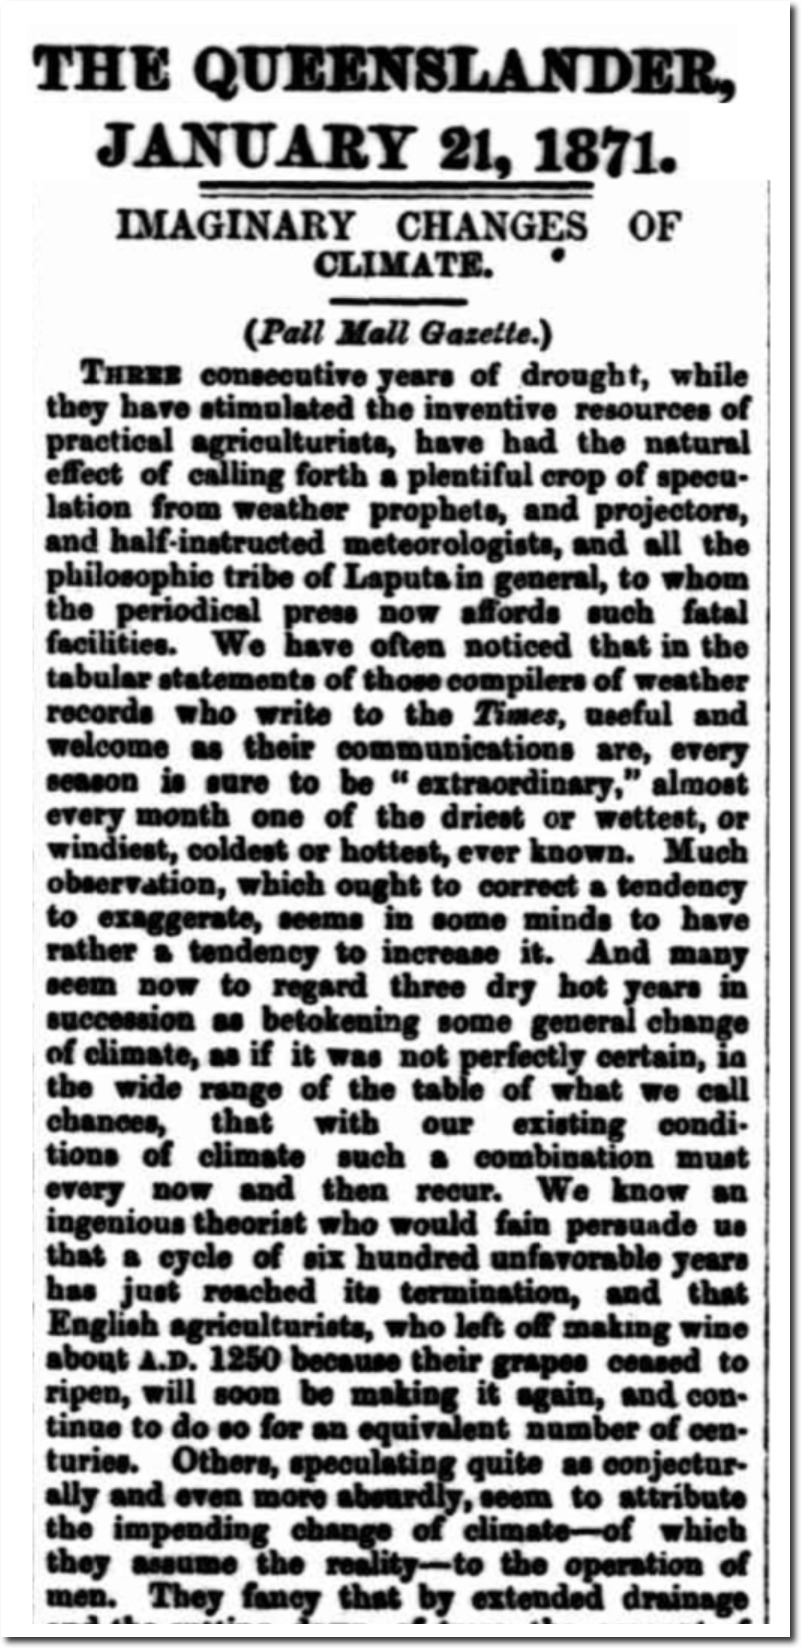
Nothing ever changes with mankind’s superstitions about climate.

IMAGINARY CHANGES OF CLIMATE.

a plentiful crop speculation from weather prophets, and projectors, and half-instructed meteorologists, and all the philosophic tribe of Laputa In general, to whom the periodical press now affords such fatal facilities. We

every season is sure to be ” extraordinary,” almost every month one of the driest or wettest, or windiest, coldest or hottest, ever known. Much observation, which ought to correct a tendency to exaggerate, seems in some minds to have rather a tendency to increase it.

Others, speculating quite as conjecturally and even more absurdly, seem to attribute the impending change of climate—of which they assume the reality—to the operation of men

– January 21, 1871

21 Jan 1871 – IMAGINARY CHANGES OF CLIMATE. – Trove

Posted in Uncategorized | Leave a comment

Understanding NOAA US Temperature Fraud

This is graph of US maximum temperatures published on their website. It shows a hockey stick of warming after 1976.
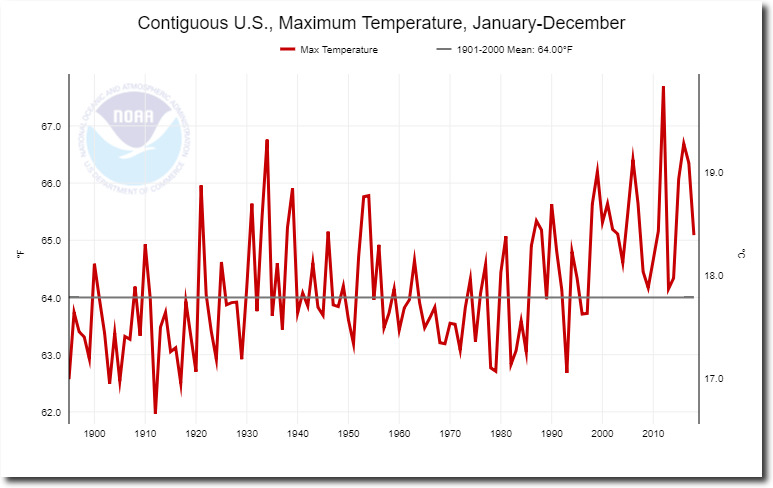
Climate at a Glance | National Centers for Environmental Information (NCEI)

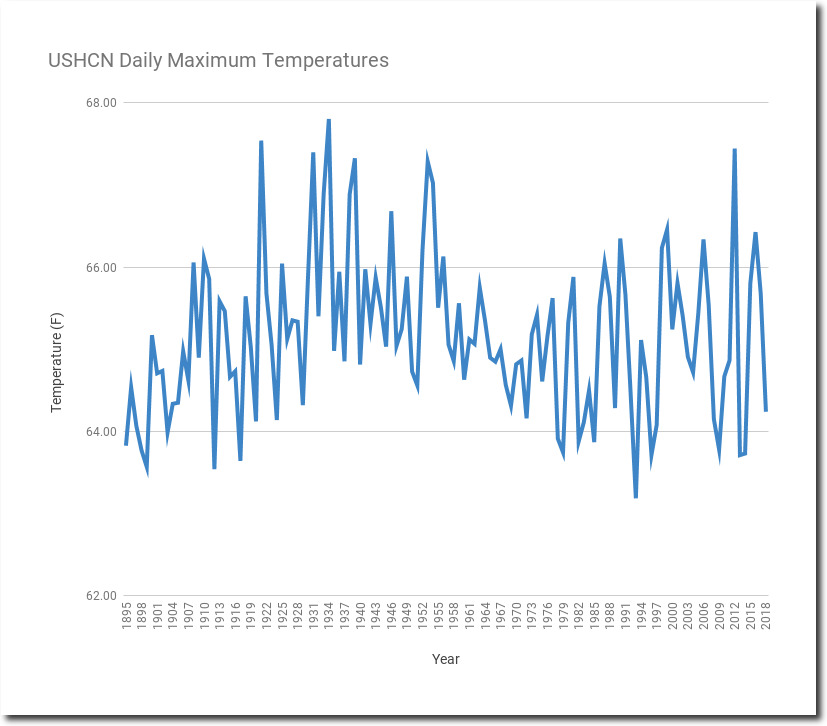
The actual measured thermometer data does not have the post-1976 hockey stick. There has been very little warming since 1976, perhaps one degree F.
 

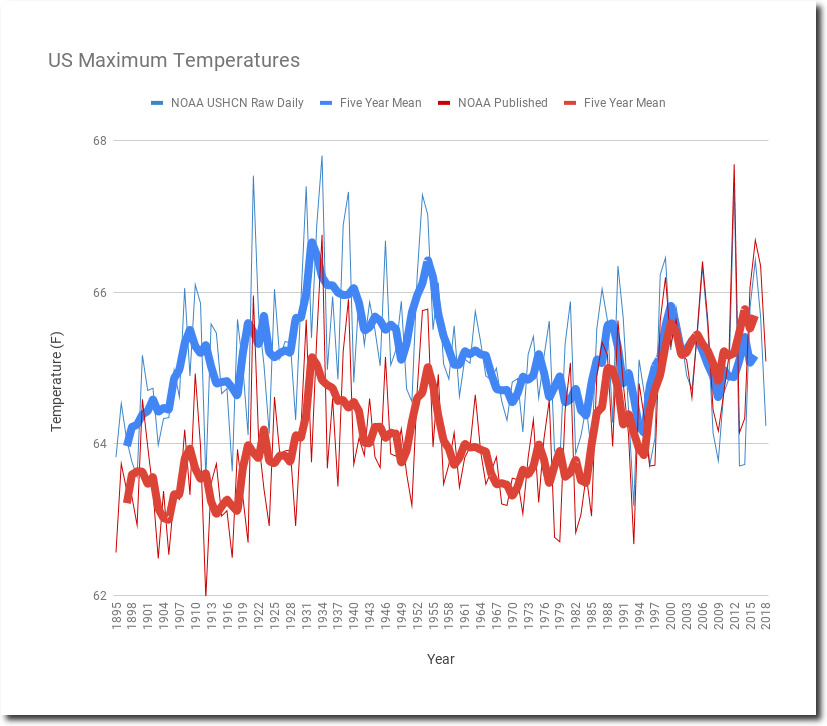
The next graph compares the measured temperatures (blue) vs. the reported (red.) The measured temperatures show long term cooling, but the reported temperatures show warming.
This graph shows the difference between reported and measured temperatures. The post-1976 hockey stick becomes very apparent.
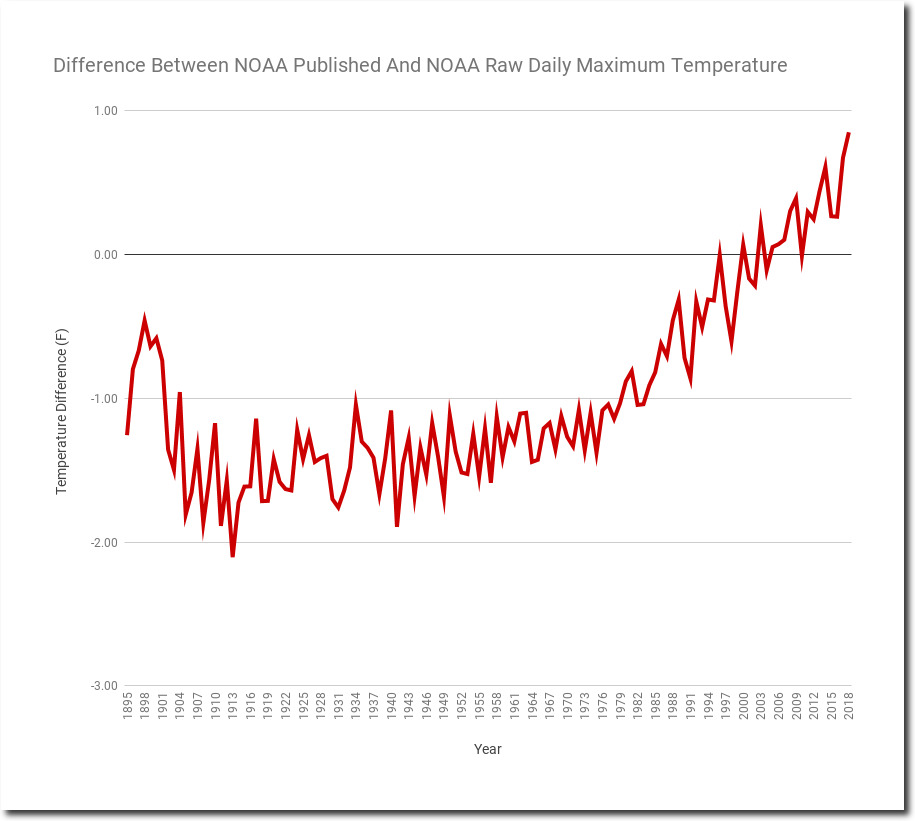
So how is NOAA tampering with the data to create this hockey stick?

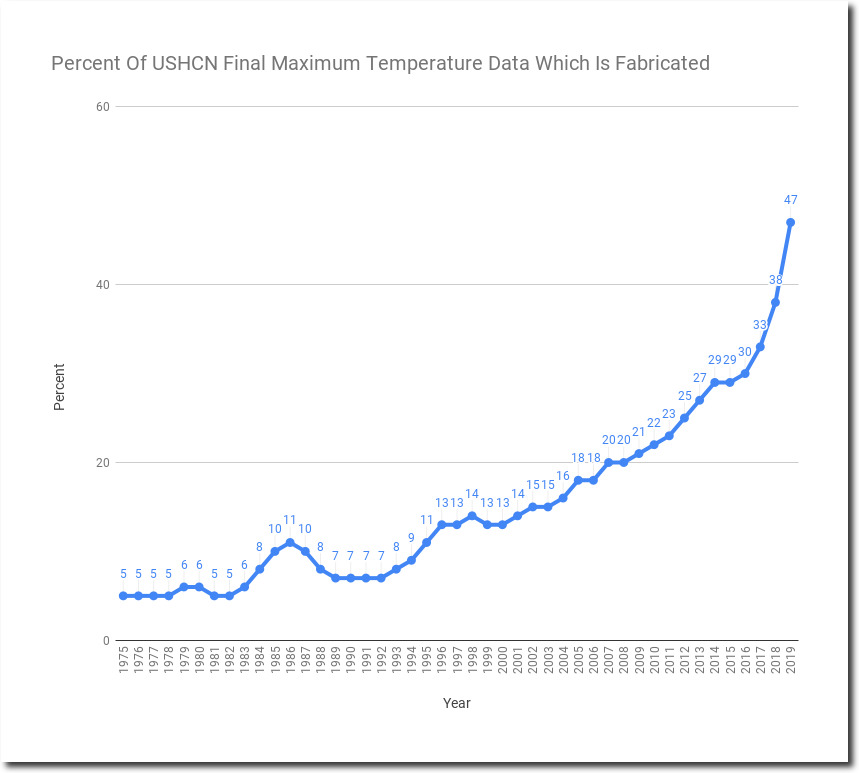
Alarmists claim that it is due to Time of Observation Bias or changing station composition, but that isn’t what is going on. NOAA is simply making the data up.  Every month, a certain percentage of stations does not report, and are marked with an E (estimated.) The percentage of estimated (i.e. fake) data has skyrocketed from around 5% to almost 50% since 1976.
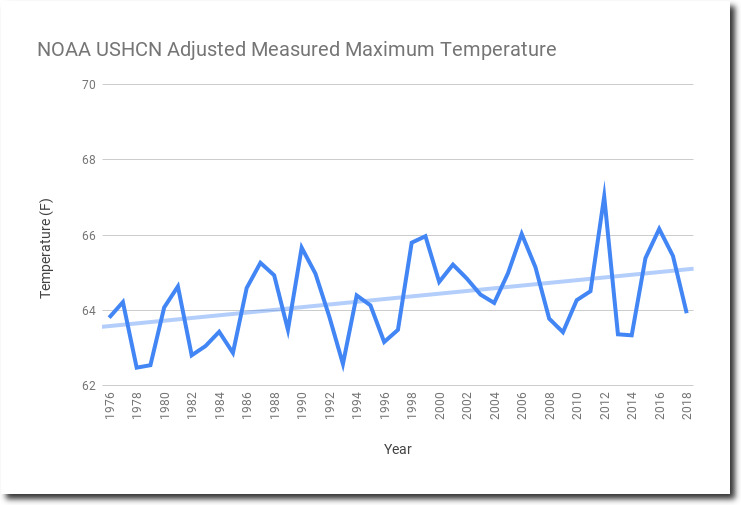
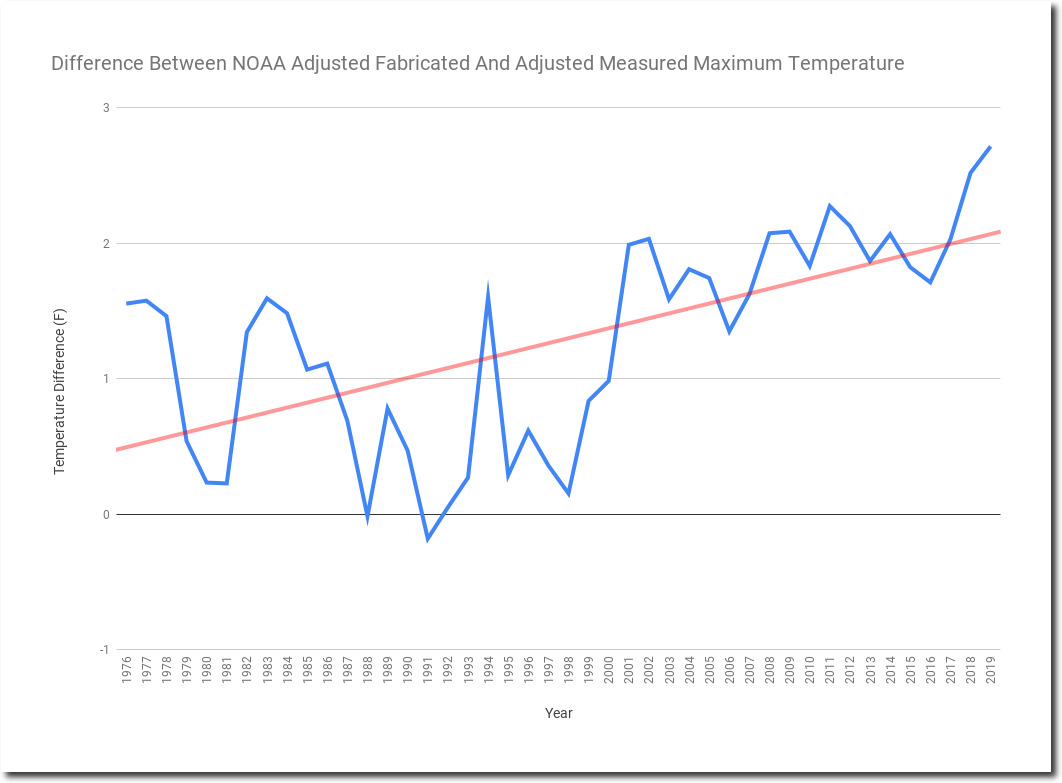
And here is the smoking gun.  Comparing the fake adjusted temperatures to the measured adjusted temperatures.  The measured adjusted temperatures show about one degree warming since 1976, but the fake temperatures show about three degrees warming. And almost half of the data is fake now.
The post-1976 hockey stick is created by manufacturing data, not adjusting data as alarmists claim.
Spreadsheet

Manipulating the US temperature data is very important to global warming scamsters, because the US has the vast majority of high quality long term data.  Much of the rest of the world has been very busy dealing with genocide and world wars for the past century. Maintaining temperature data was a low priority for people trying to keep from being killed by their government.
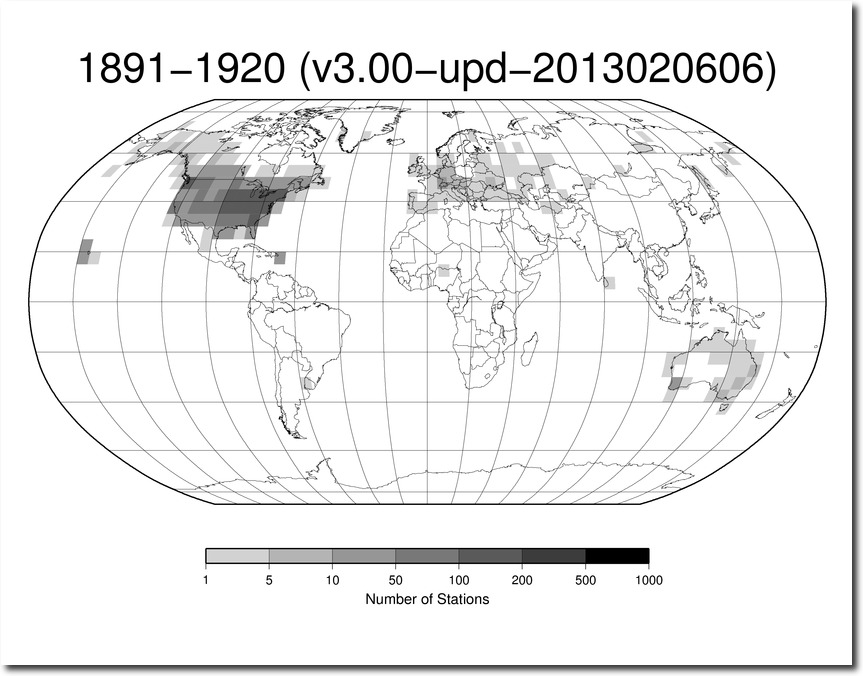
ftp://ftp.ncdc.noaa.gov/pub/data/ghcn/daily/figures/station-counts-1891-1920-temp.png

And then there is UHI.  Thirty years ago, Tom Karl and Phil Jones said that UHI was responsible for the entire warming trend  in the US.
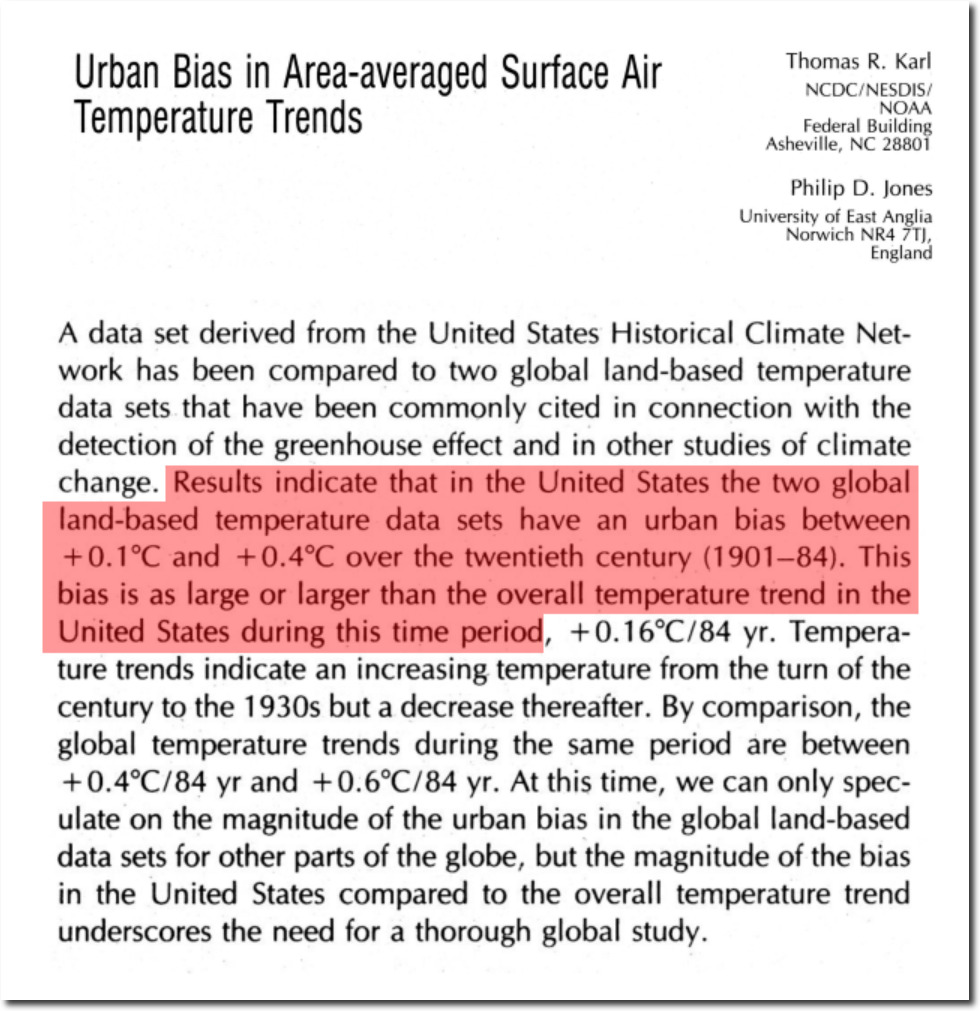
1520-0477(1989)070<0265:UBIAAS>2.0.CO;2

Posted in Uncategorized | Leave a comment

China Set To Destroy The Planet

The world ends in 12 years, and China plans to build hundreds of new coal fired power plants.

China’s power industry calls for hundreds of new coal power plants by 2030 – Unearthed

But not to worry.  Bernie is going to punish American companies for selling him the fuels he needs to survive.

Posted in Uncategorized | Leave a comment

Rewriting The Past At The NOAA Ministry Of Truth

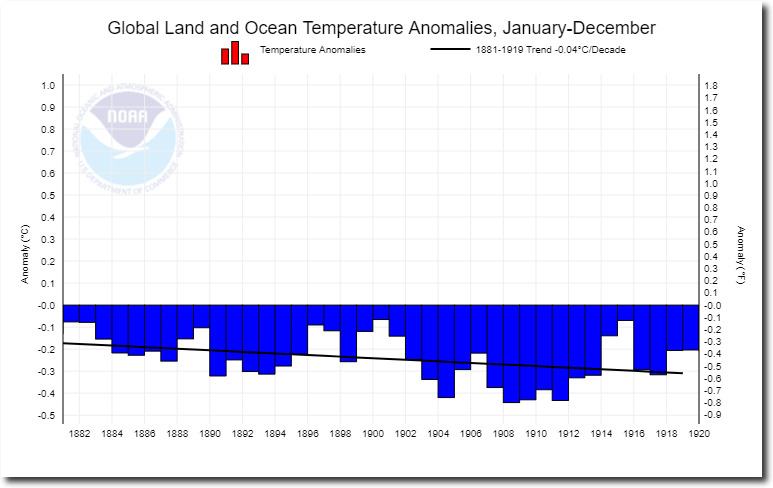
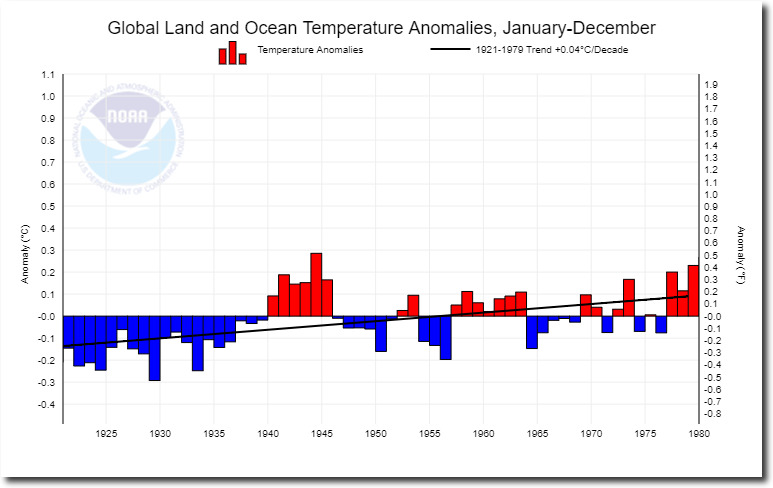
Thirty years ago, NOAA said most global warming occurred between 1881 and 1919 – and that Earth cooled from 1921 to 1979.

Analysis of warming since 1881 shows most of the increase in global temperature happened before 1919 – before the more re-cent sharp rise in the amount of carbon dioxide in the atmosphere. said Thomas Karl, of the National Oceanic and Atmospheric Adminis-tration’s National Climatic Data Center in Asheville, N.C. While global climate warmed overall since 1881, it actually cooled from 1921 to 1979. Karl said.

7 Dec 1989, Page 14 – at Newspapers.com

Now NOAA shows the exact opposite.  They show earth cooling from 1881 to 1919, and warming from 1921 to 1979.

Climate at a Glance | National Centers for Environmental Information (NCEI)

Climate at a Glance | National Centers for Environmental Information (NCEI)

Perhaps NOAA scientists travelled back in time and took new readings.

Posted in Uncategorized | Leave a comment

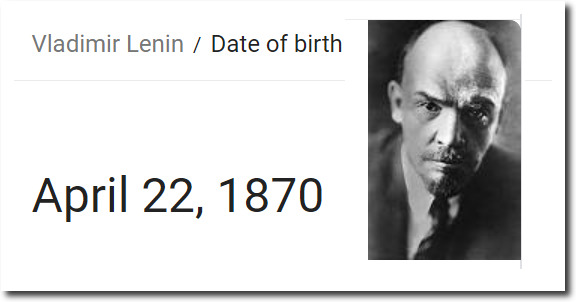
Earth Day

Lenin created an environmental  paradise on Earth in the Soviet Union.

Posted in Uncategorized | Leave a comment

Climate Alarmists Adjusting IQ’s Downwards

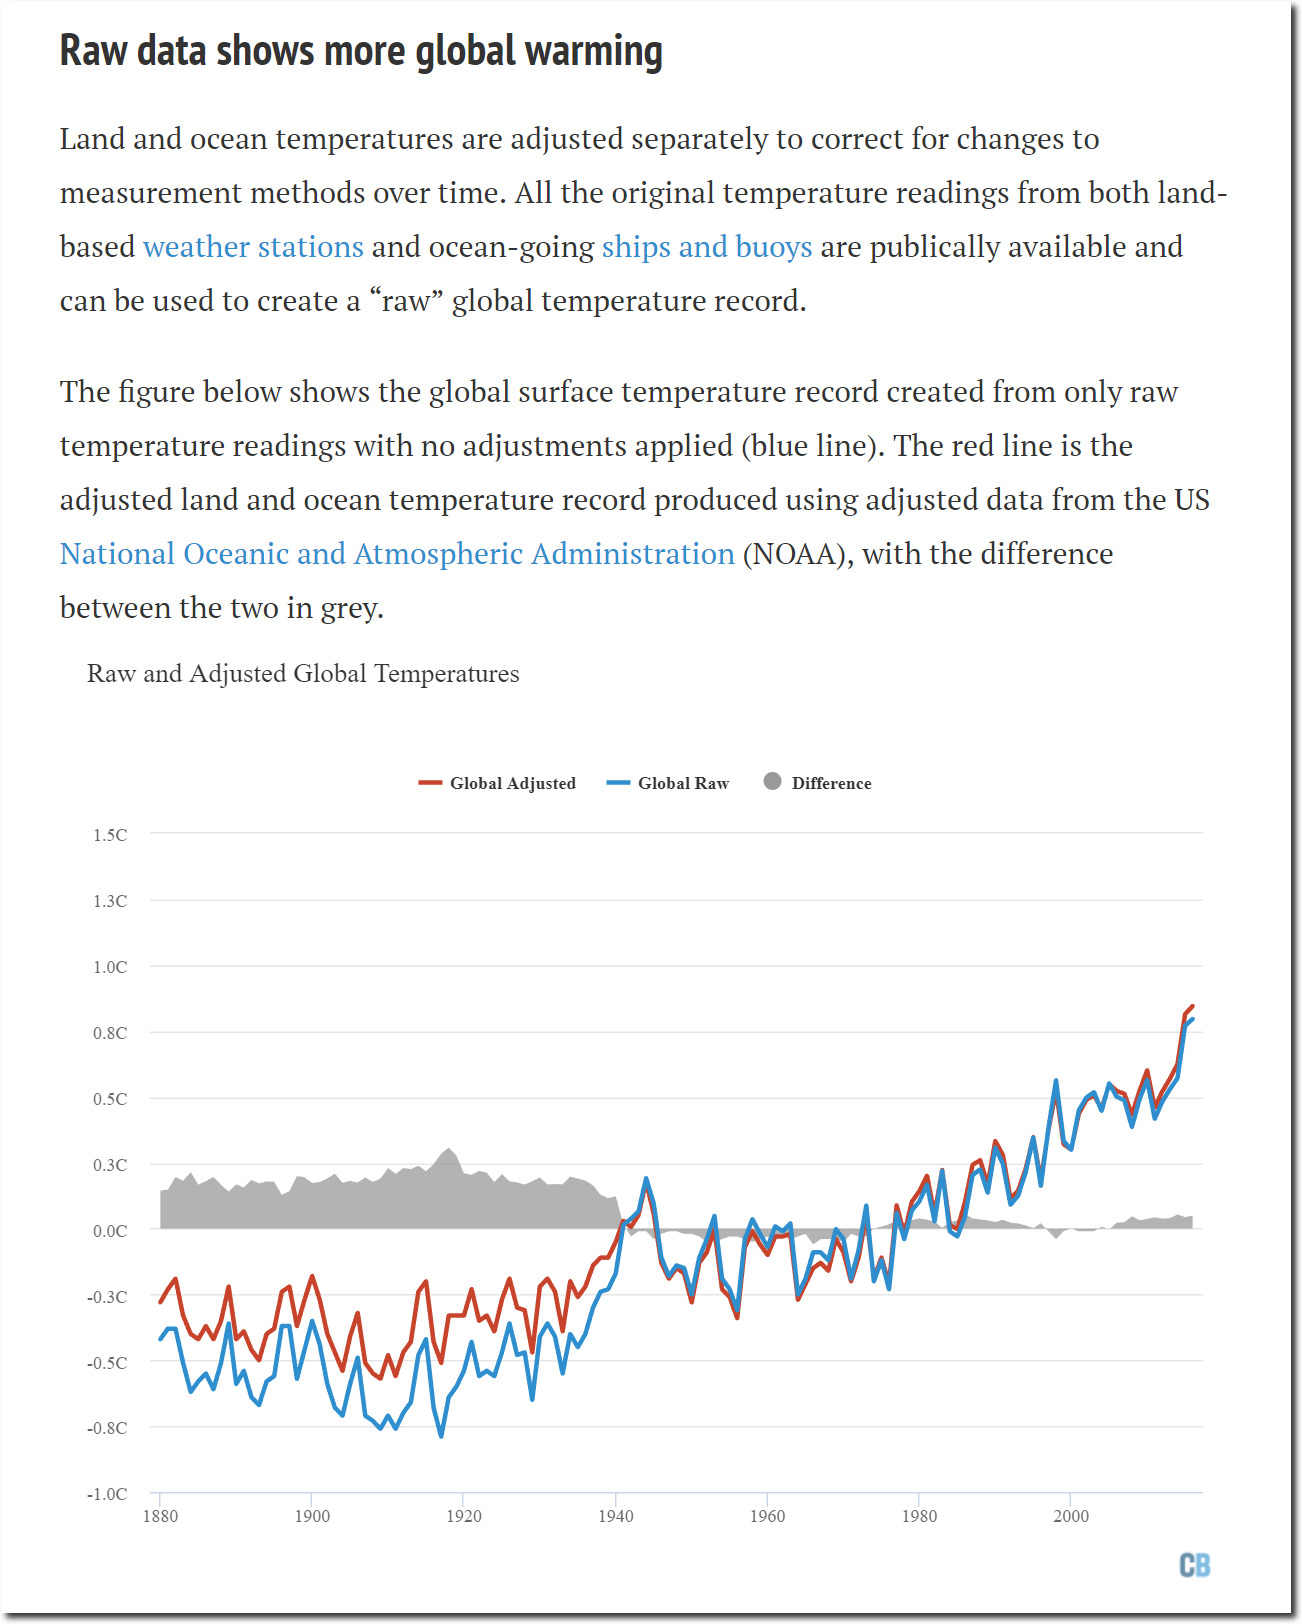
A favorite claim of climate alarmists is that they adjust older temperatures upwards.

Explainer: How data adjustments affect global temperature records | Carbon Brief

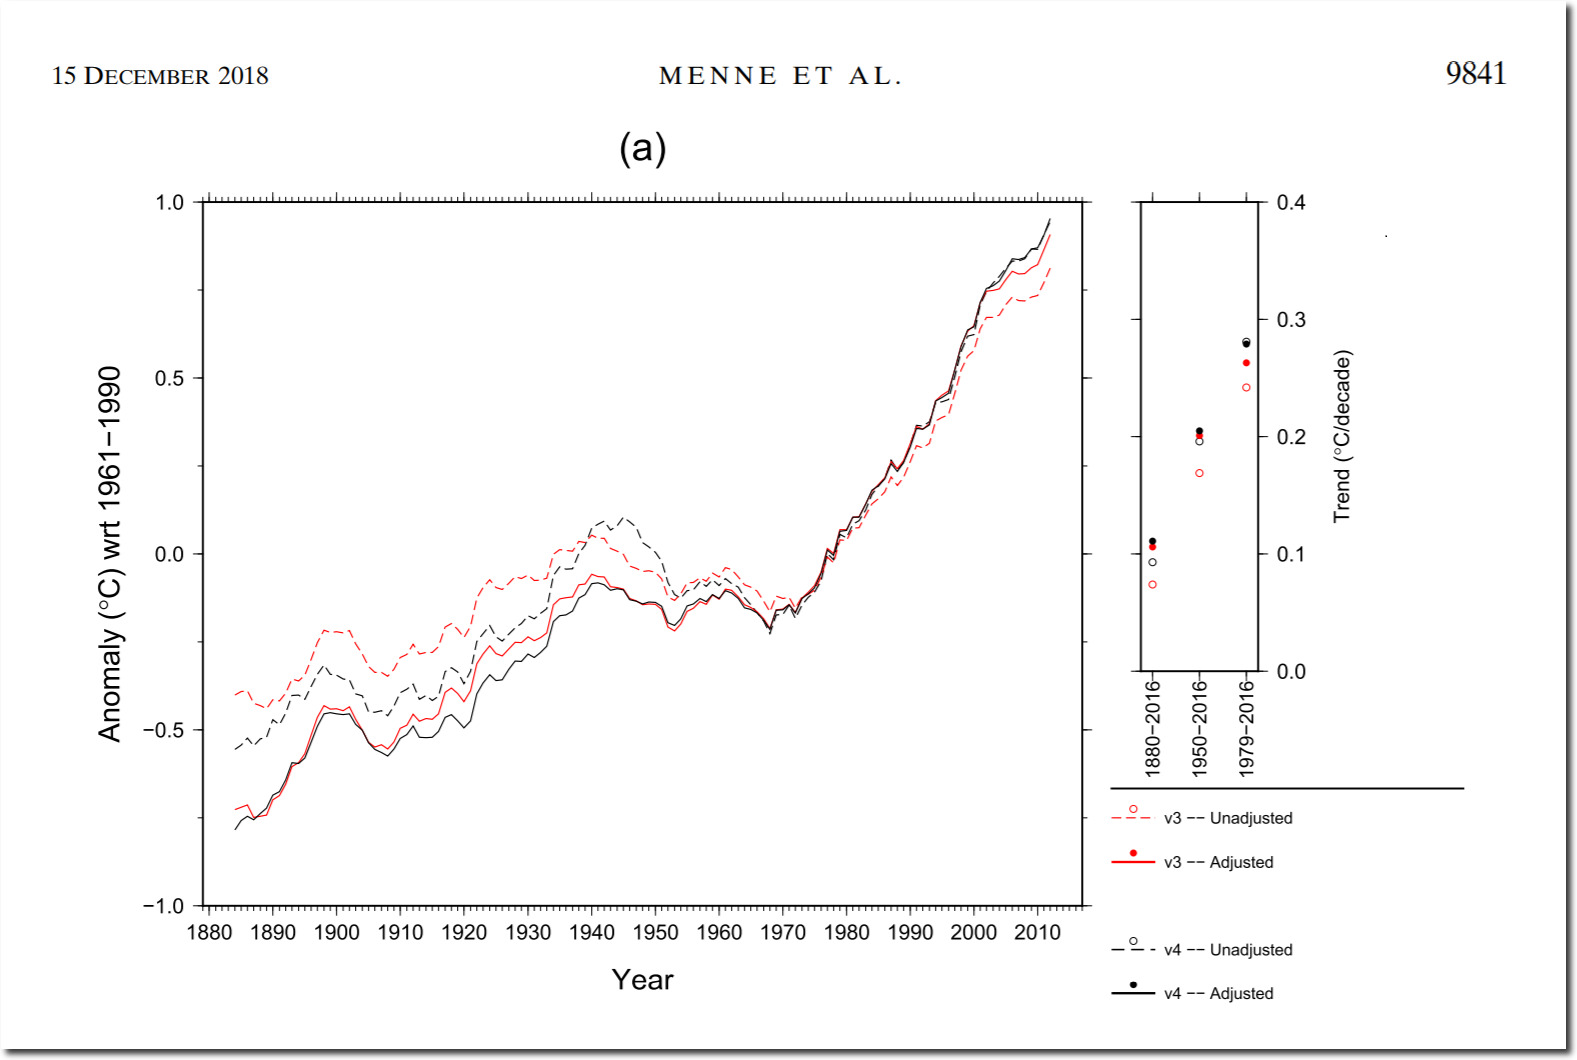
This certainly isn’t true for global land temperatures.

JCLI-D-18-0094.1

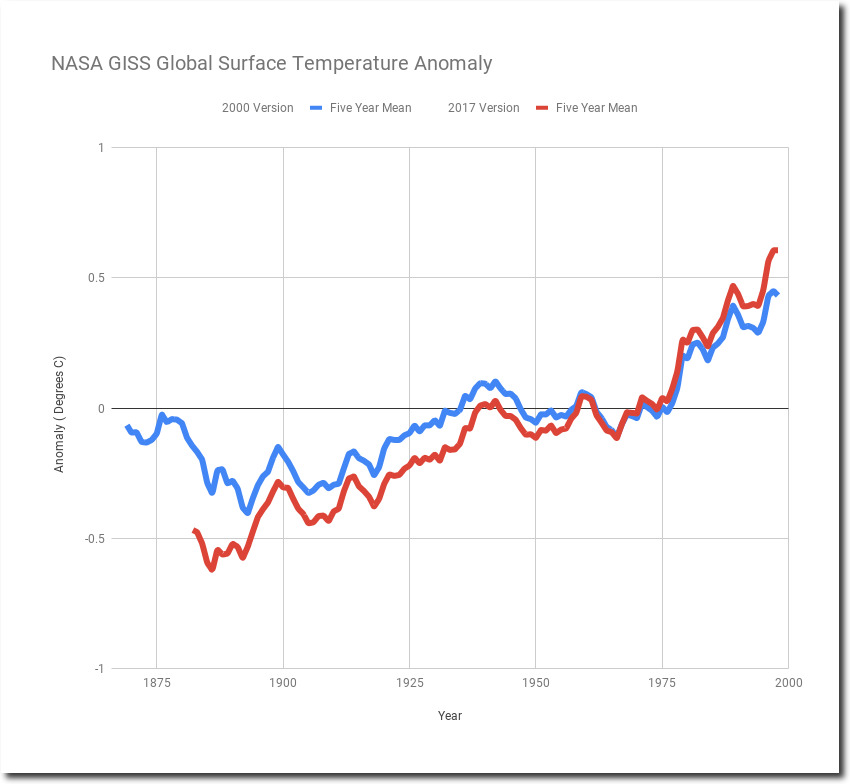
Newer versions of land temperatures keep getting adjusted further to cool the past.

Spreadsheet     Data

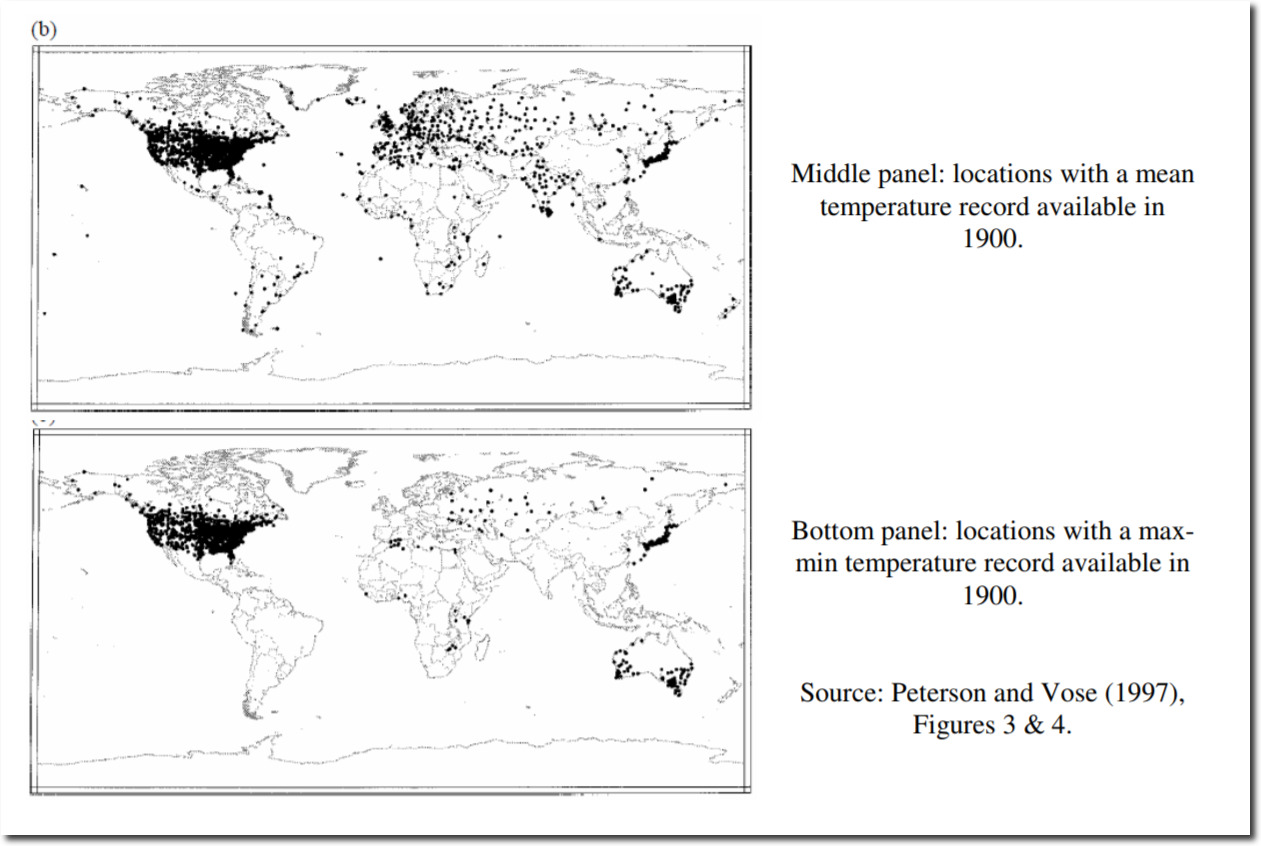
There is little high quality temperature data outside the US.

A Critical Review of Global Surface Temperature Data Products by Ross McKitrick :: SSRN

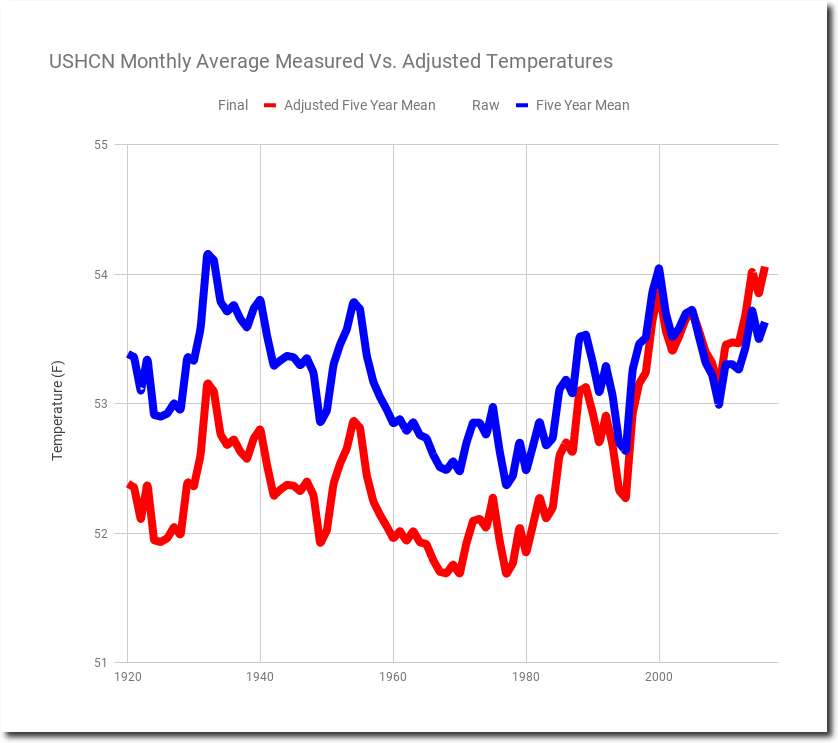
The US data is massively adjusted to increase warming.

Spreadsheet         Data

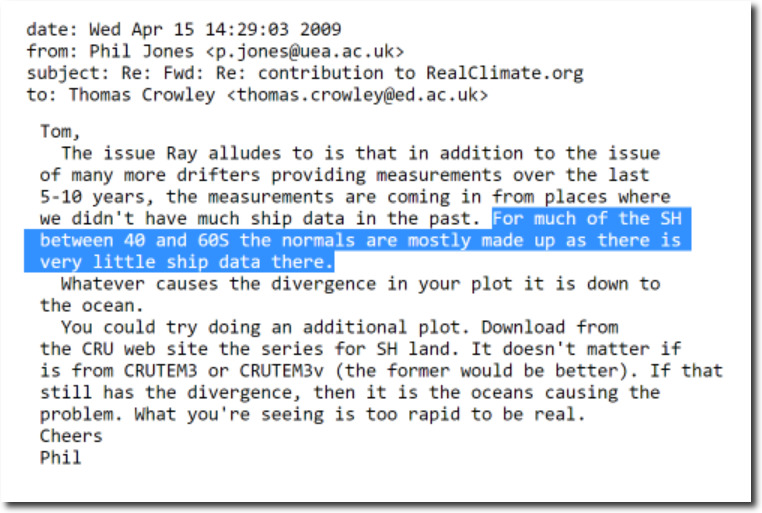
And the ocean data (like the land data) is largely fake.

di2.nu/foia/foia2011/mail/2729.txt

Climate science is a farce. Junk science built on top of junk data.

Posted in Uncategorized | Leave a comment

Some People Did Something

Democrats see climate change and rising sea level as our greatest threat on Easter Sunday.

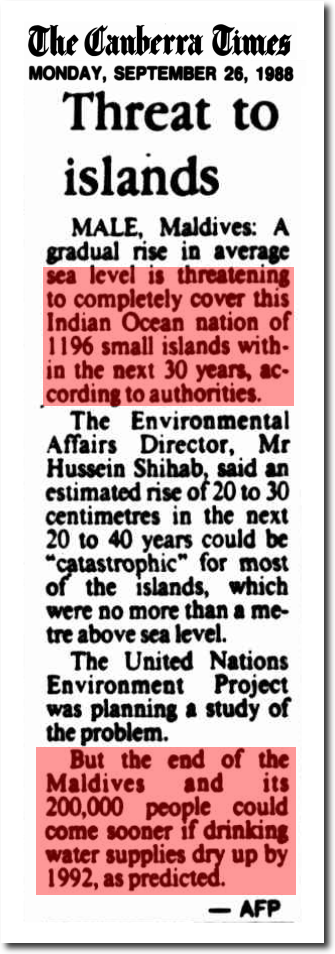
They believe that the Maldives drowned last year.

26 Sep 1988 – Threat to islands

Progressives understand what is really important.

Top priority is of course silencing “old male climate deniers.”

President Obama said the media “absolutely” overstates the threat of terrorism in comparison to the threat of climate change.

Climate Change a Greater Threat Than Terrorism, White House Says – ABC News

Posted in Uncategorized | Leave a comment

Plummeting Heat In Minnesota

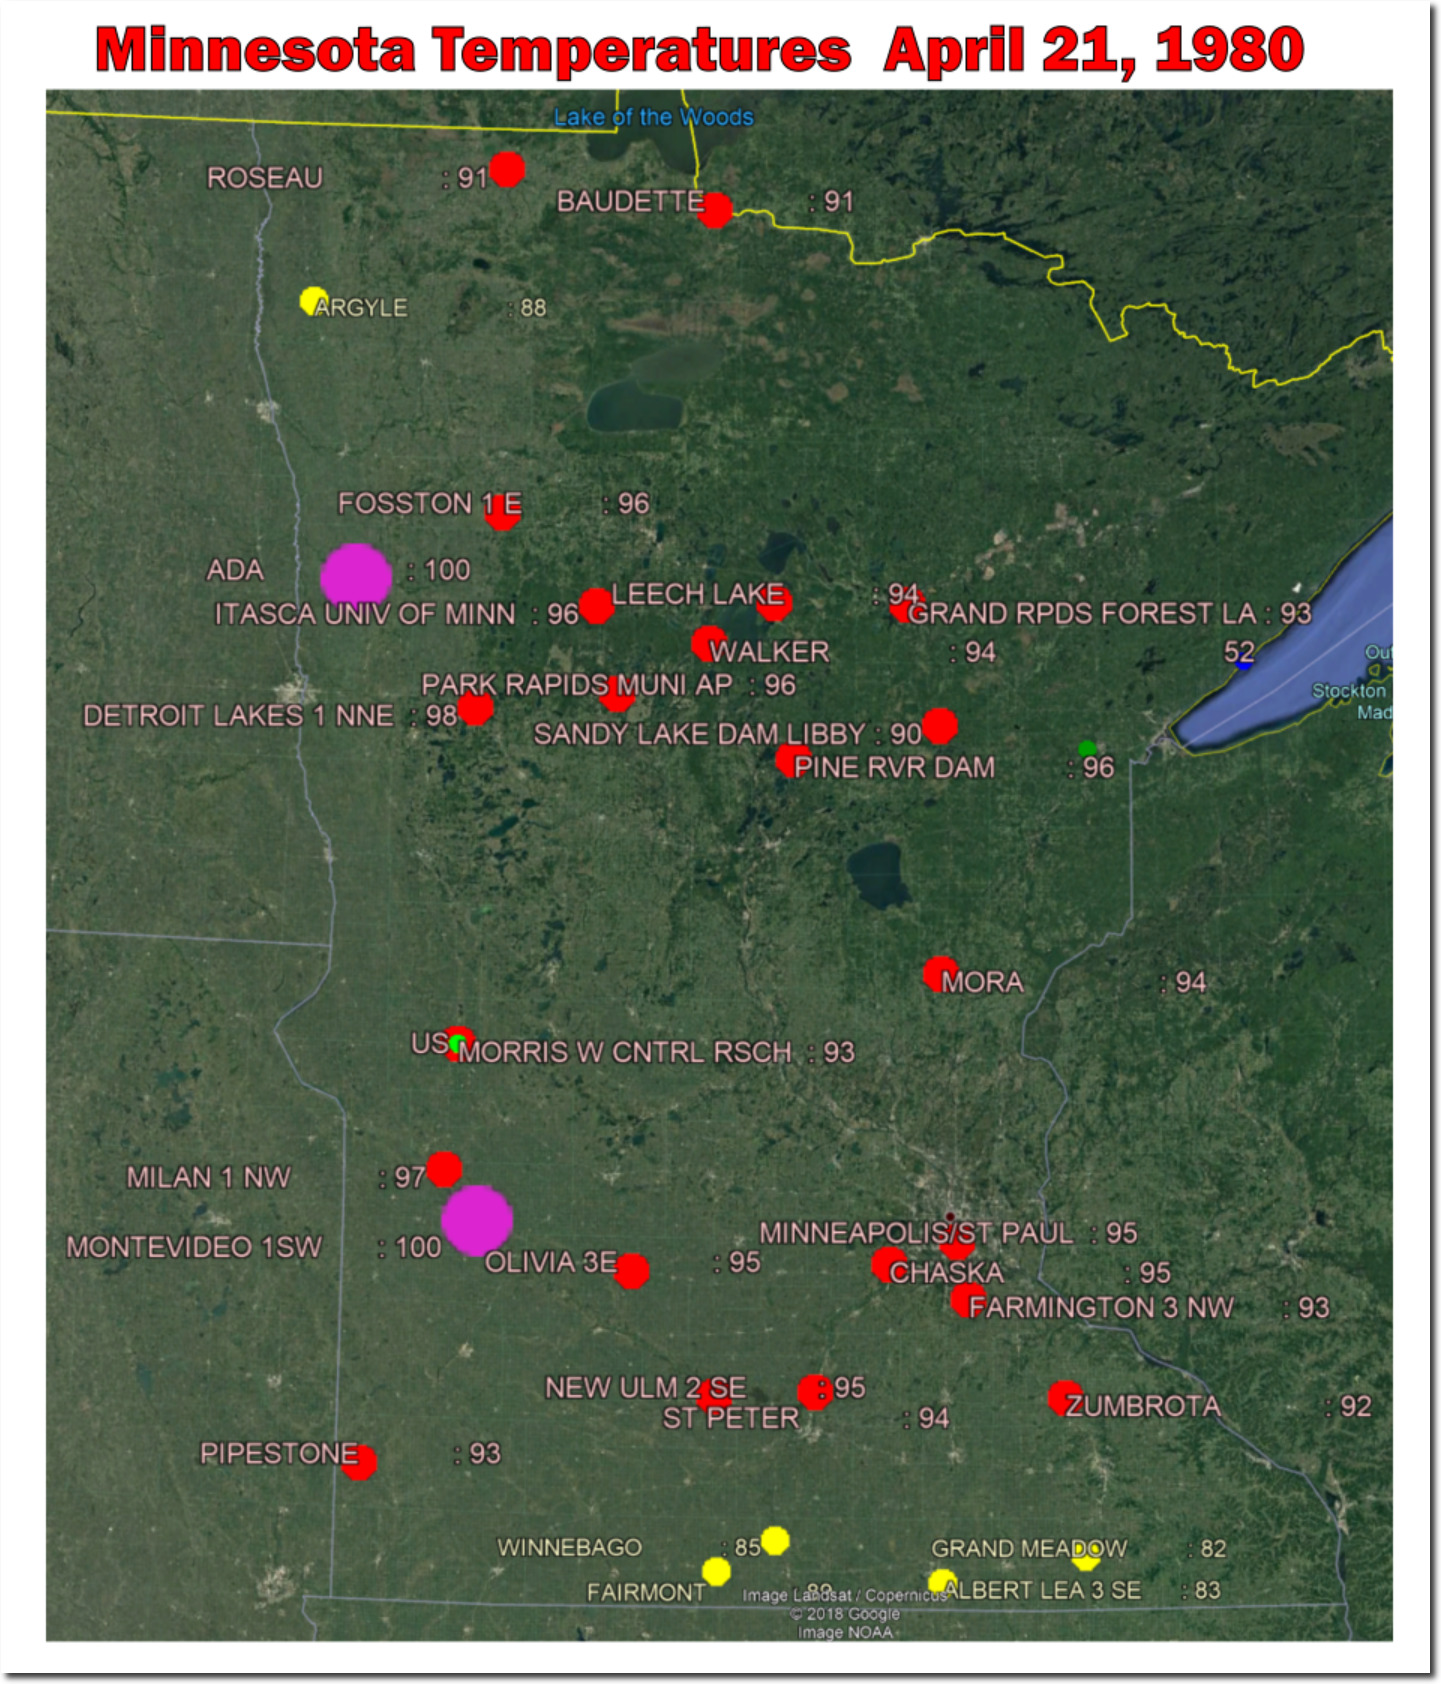
On this date in 1980, Ada and Montevideo, Minnesota both reached 100 degrees. Temperatures like that in April are incomprehensible now.

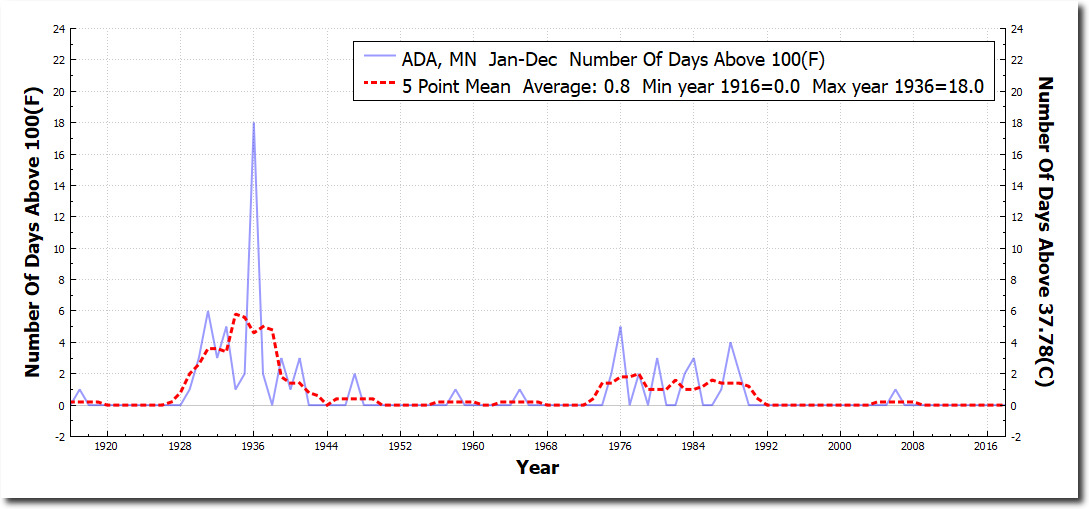
In fact, Ada, Minnesota has only had one 100 degree day this millenium. During 1936, Ada had eighteen 100 degree days.

The frequency of 100 degree days in Minnesota has plummeted and happen only rarely now.

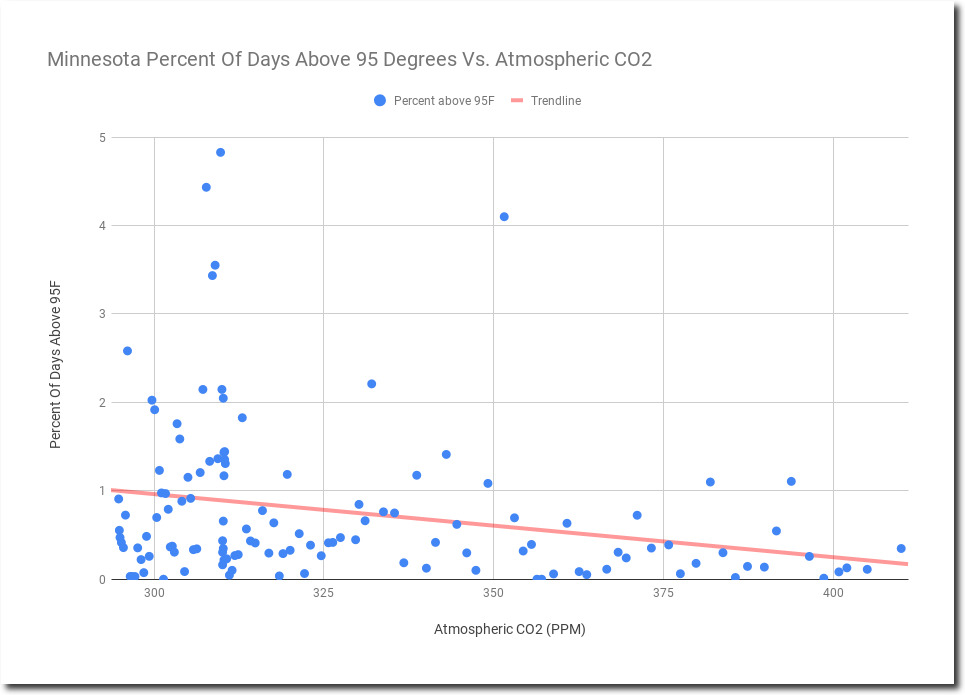
Peak temperatures in Minnesota have also plummeted.

Spreadsheet

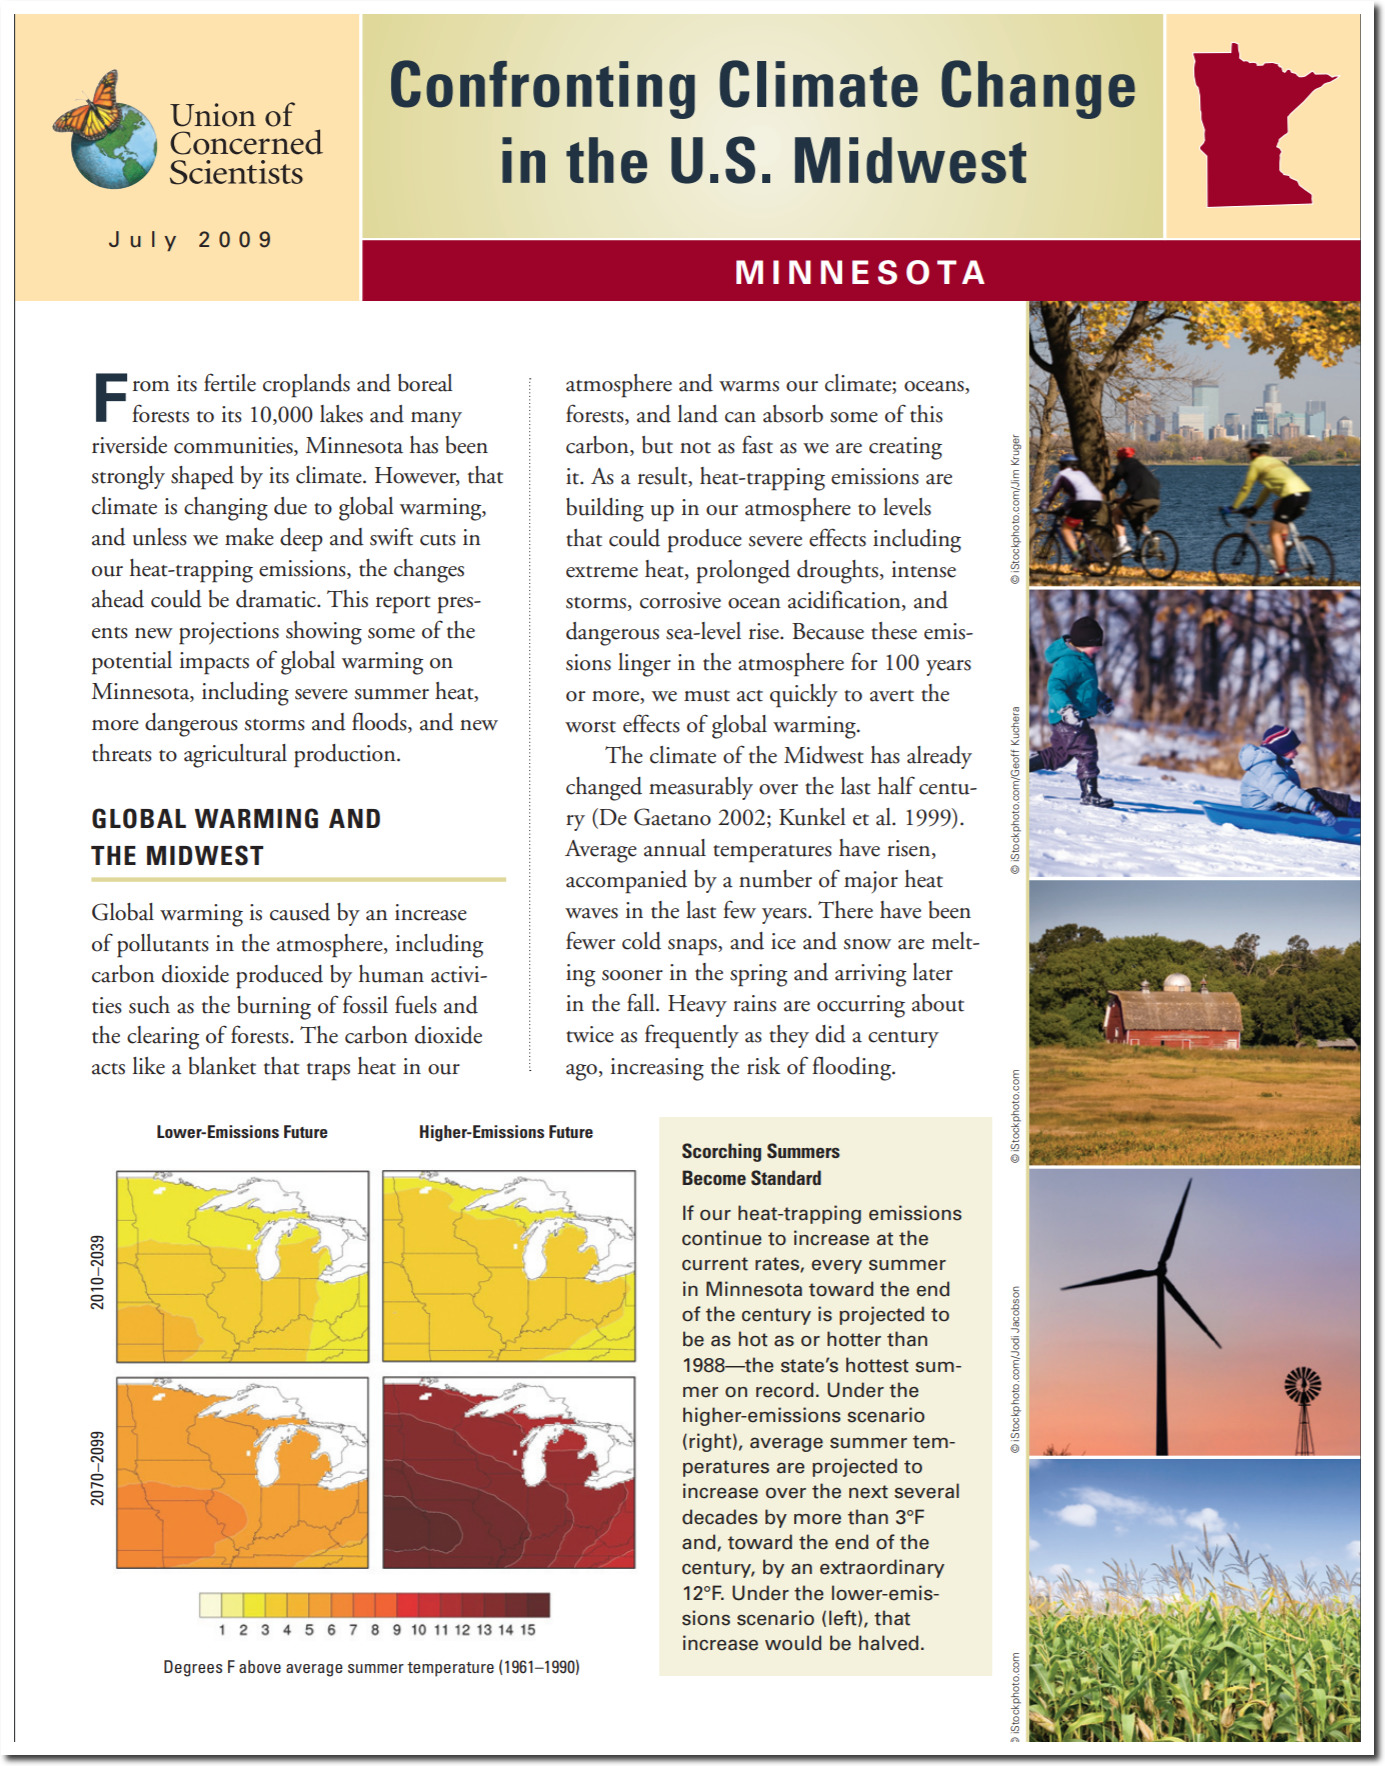
Meanwhile, the fraudsters at the Union of Concerned Scientists claim the exact opposite.

Scorching Summers Become Standard

If our heat-trapping emissions continue to increase at the current rates, every summer in Minnesota toward the end of the century is projected to be as hot as or hotter than 1988—the state’s hottest summer on record

climate-change-minnesota.pdf

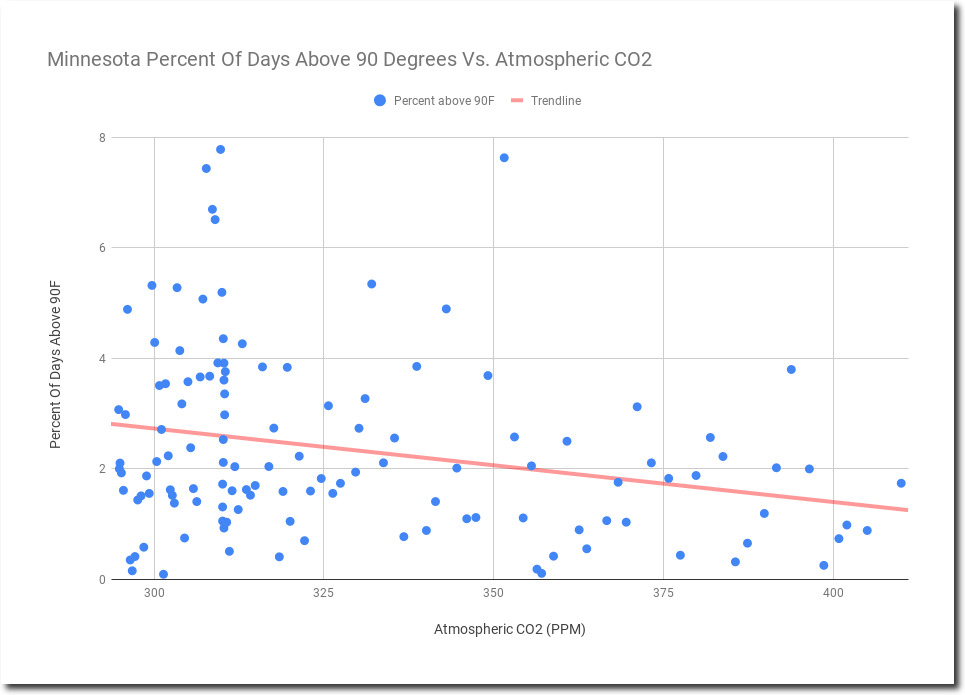
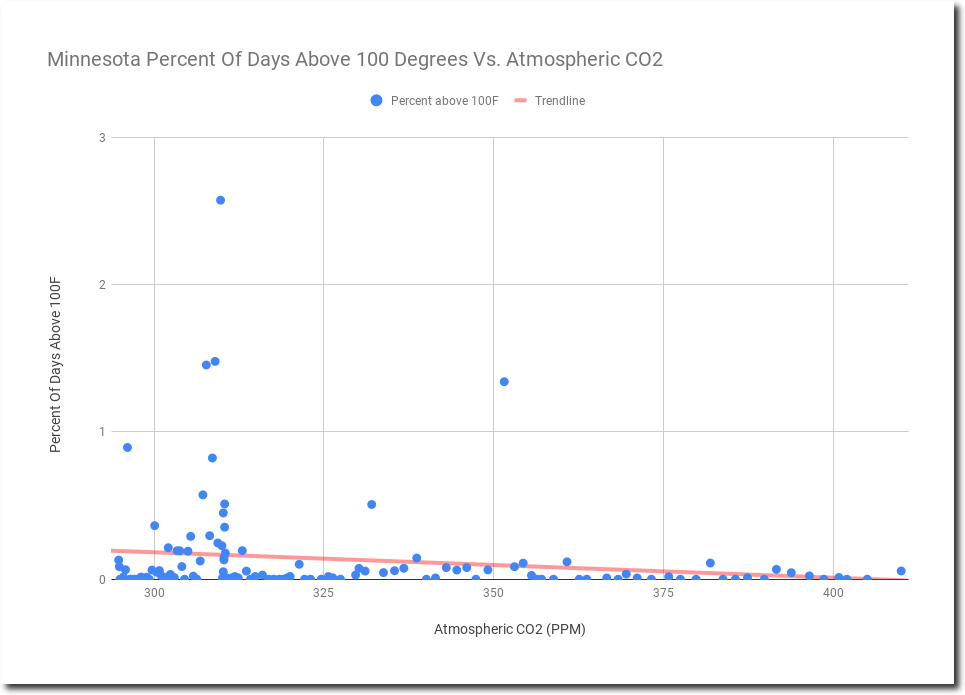
Minnesota temperature data shows the exact opposite.  As atmospheric CO2 has increased, the frequency of hot days has plummeted.

So why hasn’t the scientific community spoken out against this constant barrage of climate lies?  This sort of analysis is very simple and easy to verify, yet peer-reviewed science remains silent in the face of this fraud.

Posted in Uncategorized | Leave a comment

Notre Dame Mystery Finally Resolved

Notre Dame Fire: Why Climate Change Is The Most Likely Culprit

Posted in Uncategorized | Leave a comment