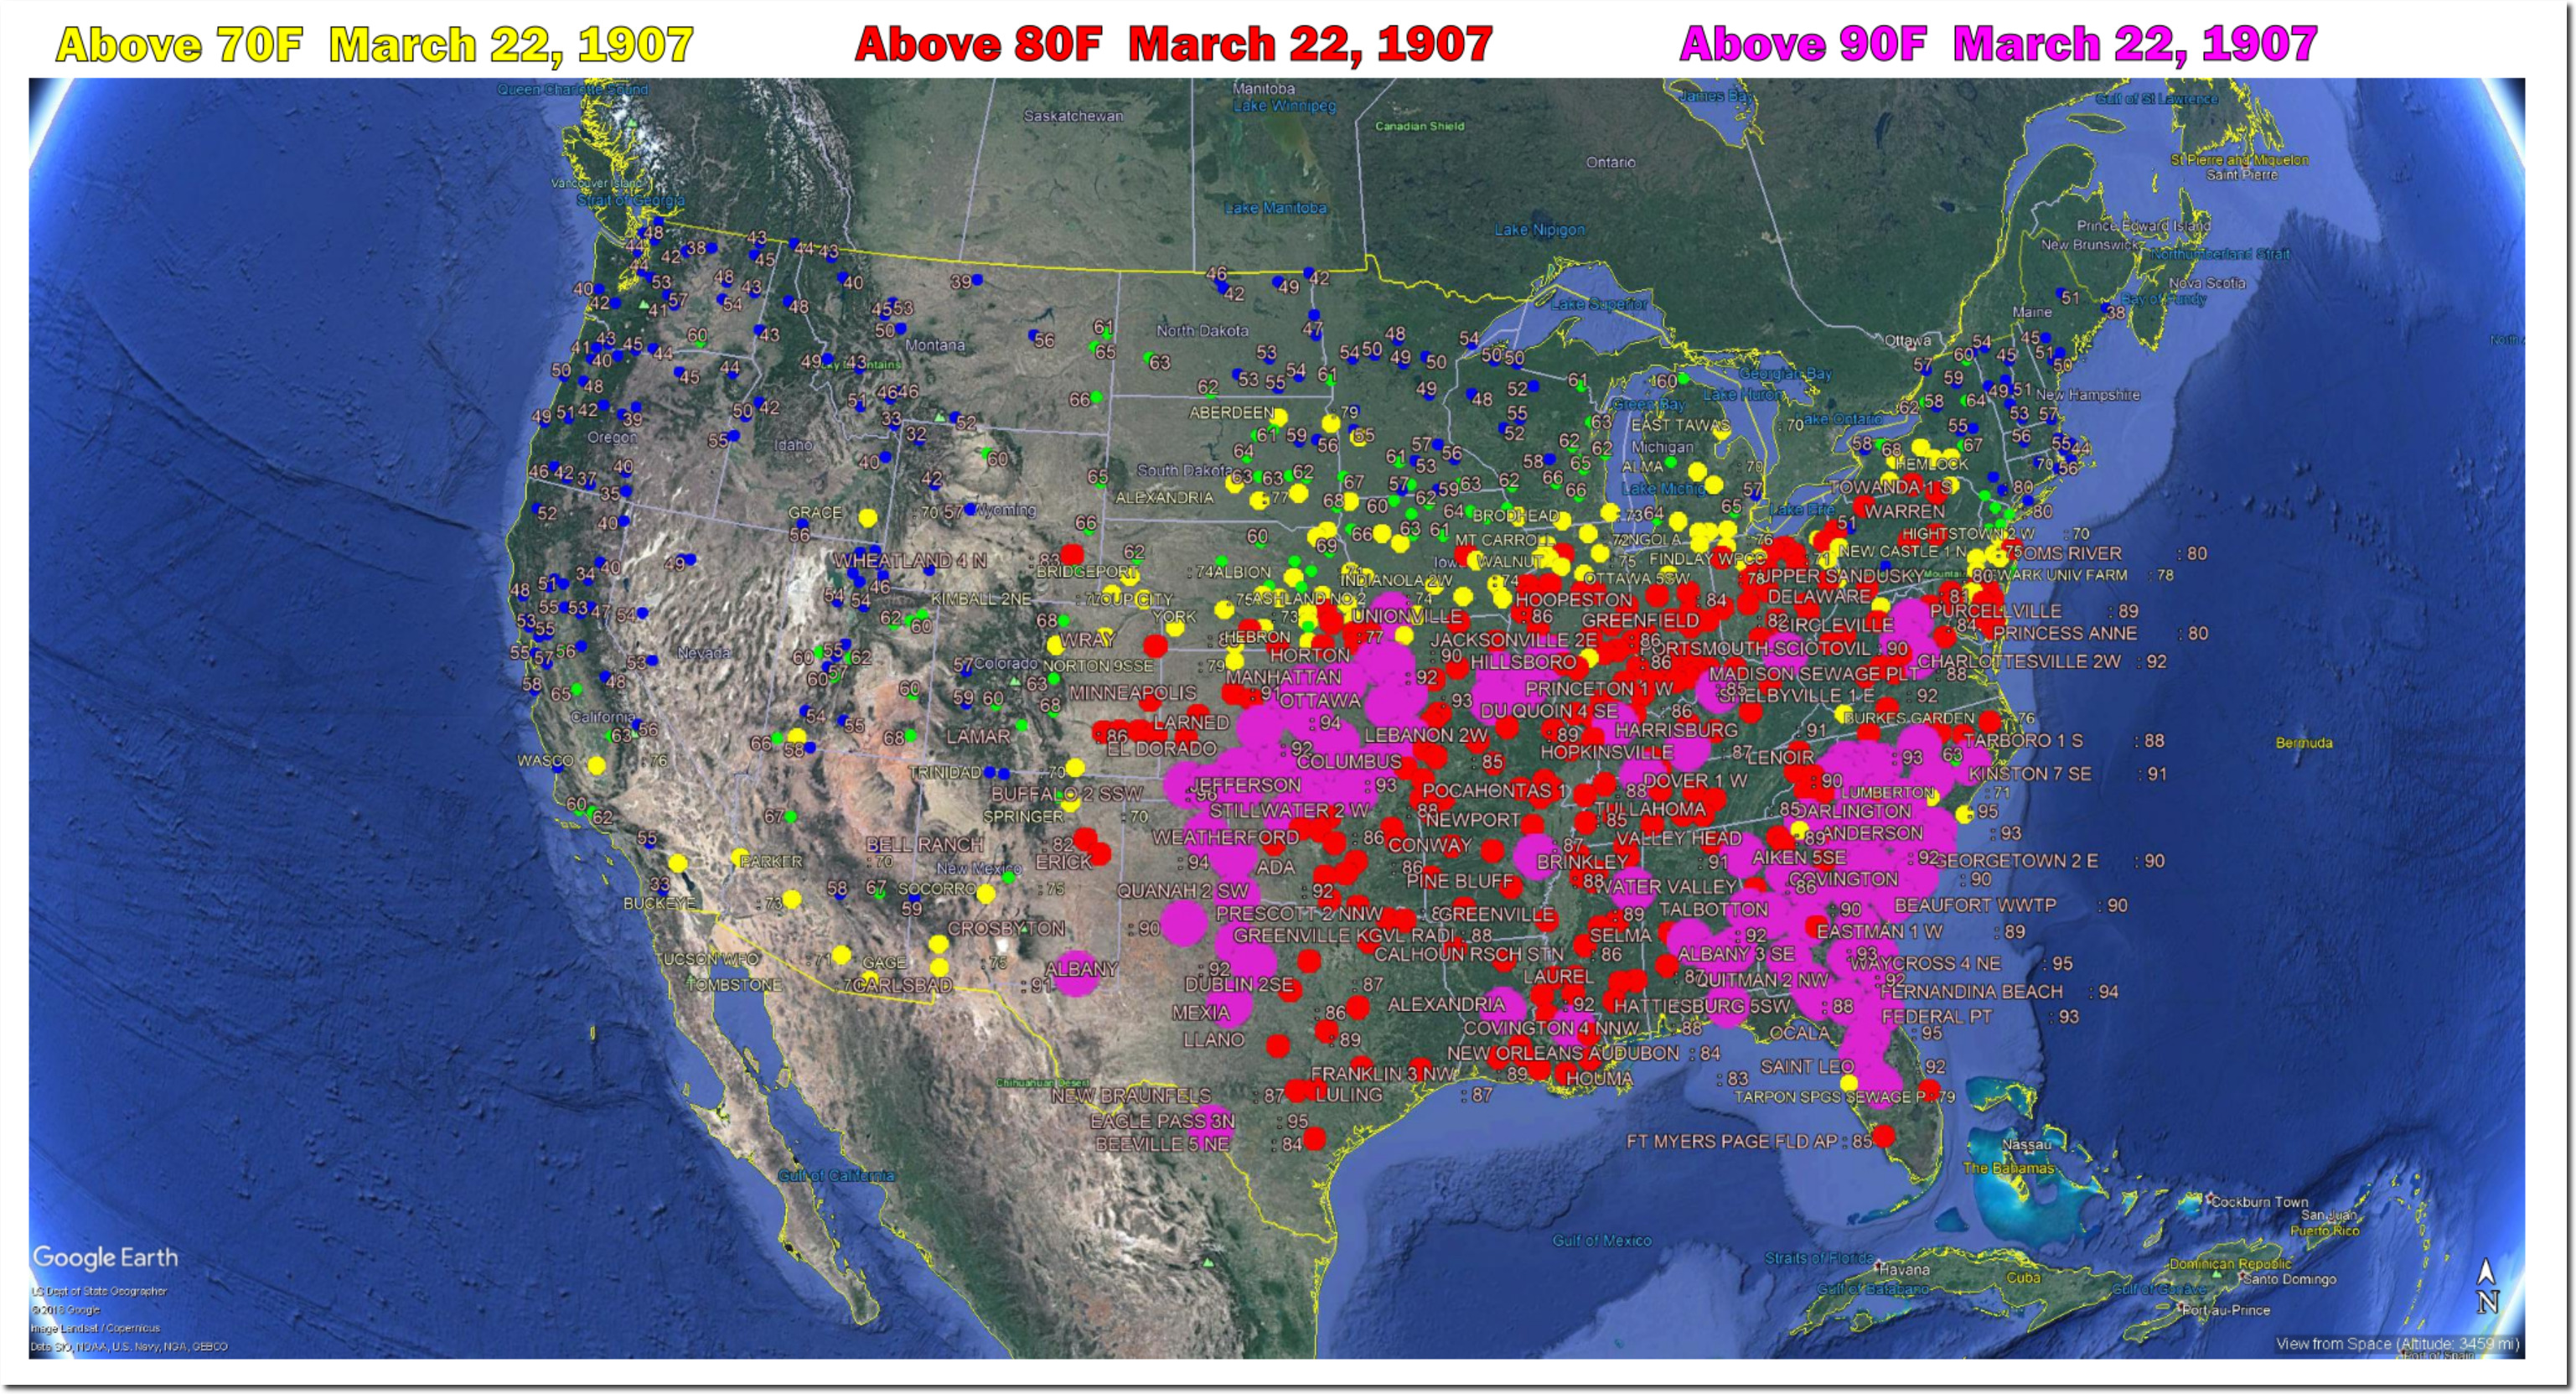
This Date In 1907

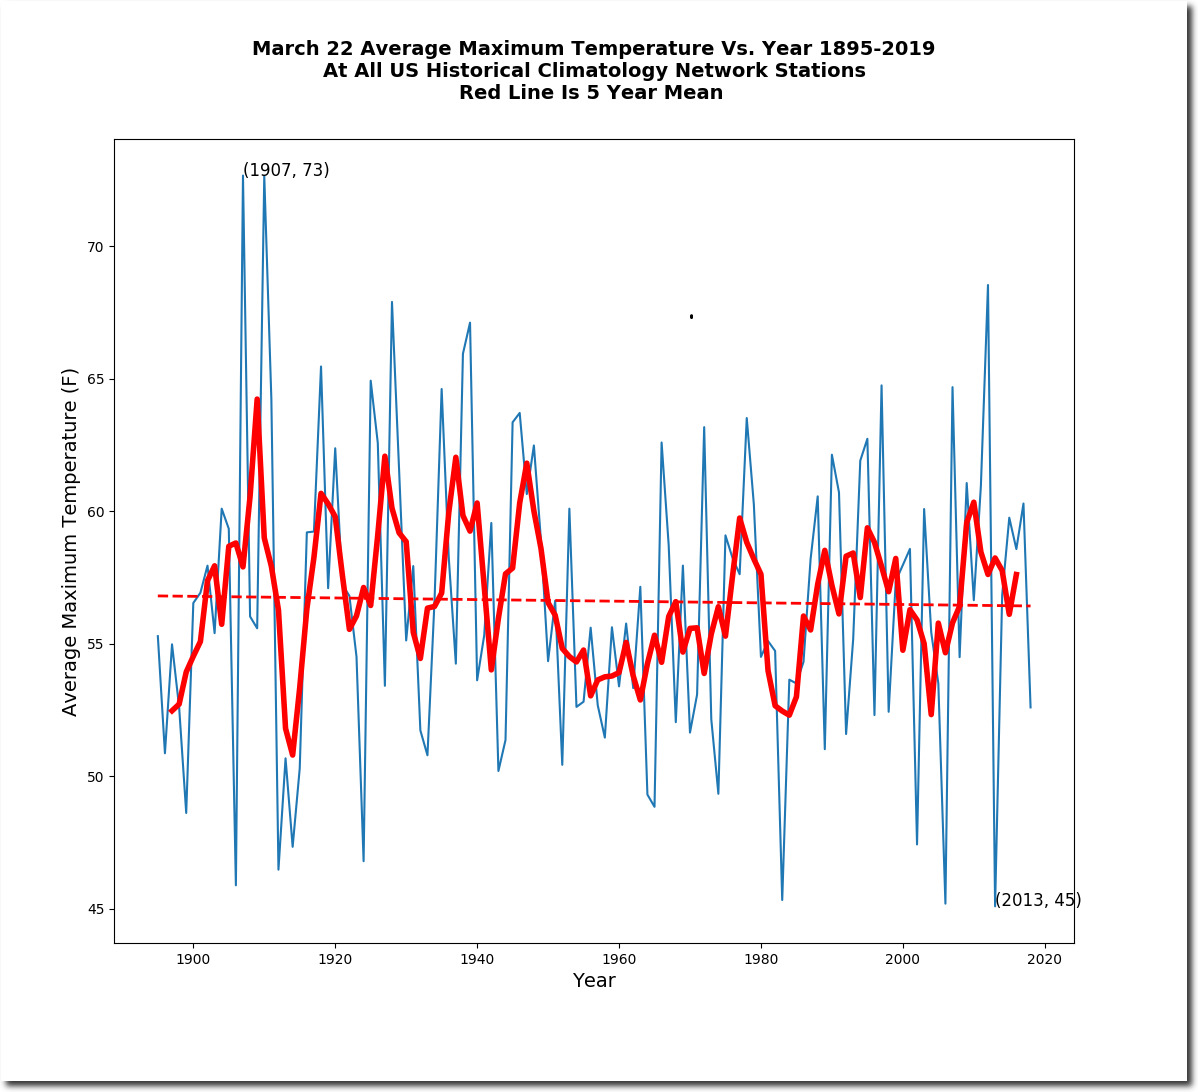
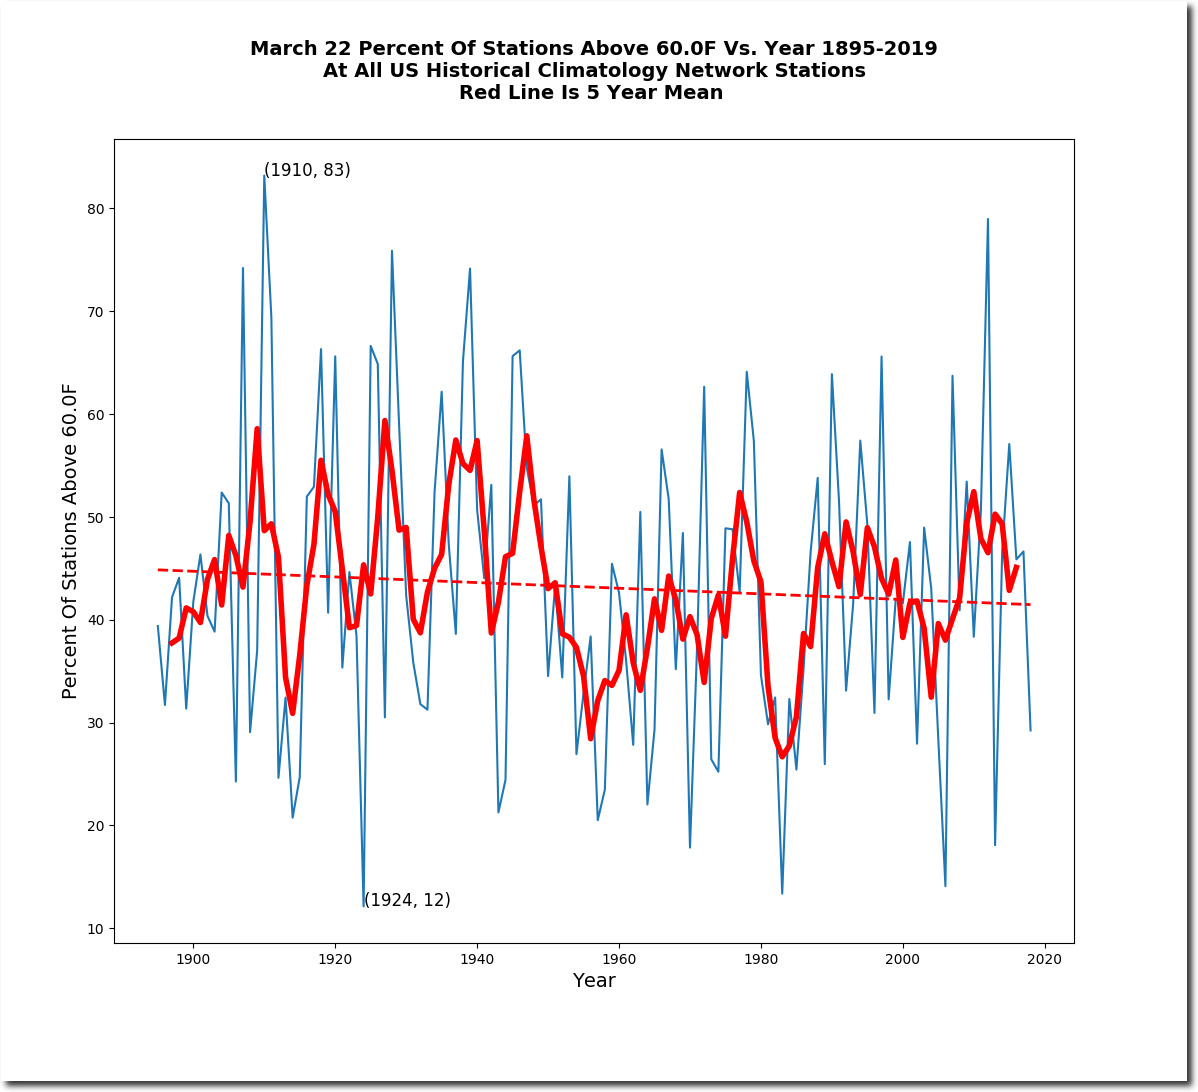
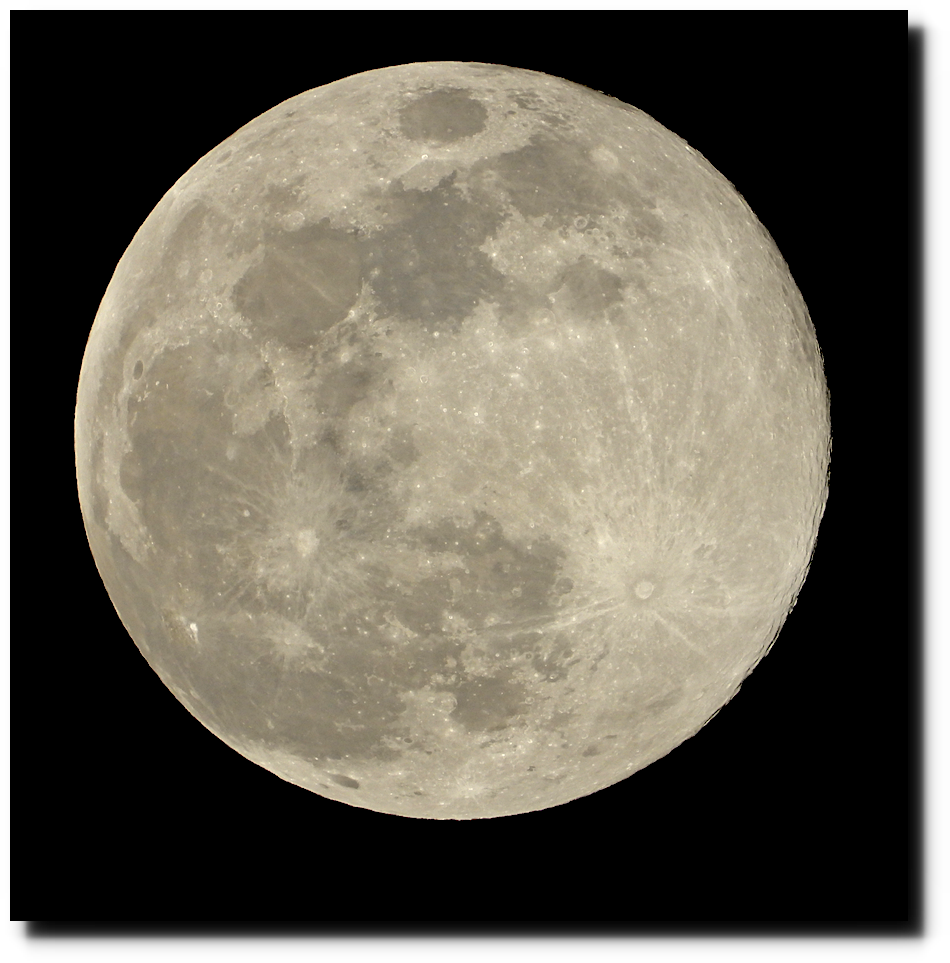
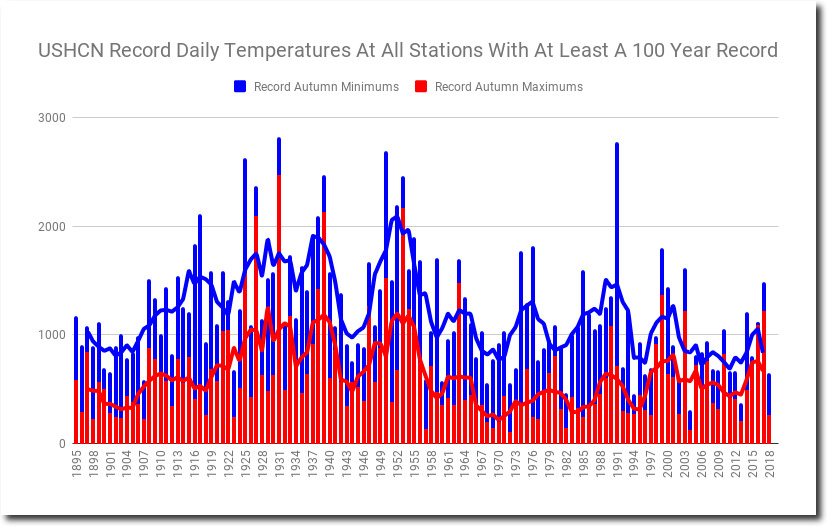
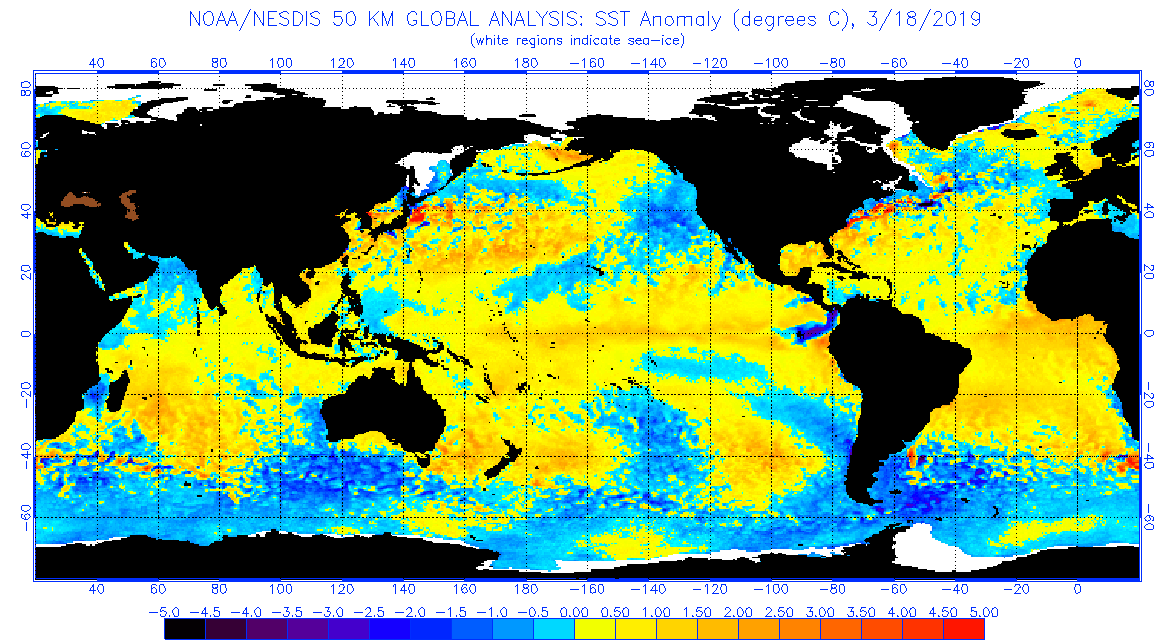
On this date in 1907, the average maximum temperature across the US was 73F, and White Hall, Illinois was 94F – more than 40 degrees warmer than today.  Imagine the hysteria from climate scientists if Illinois had March temperatures that hot today.

The two warmest March 22nd’s were in 1907 and 1910 – when CO2 was 300 PPM.

Posted in Uncategorized | Leave a comment

Latest Shameless Fraud From Climate Scientists

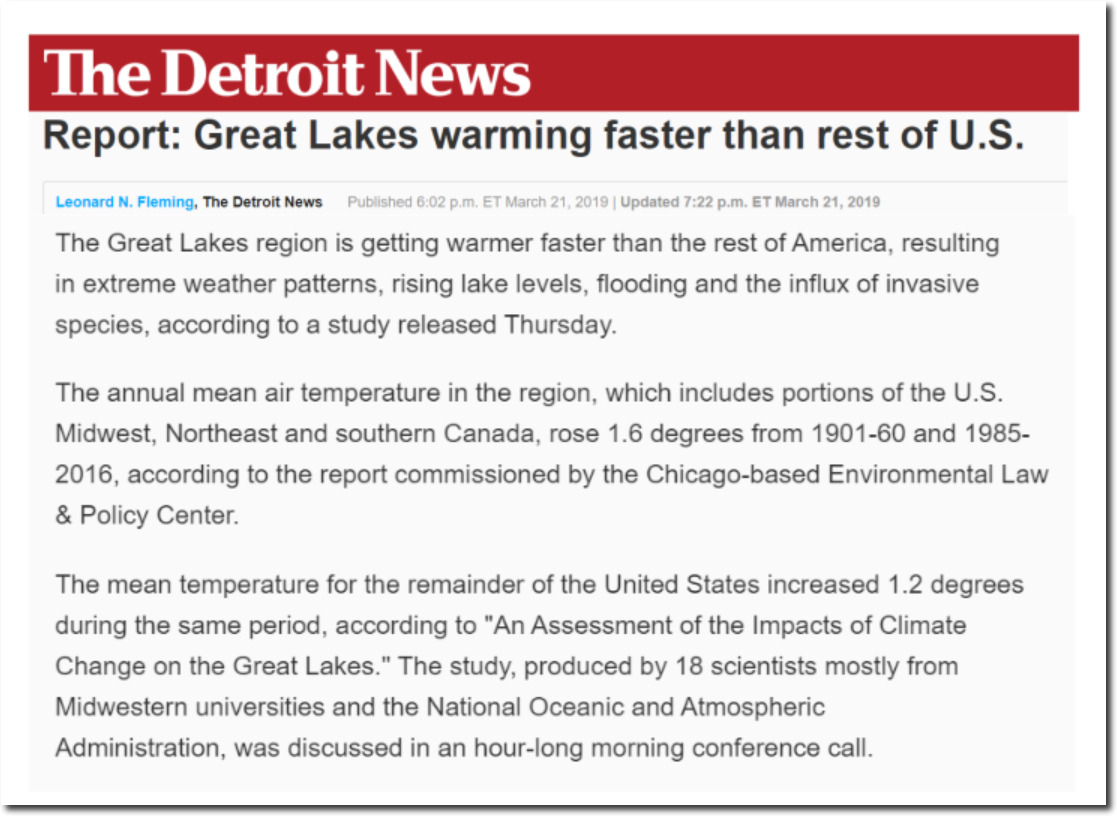
The Great Lakes region is getting warmer faster than the rest of America, resulting in extreme weather patterns, rising lake levels, flooding and the influx of invasive species, according to a study released Thursday.

Report: Great Lakes warming faster than rest of U.S.

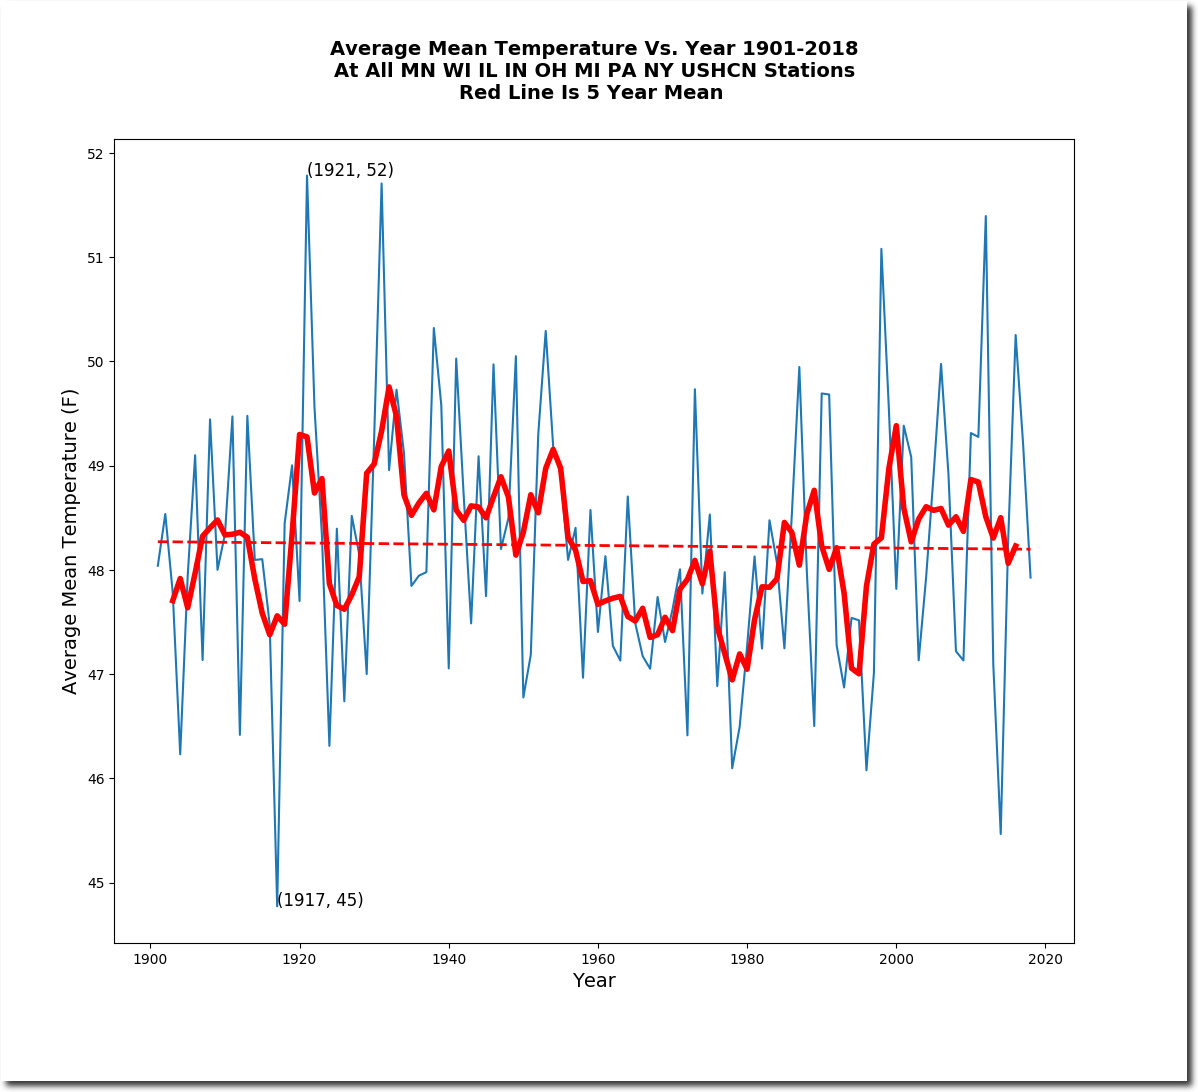
The level of dishonesty in this article is off-scale, but standard practice for climate scientists.  Temperatures in the Great Lakes States peaked in 1921, and have been declining ever since.

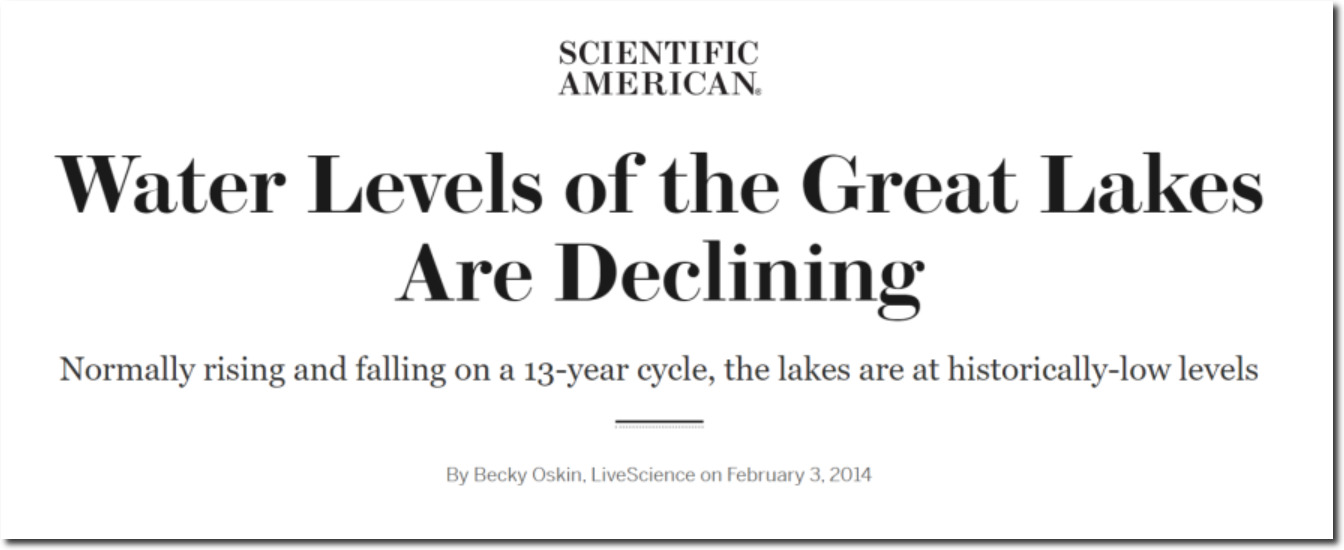
Five years ago, scientists were claiming that global warming was making Great Lakes water levels decline.  Now they say global warming is making Great Lakes water levels increase.

Water Levels of the Great Lakes Are Declining – Scientific American

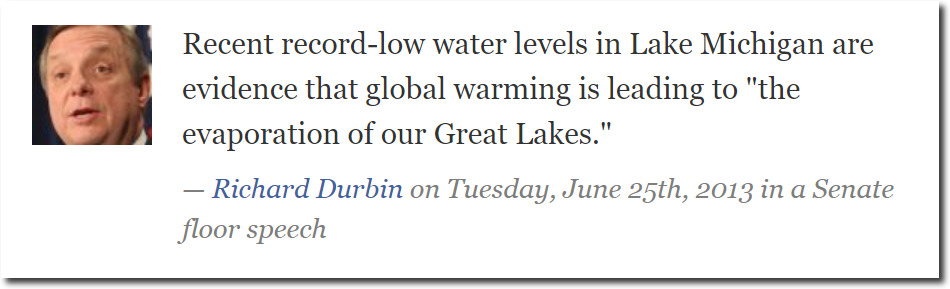
In 2013, the #2 Democrat in the Senate said that global warming was making the Great Lakes dry up.

Dick Durbin says global warming is leading to “the evaporation of our Great Lakes” | PolitiFact

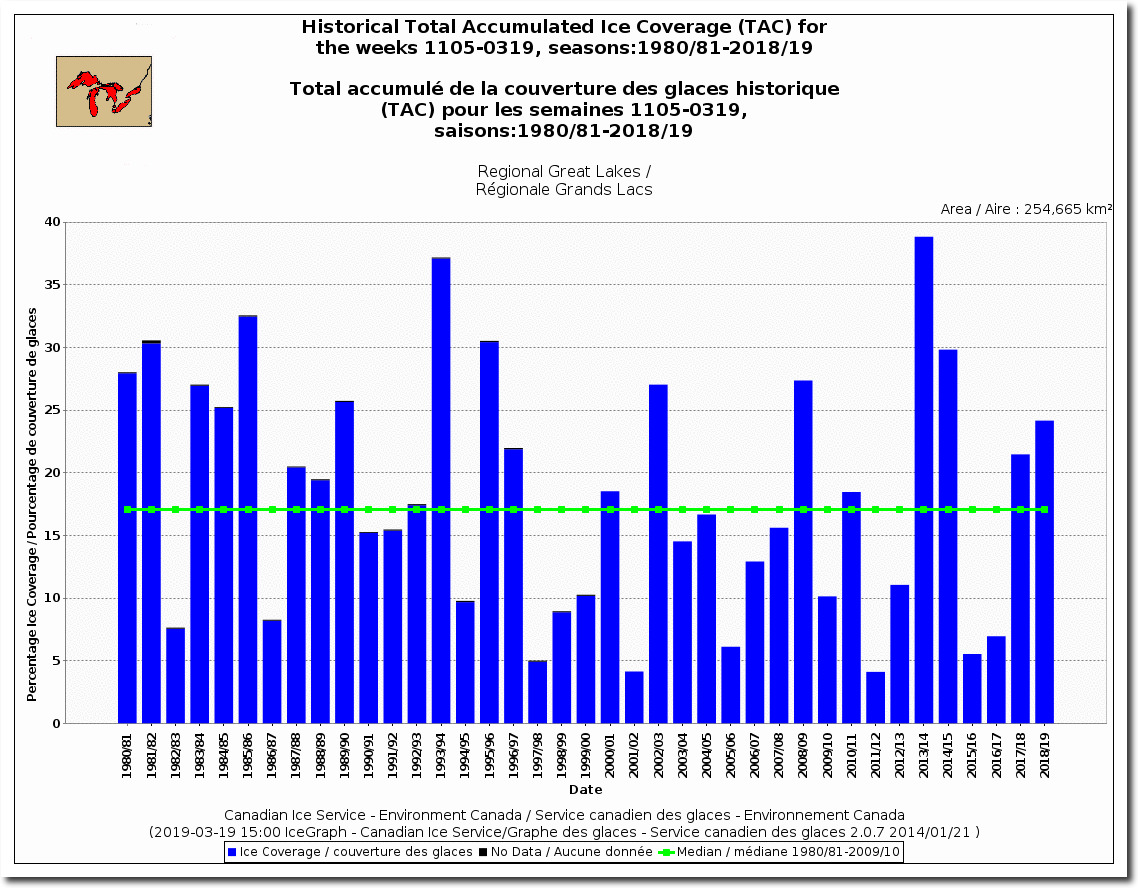
Ice levels on the Great Lakes have been above average for four out of the last six years. There is zero evidence that the Great Lakes are warming, or that climate scientists are capable of being honest about anything.

20190318180000_CVCHACTGL_0010503159.gif

These academics understand that they can say anything and not be challenged, and that the press will refuse to acknowledge anyone who speaks factually about the topic.

Posted in Uncategorized | Leave a comment

The Early Bird Gets The Rabbit

Harriers hunt by silently gliding just above the ground.

Hawks hunt from trees.

Posted in Uncategorized | Leave a comment

Today’s Top Pictures


Posted in Uncategorized | Leave a comment

More Global Warming Problems In Canada

With or without icebreaker, Qajaq can’t get through, says coast guard | CBC News

Posted in Uncategorized | Leave a comment

Universal Golf Lessons

Solving global warming will require universal, common sense, golf background checks, to keep duffers from filling up the ocean with golf balls.  And we need to get the terrorist USGA out of the way, to solve this critical problem.

Teenage Diver Finds Tons Of Golf Balls Rotting Off California . News | OPB

Posted in Uncategorized | Leave a comment

New Video : The Climate Industrial Complex

Posted in Uncategorized | Leave a comment

Latest Big Lie From The Climate Industrial Complex

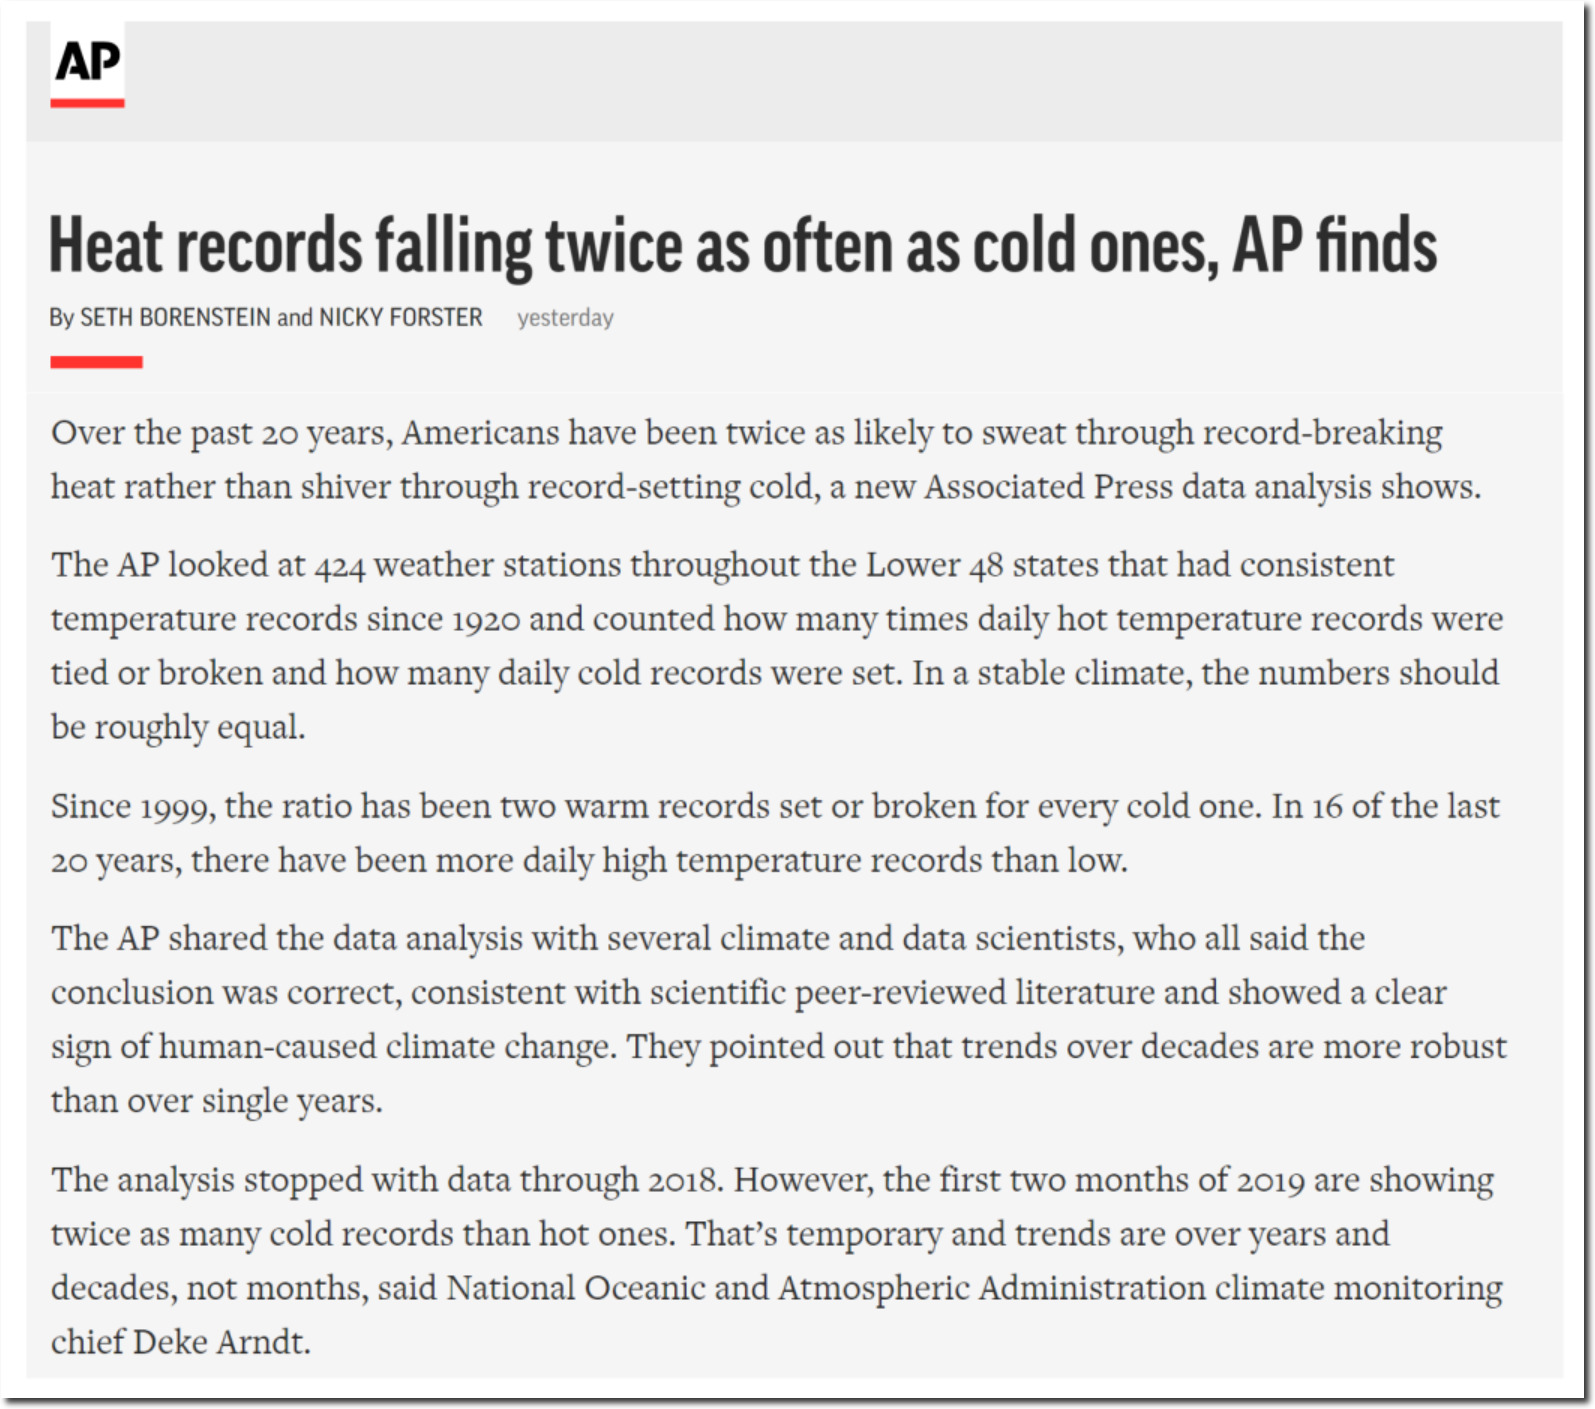
Over the past 20 years, Americans have been twice as likely to sweat through record-breaking heat rather than shiver through record-setting cold, a new Associated Press data analysis shows.

Heat records falling twice as often as cold ones, AP finds

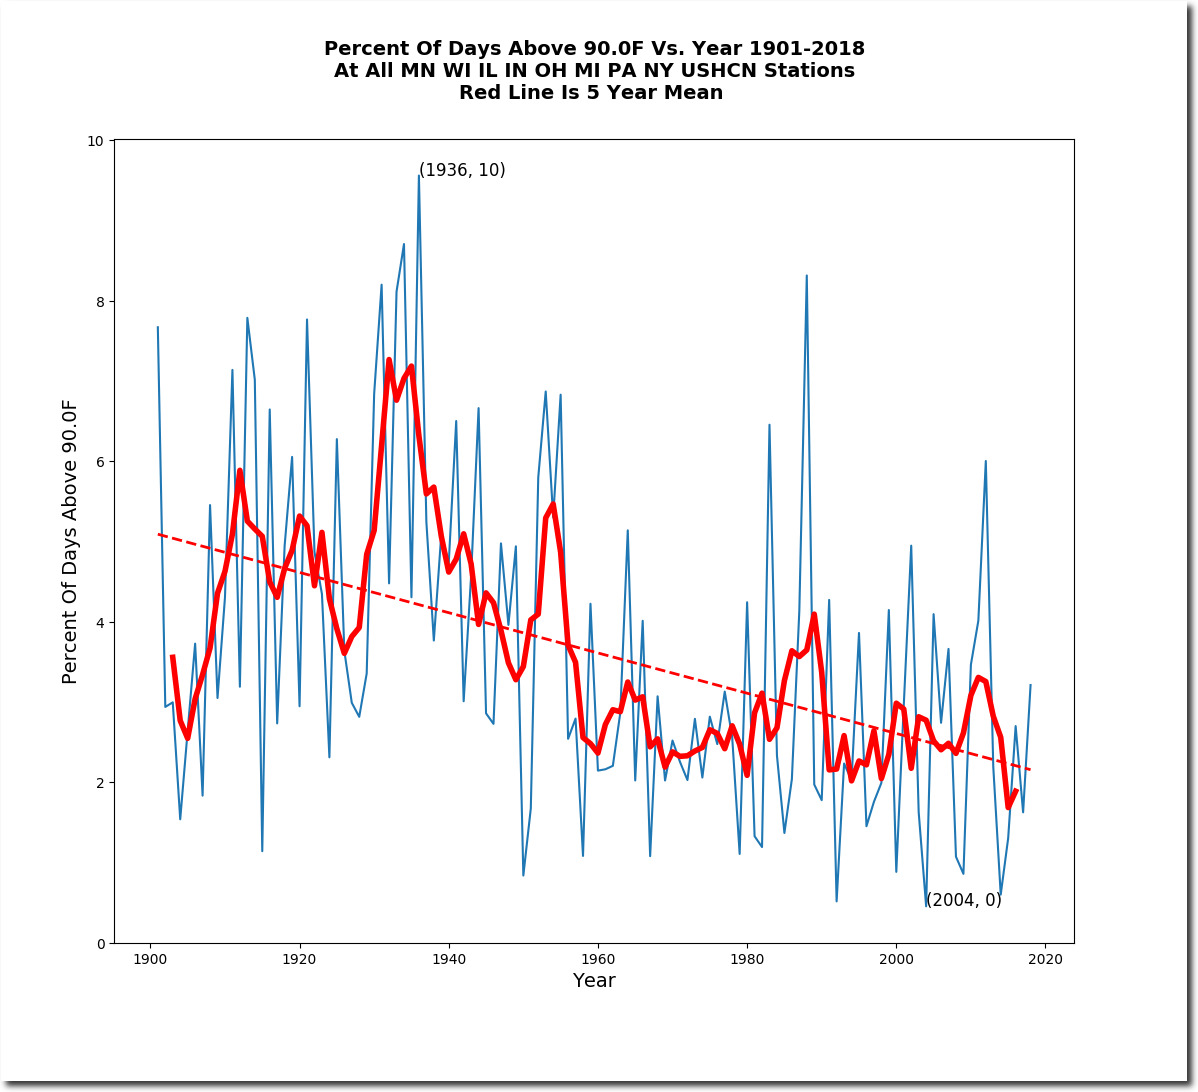
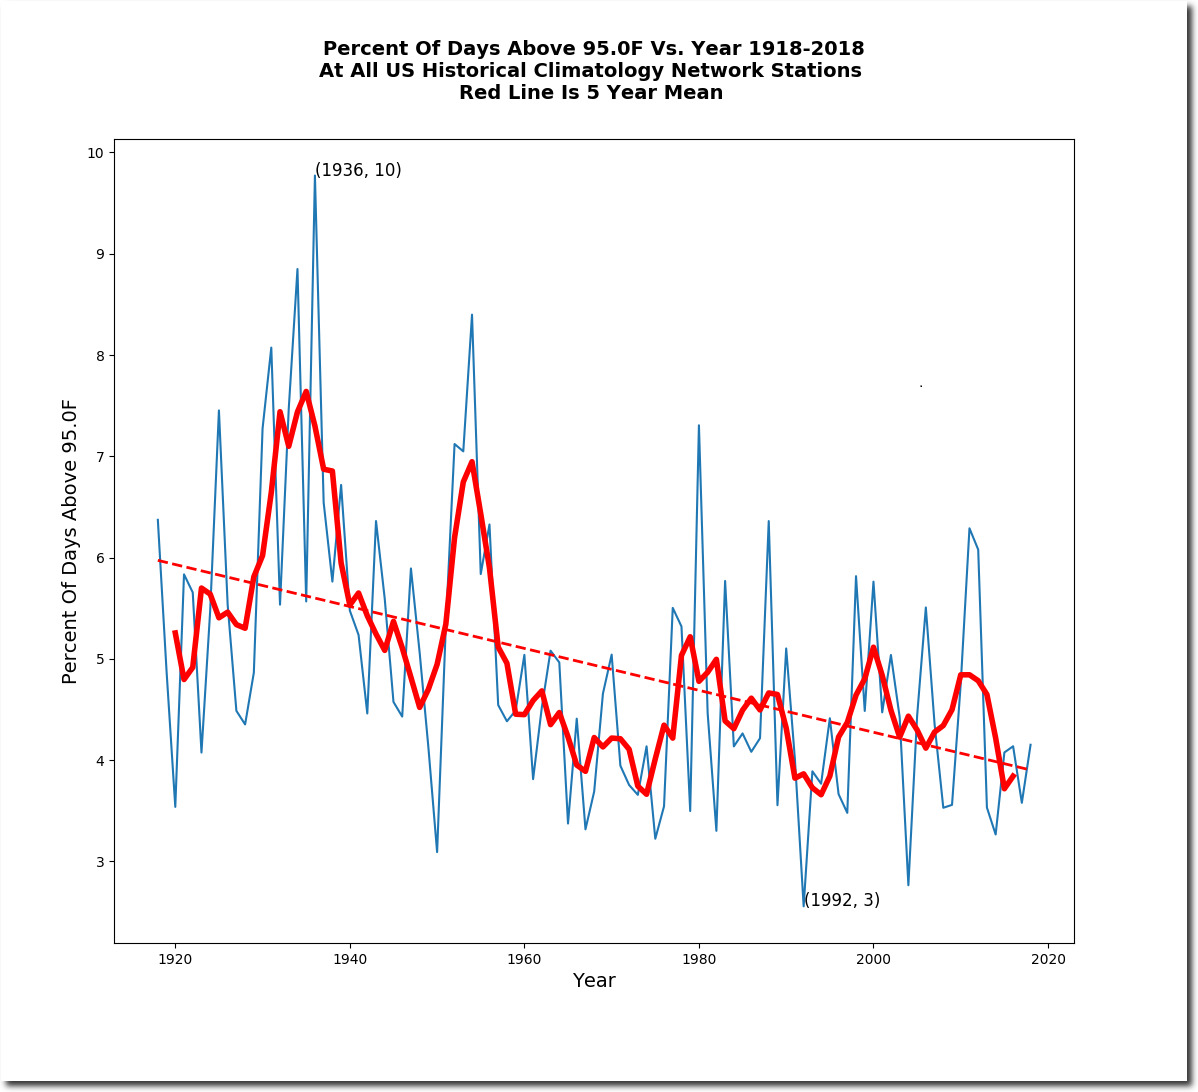
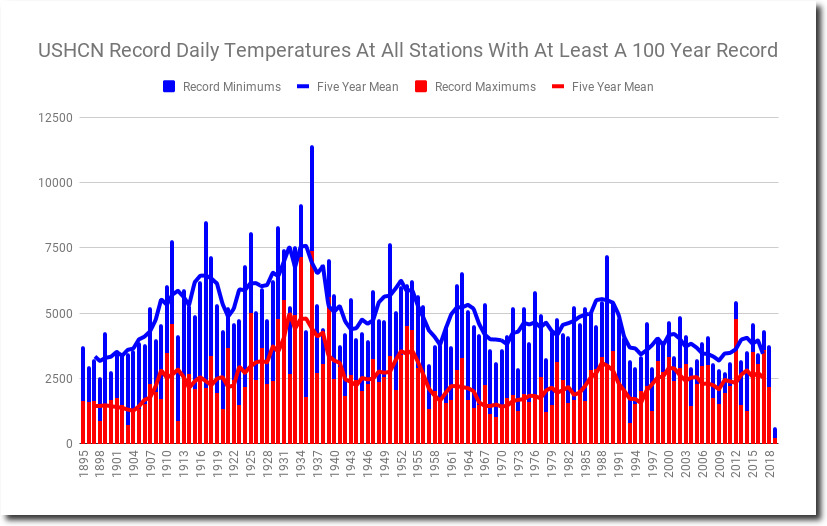
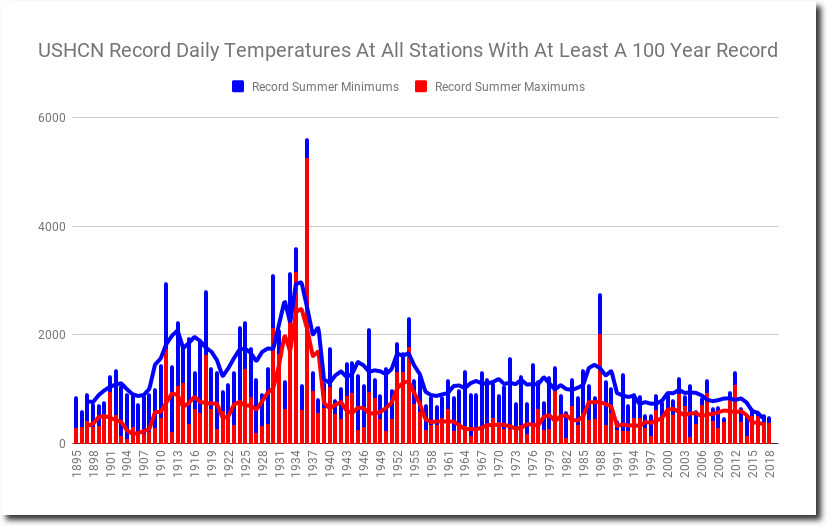
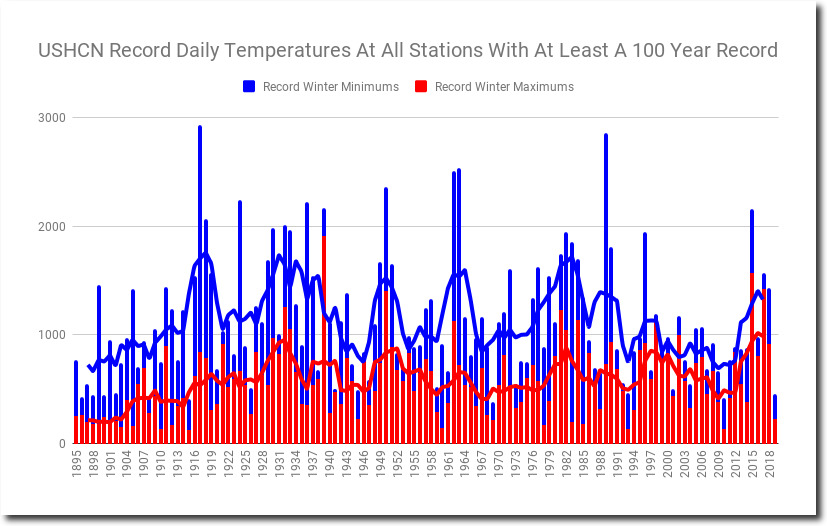
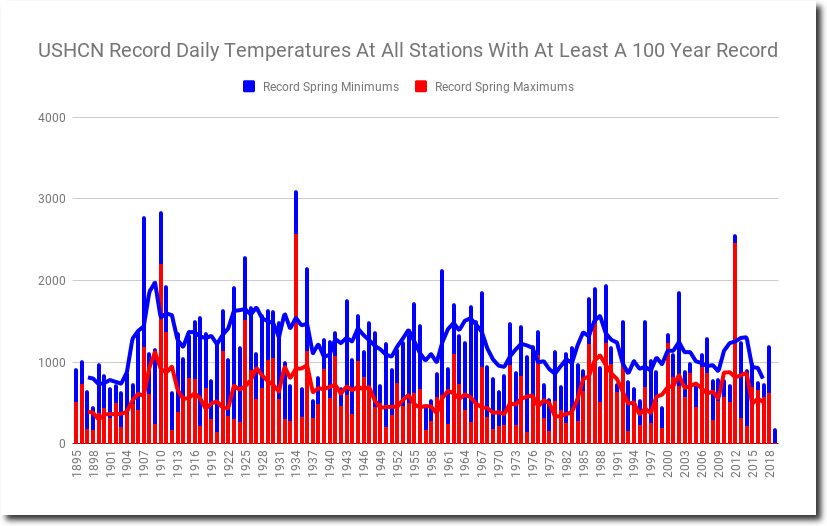
This is complete nonsense. The frequency of hot days has plummeted in the US over the past century.

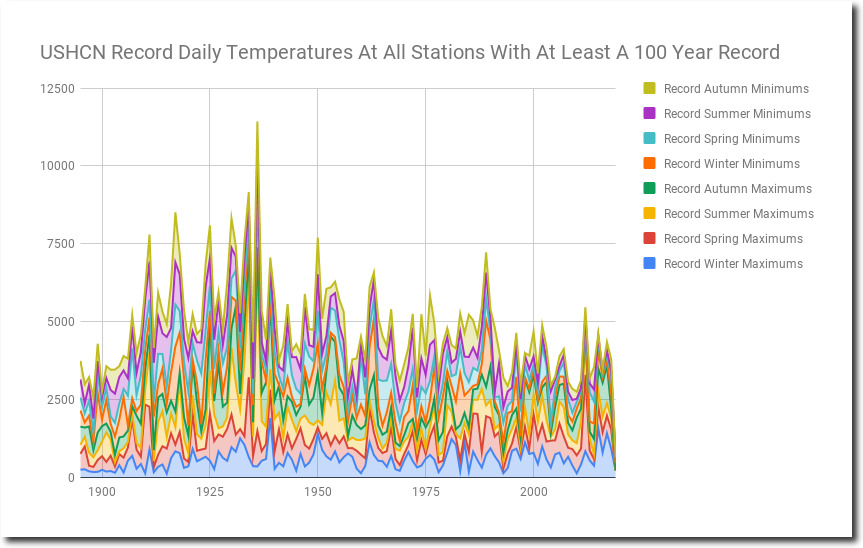
The frequency of both record hot and record cold days has declined.

Sweltering heat occurs in the summer, and the frequency of sweltering days has plummeted.

2012 had a very mild and pleasant spring.  People were playing golf in 60 degree weather – not “sweltering.”


It is true that the number of record cold days has declined faster than the number of record hot days, but the only meaningful conclusion which can be reached is that the US is becoming milder – with both less extreme heat and cold. The AP and NOAA are intentionally deceiving the public, just like they always do.

Posted in Uncategorized | Leave a comment

Courting Flickers

Posted in Uncategorized | Leave a comment

NOAA : “among the eight warmest Februarys on record”

NOAA says last month was “among the eight warmest Februarys on record” in much of the Earth.

According to NCEI’s Regional Analysis, South America, Europe and Oceania had a February temperature that ranked among the eight warmest Februarys on record.

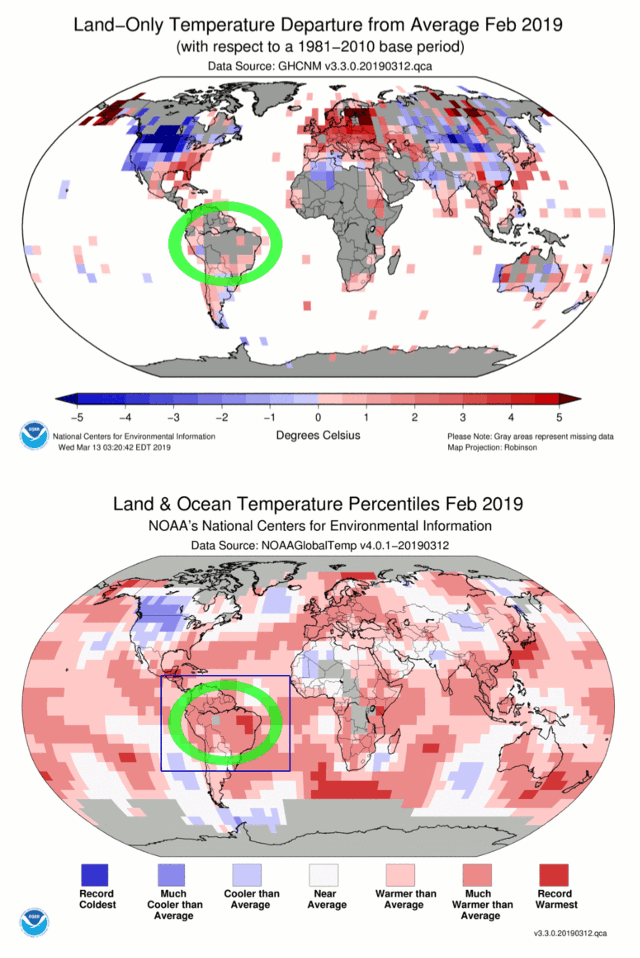
There is no such word as “Februarys” – plural for February is Februaries. But besides the fact they are illiterate, they are also lying.  This is the map they use to justify their claims:
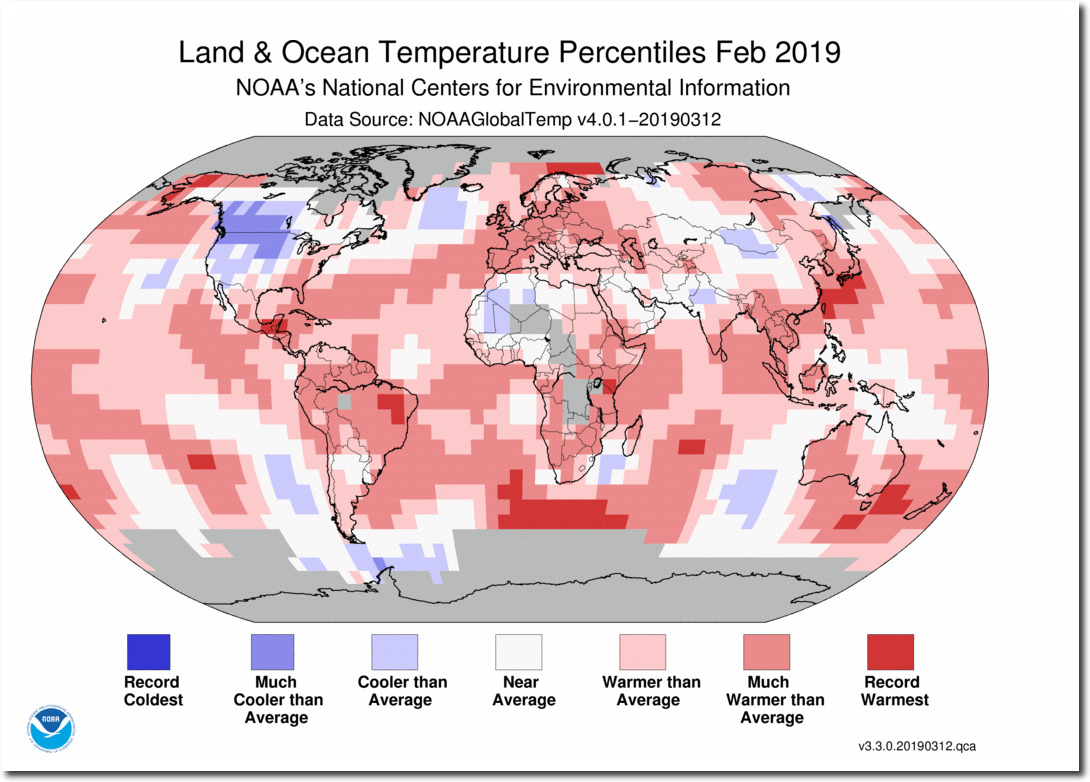
It looks like the world is burning up, with just a few slightly cool areas. It has an official government seal on it, so it must be accurate, right?

The map below shows where NOAA actually had surface temperatures in February.
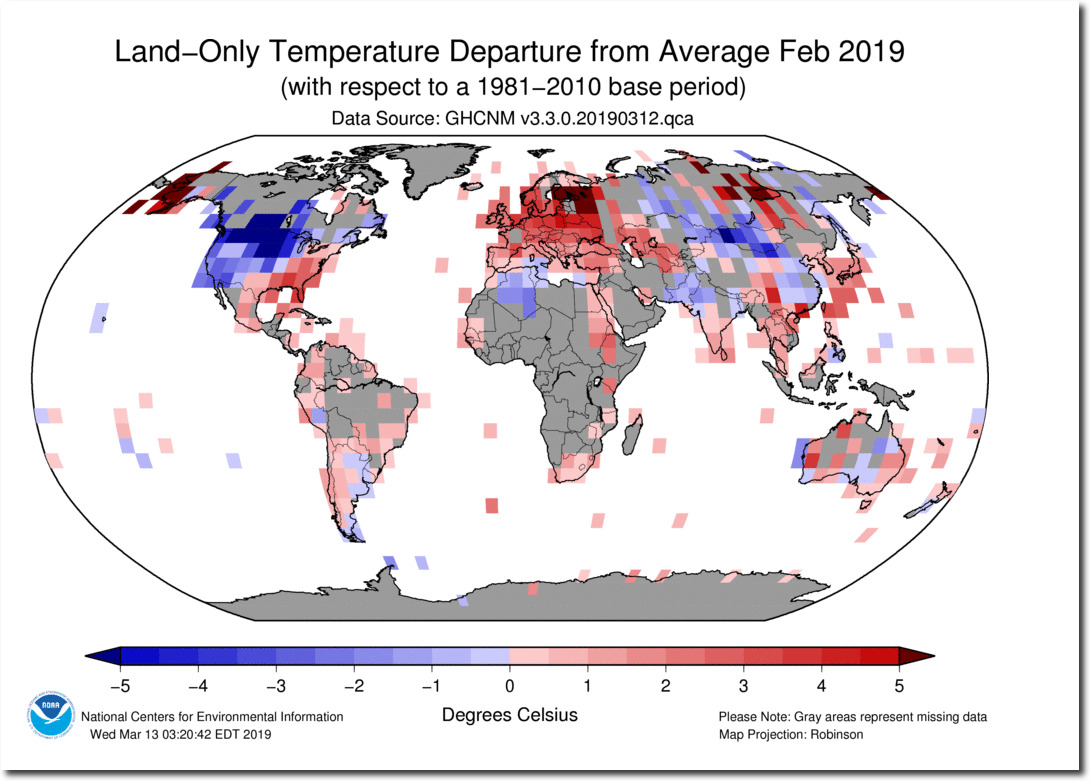
201902.gif (1052×743)

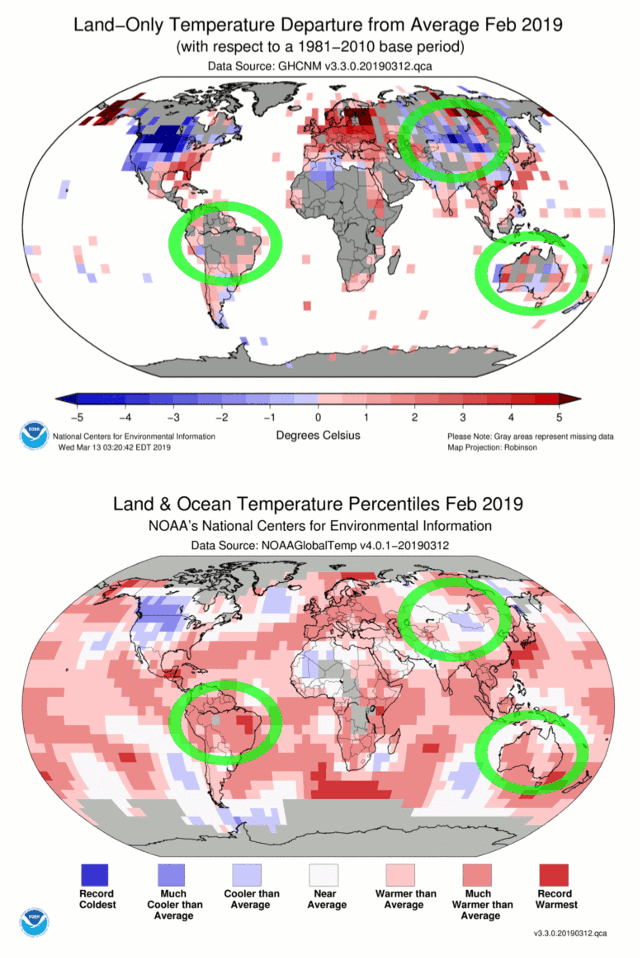
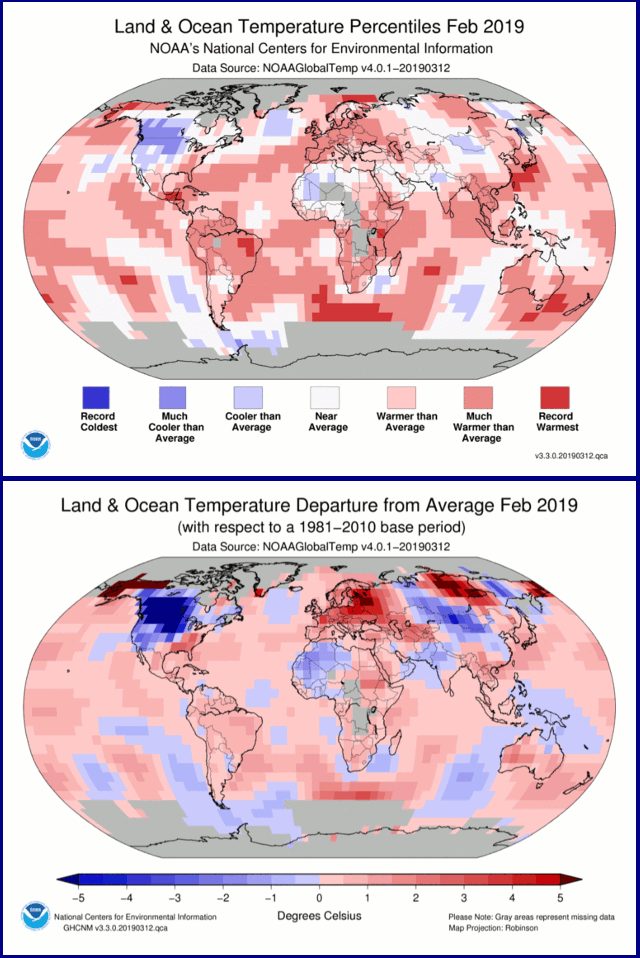
The map looks nothing like the one NOAA presents to the public.  By pixel count, 51% of the land area is gray “missing data,” 16% is below normal temperature, and 33% is above normal. The animation below shows how they created one of the eight warmest “Februarys” in South America – by simply making up data, including record warmth in Brazil in locations with no actual thermometer data.
Also note how they made the cold in Asia and parts of Australia disappear.
And they largely made the near record cold in much of North America disappear.
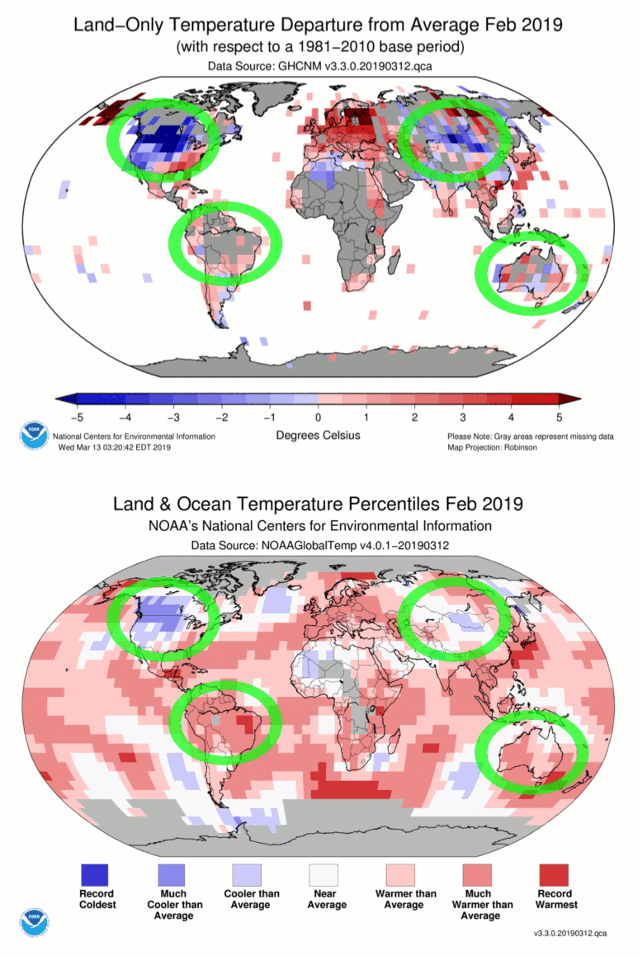
Montana and the Dakotas were 20 degrees below normal, as was much of Canada. Here is how the Washington Post described it:

The February temperature departures from normal were stunning. Several major climate locations averaged 27 to 28 degrees below normal, the most extreme departures in the Lower 48 for a full month since January 1969
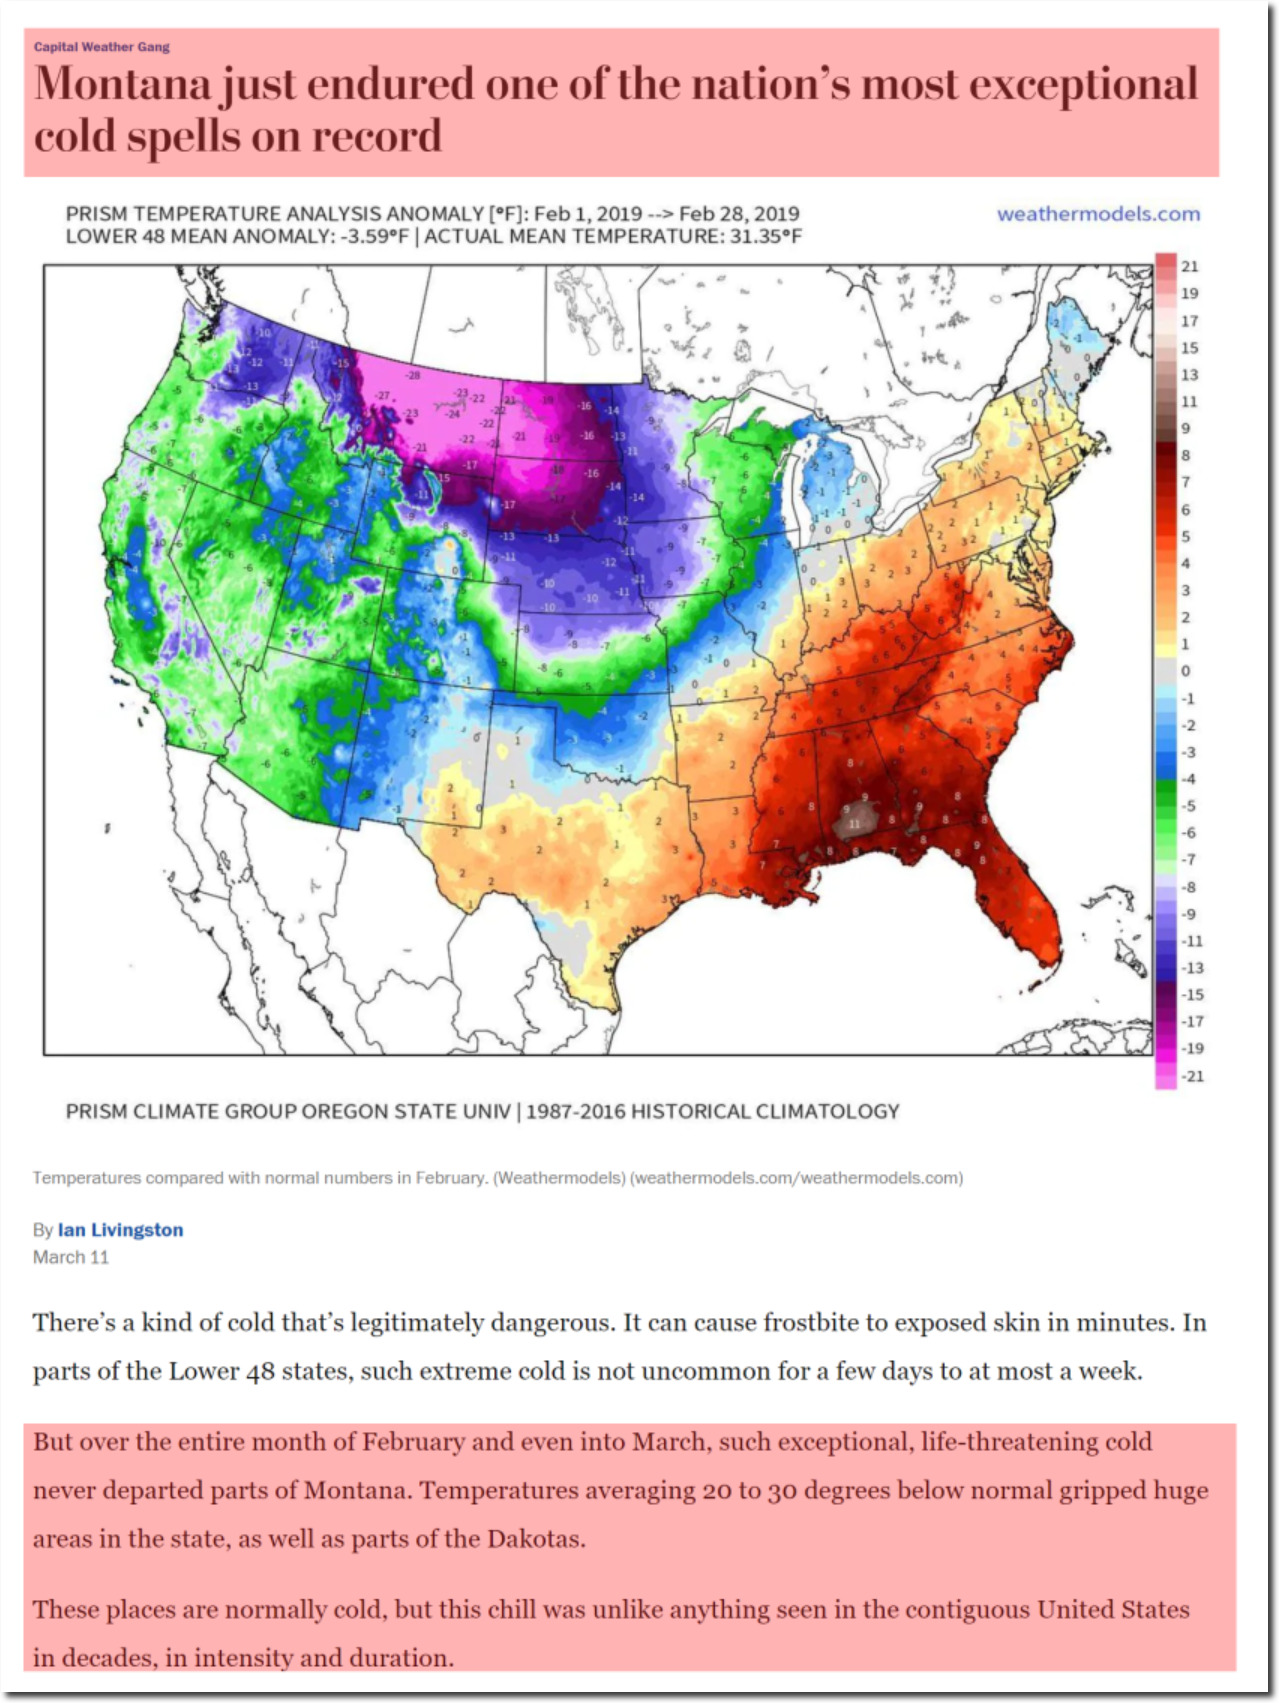
Montana just endured one of the nation’s most exceptional cold spells on record – The Washington Post
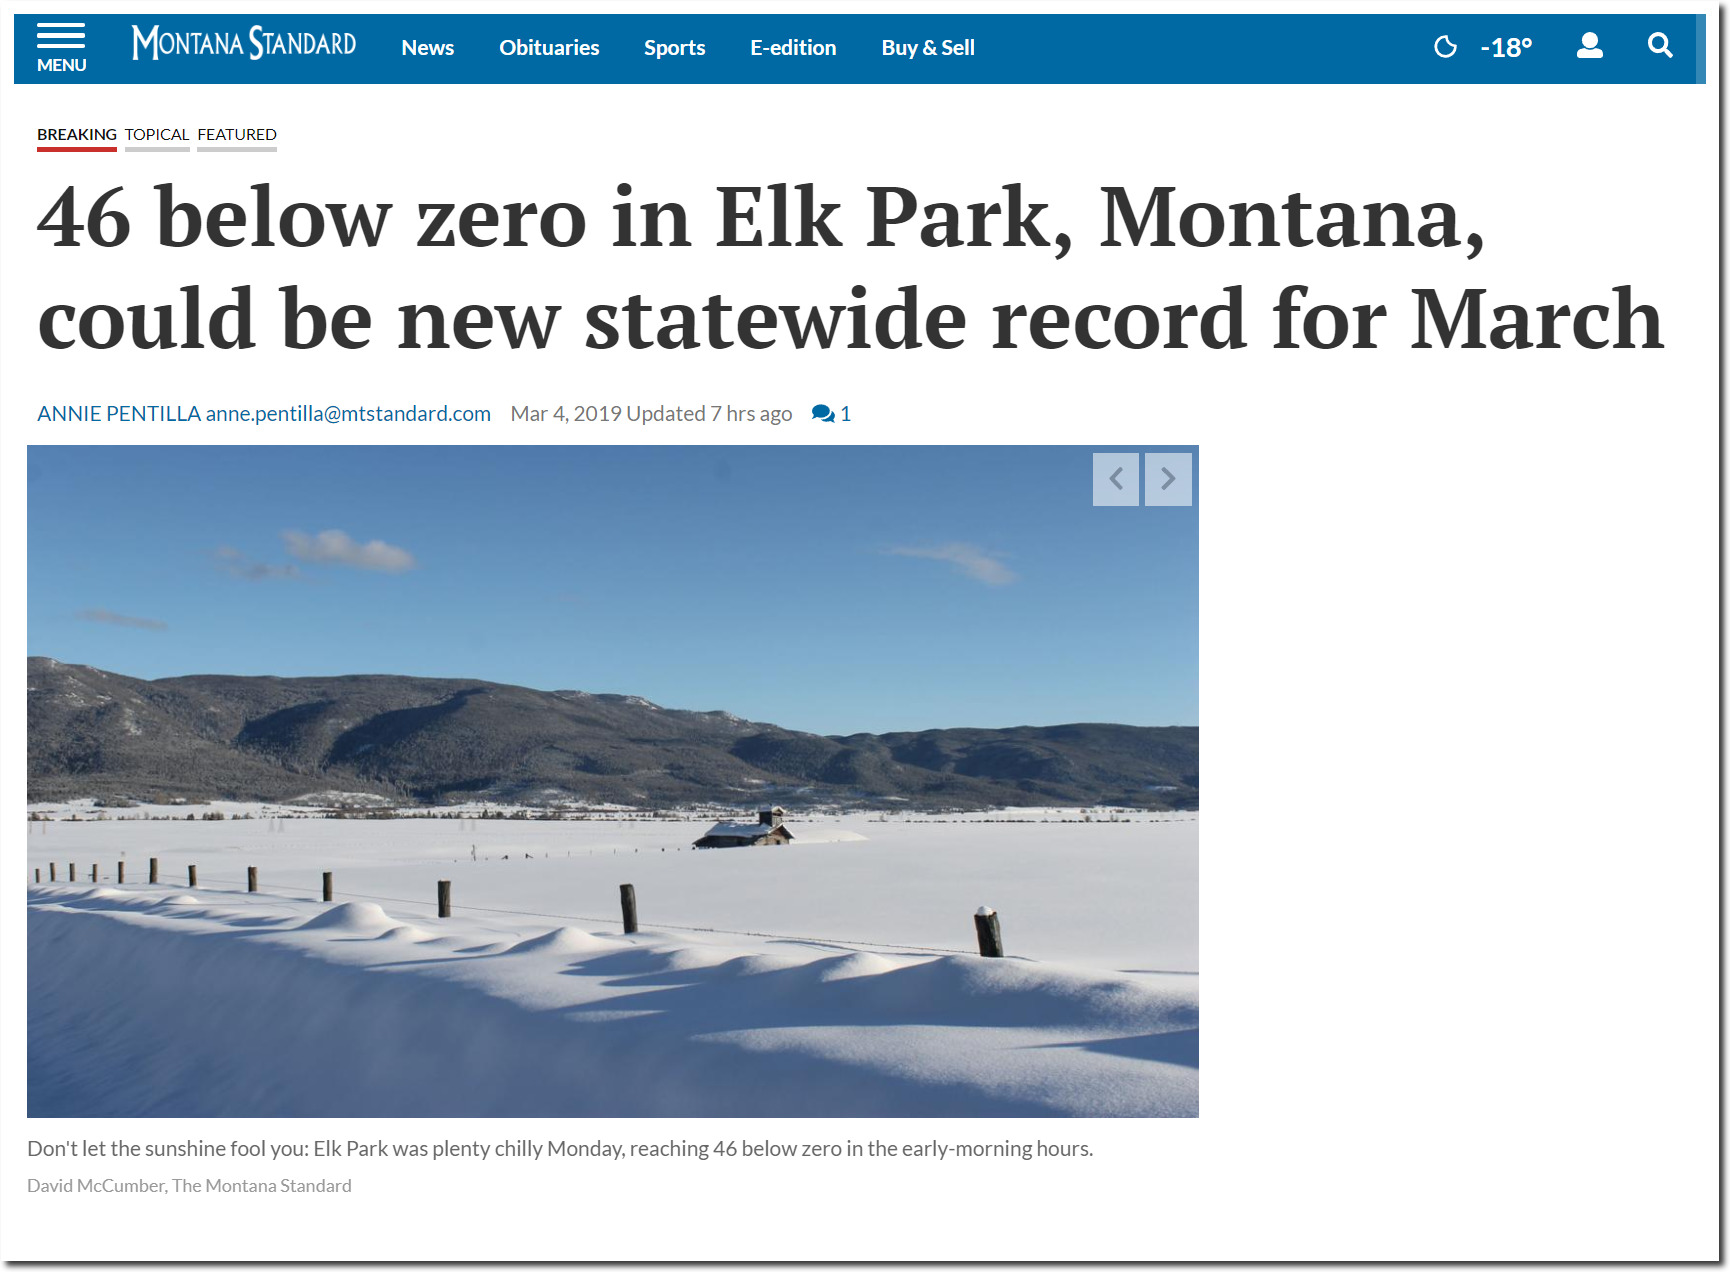
46 below zero in Elk Park, Montana, could be new statewide record for March | Local | mtstandard.com

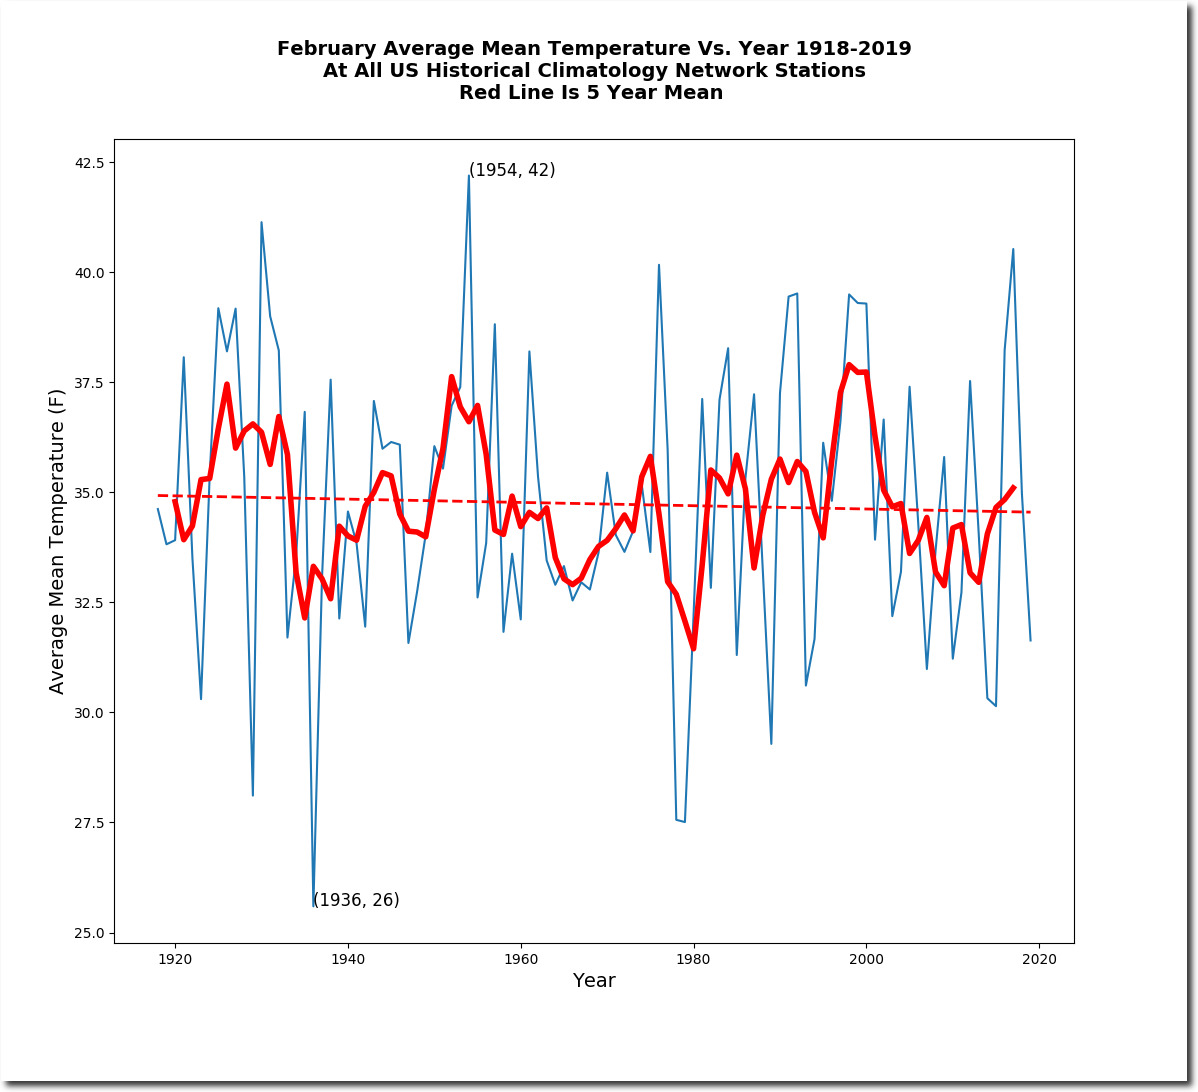
US February temperatures were well below normal, and about 10F cooler than February 1954.
The US data is extremely important, because NOAA actually has very little historical data outside of the US, western Europe and parts of Australia..
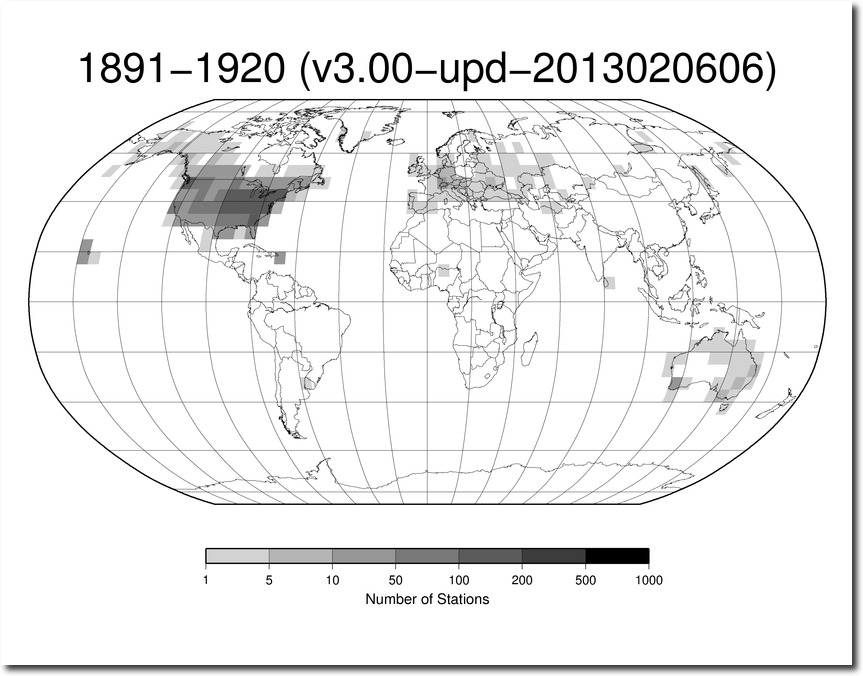
ftp://ftp.ncdc.noaa.gov/pub/data/ghcn/daily/figures/station-counts-1891-1920-temp.png

NOAA also claimed to have almost no February data for Greenland, where temperatures have been extremely cold over the past month.
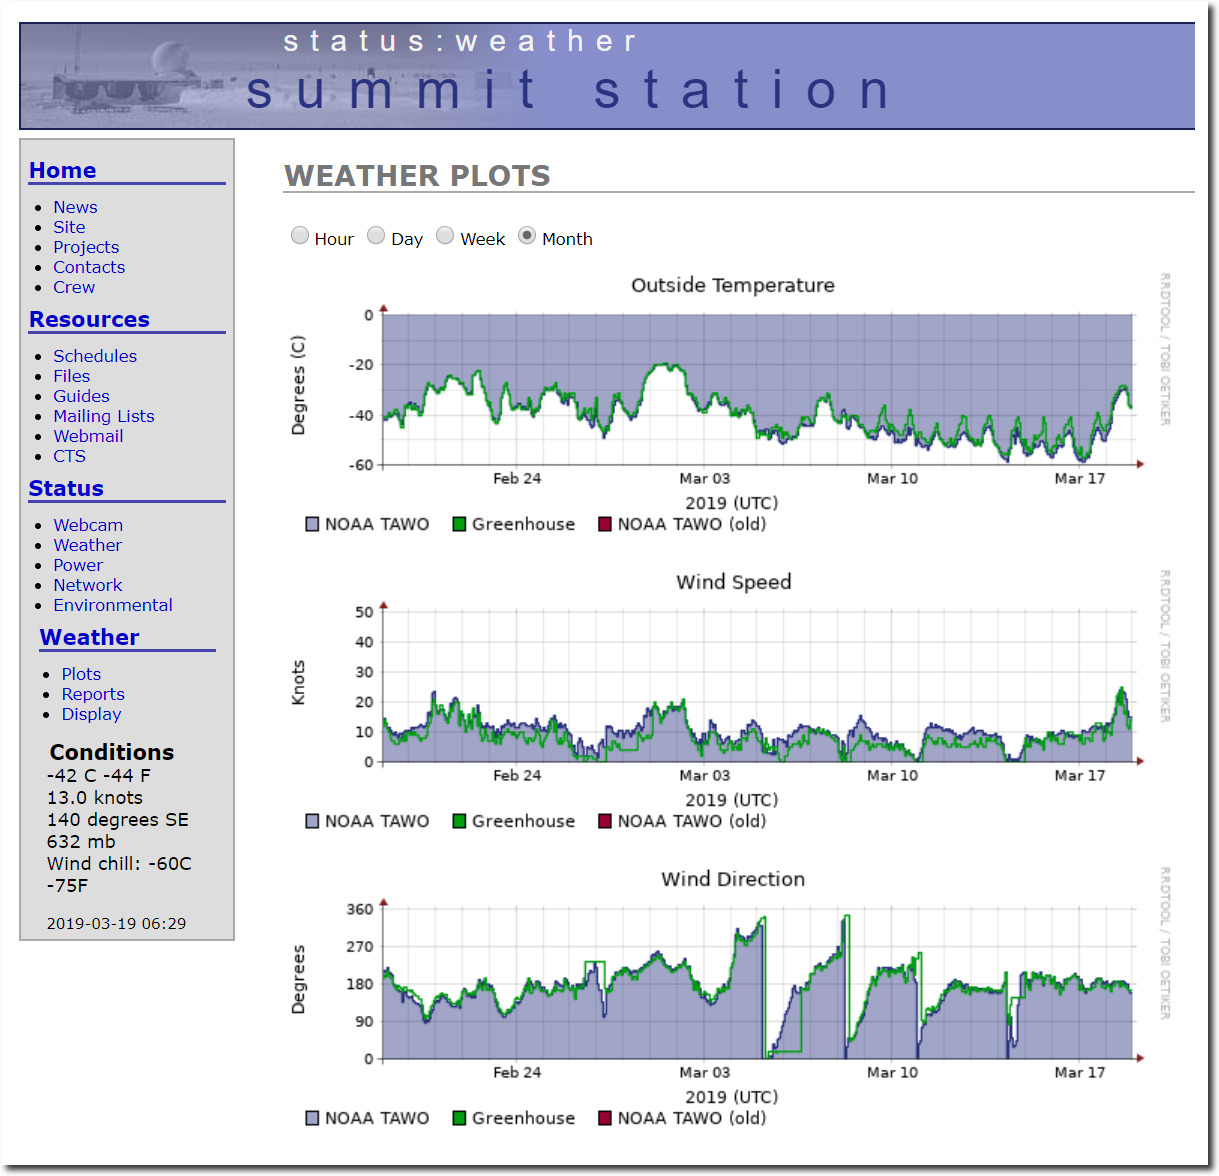
summit:status:weather

The NOAA land data is fake, and an Orwellian rewrite of record cold at spots.  But the ocean data is even faker.

the global ocean-only surface temperature was 0.70°C (1.26°F) above average and the second warmest February since global records began in 1880

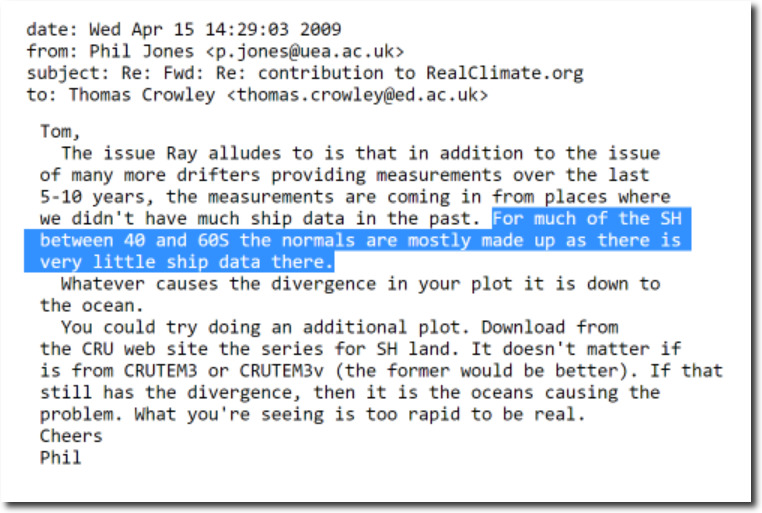
They claim to have ocean temperature records back to 1880 – which is patently false.  Prior to about 15 years ago, no one even pretended to have pre-1950 global ocean data. And as Phil Jones at CRU said, much of the data they are using is “made up.”

For much of the SH between 40 and 60S the normals are mostly made up as there is very little ship data there.
di2.nu/foia/foia2011/mail/2729.txt

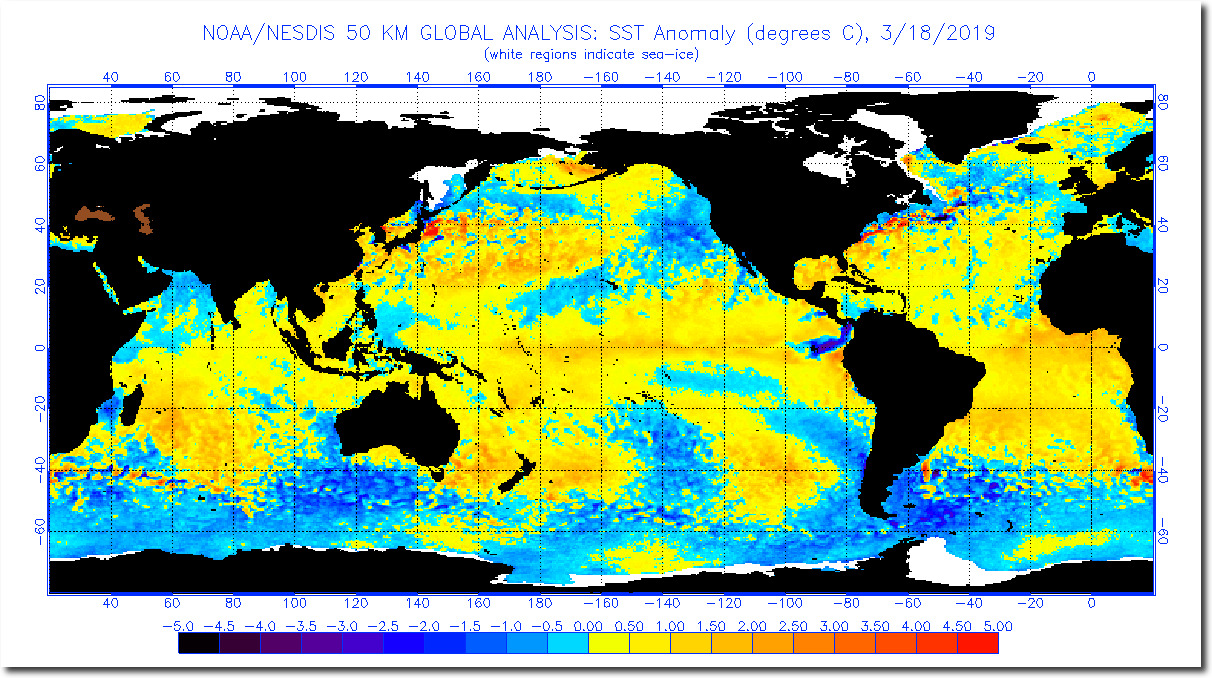
Sea surface temperatures are well below normal in much of the southern hemisphere.
anomnight.3.18.2019.gif (1174×640)

The animation below flashes between the NOAA temperature departure map and the temperature percentile map.  You can see how blues disappear, and pink turns to red.
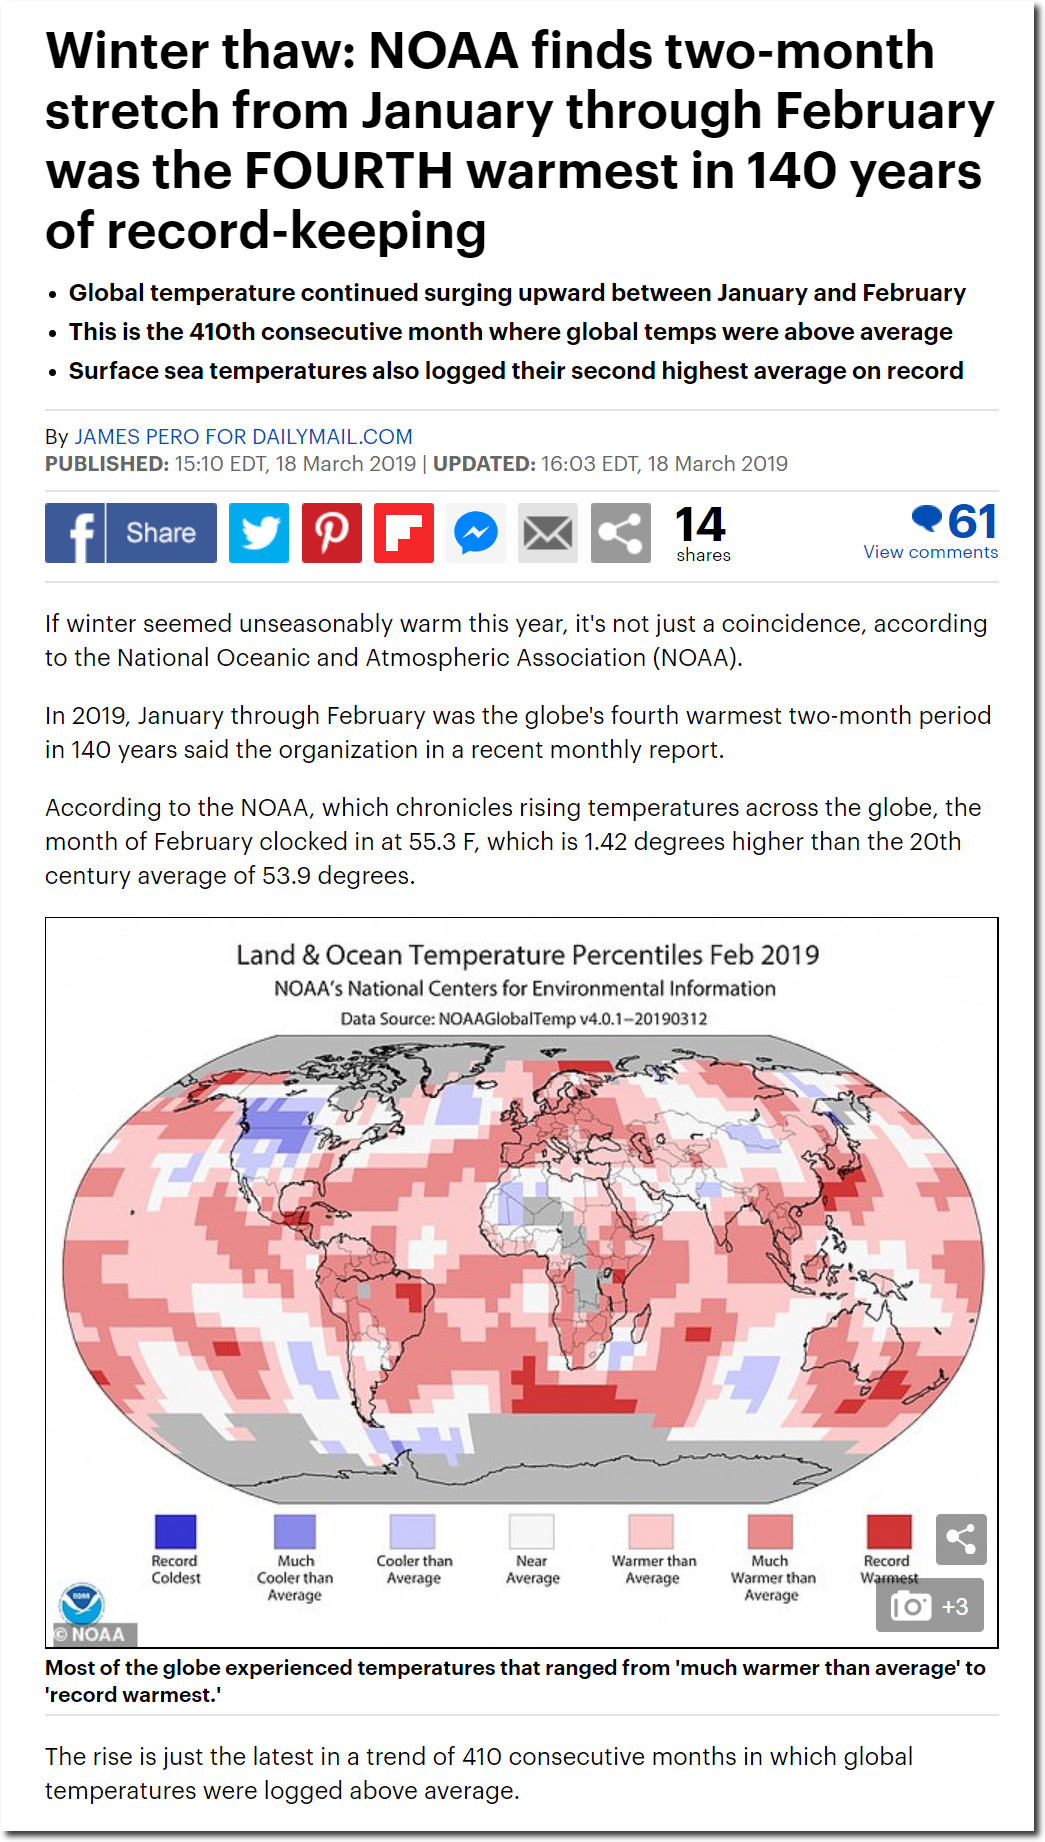
The next step of the process is generation of propaganda like this:
NOAA finds two-month stretch from January through February was FOURTH warmest in 140 years | Daily Mail Online

Arctic sea ice extent is very close to the 1981-2010 median edge. Ice doesn’t lie, but government climate scientists do.
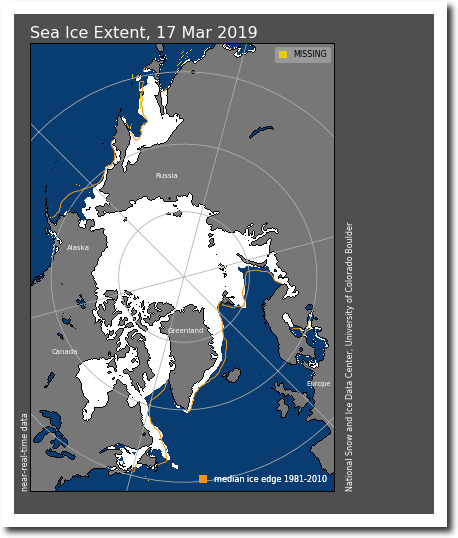
Index of /DATASETS/NOAA/G02135/north/daily/images/2019/03_Mar/

The NOAA red hot map has no basis in science, which is standard practice for climate alarmists with an agenda.

Posted in Uncategorized | Leave a comment