NOAA : “among the eight warmest Februarys on record”

NOAA says last month was “among the eight warmest Februarys on record” in much of the Earth.

According to NCEI’s Regional Analysis, South America, Europe and Oceania had a February temperature that ranked among the eight warmest Februarys on record.

There is no such word as “Februarys” – plural for February is Februaries. But besides the fact they are illiterate, they are also lying.  This is the map they use to justify their claims:
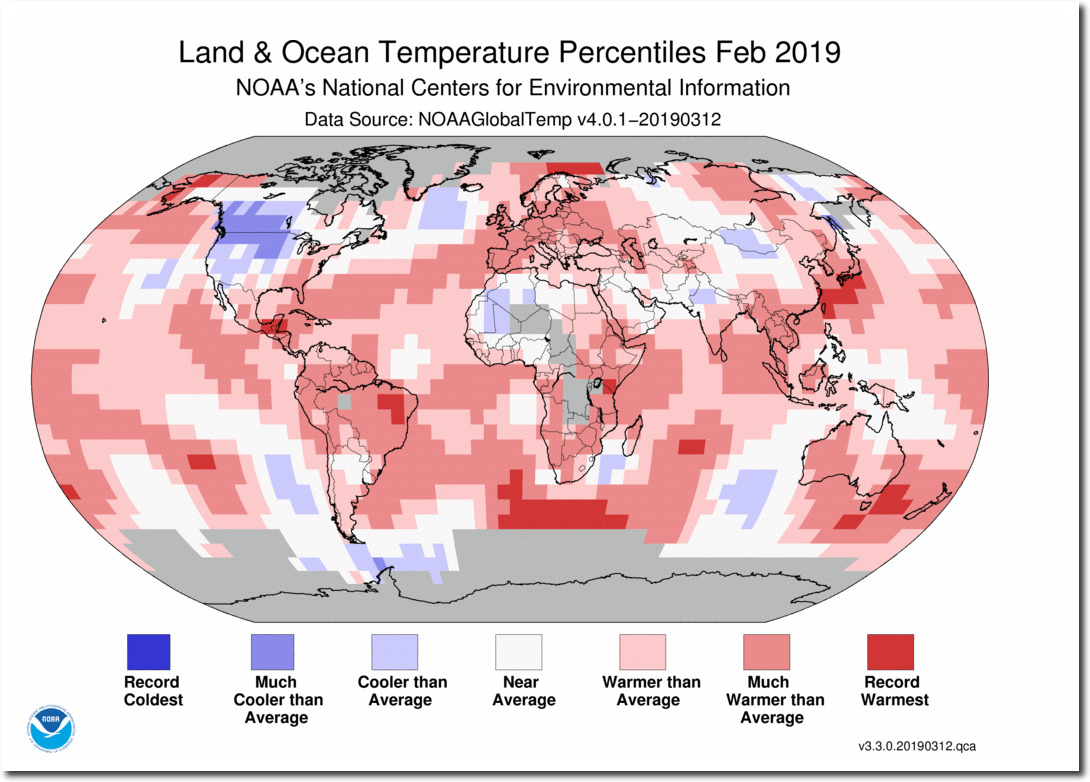
It looks like the world is burning up, with just a few slightly cool areas. It has an official government seal on it, so it must be accurate, right?

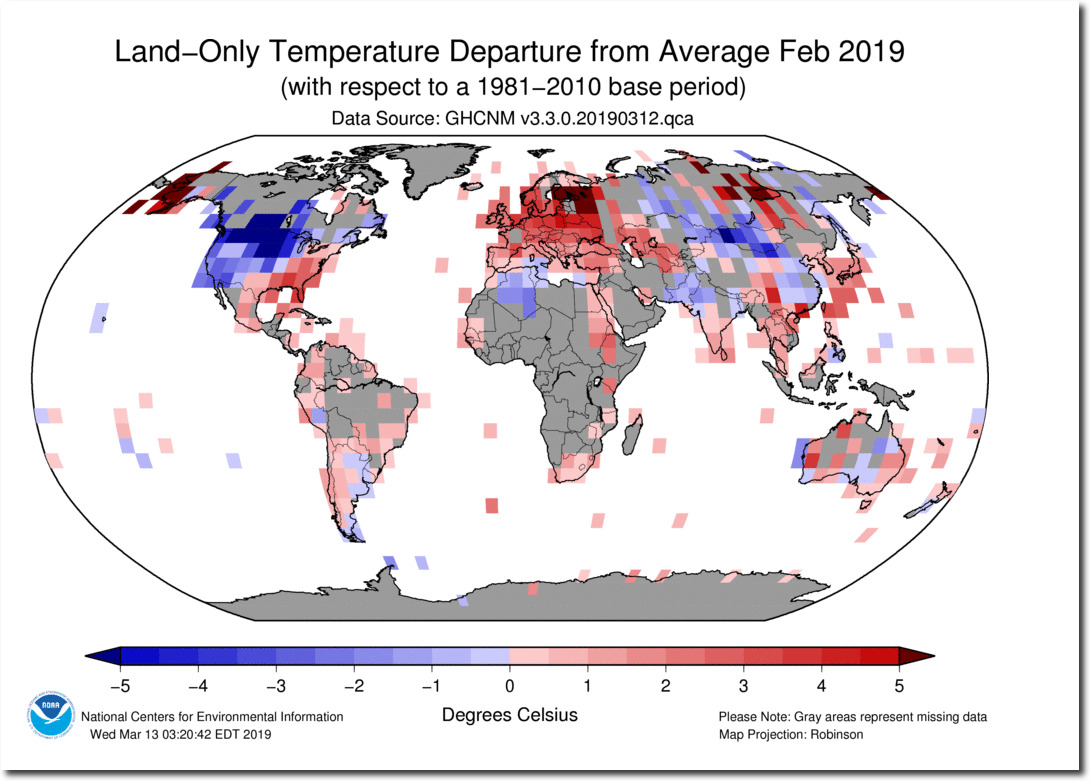
The map below shows where NOAA actually had surface temperatures in February.
201902.gif (1052×743)

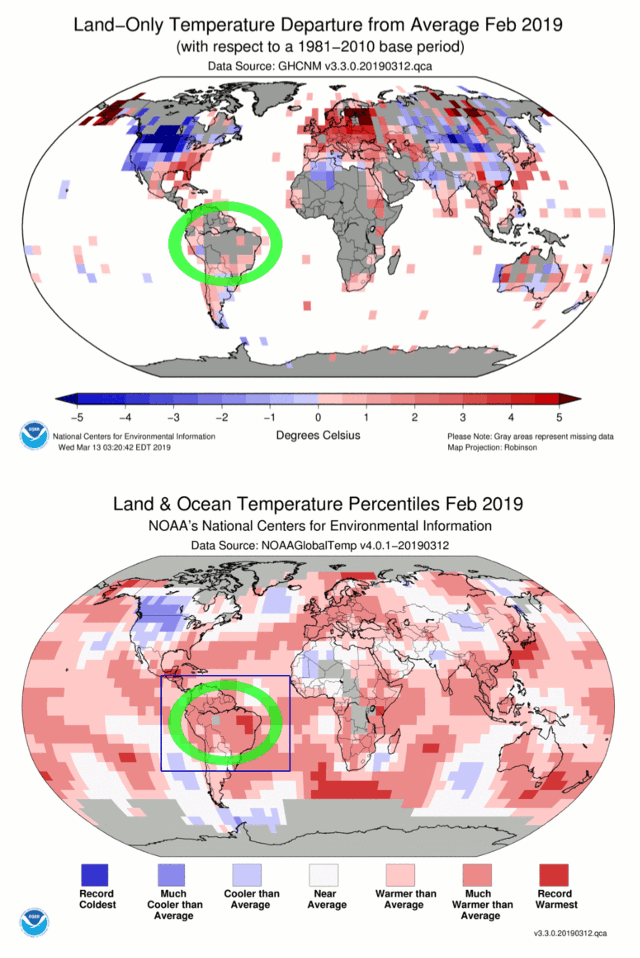
The map looks nothing like the one NOAA presents to the public.  By pixel count, 51% of the land area is gray “missing data,” 16% is below normal temperature, and 33% is above normal. The animation below shows how they created one of the eight warmest “Februarys” in South America – by simply making up data, including record warmth in Brazil in locations with no actual thermometer data.
Also note how they made the cold in Asia and parts of Australia disappear.
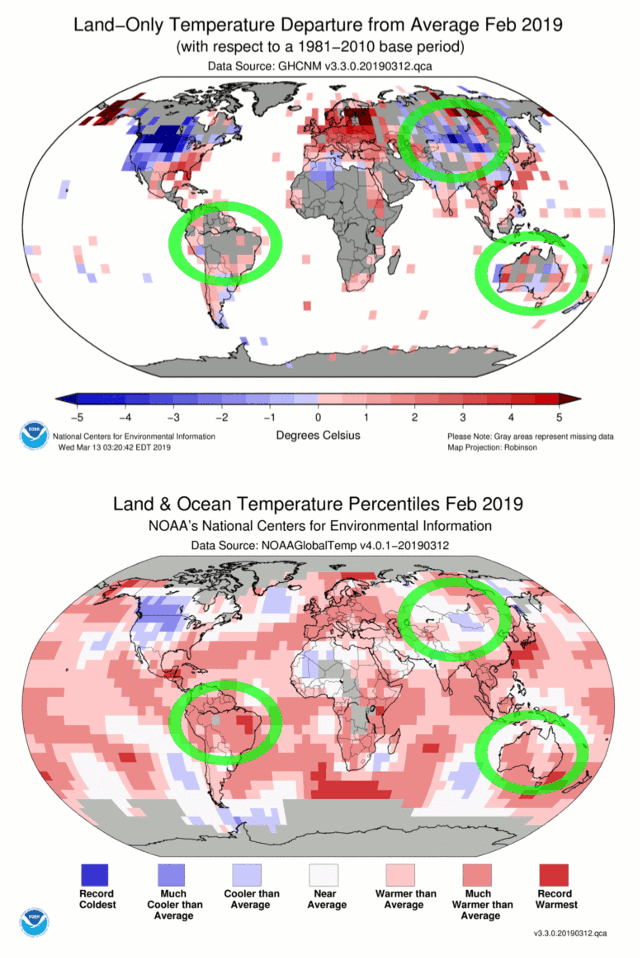
And they largely made the near record cold in much of North America disappear.
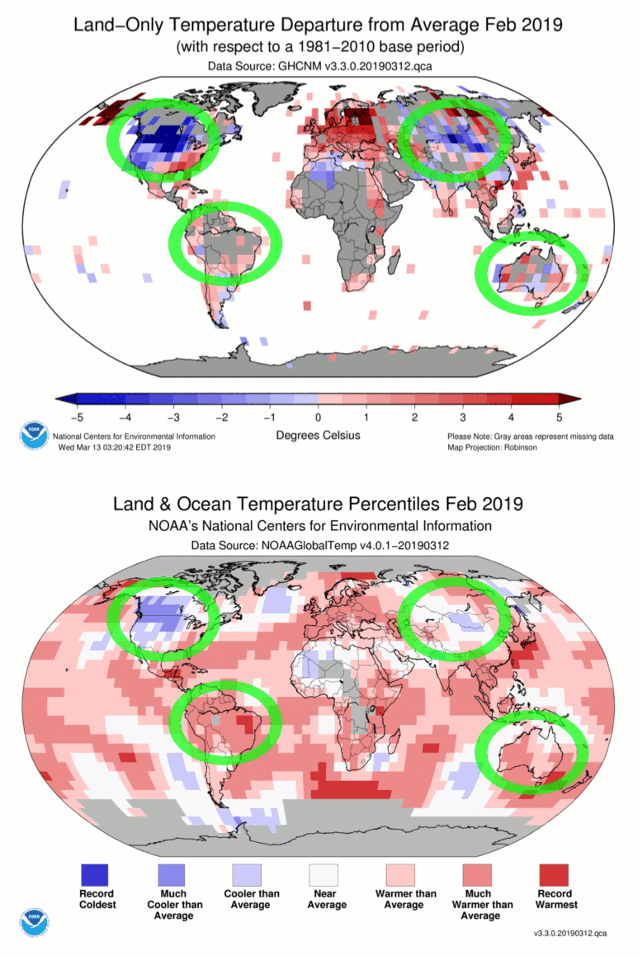
Montana and the Dakotas were 20 degrees below normal, as was much of Canada. Here is how the Washington Post described it:

The February temperature departures from normal were stunning. Several major climate locations averaged 27 to 28 degrees below normal, the most extreme departures in the Lower 48 for a full month since January 1969
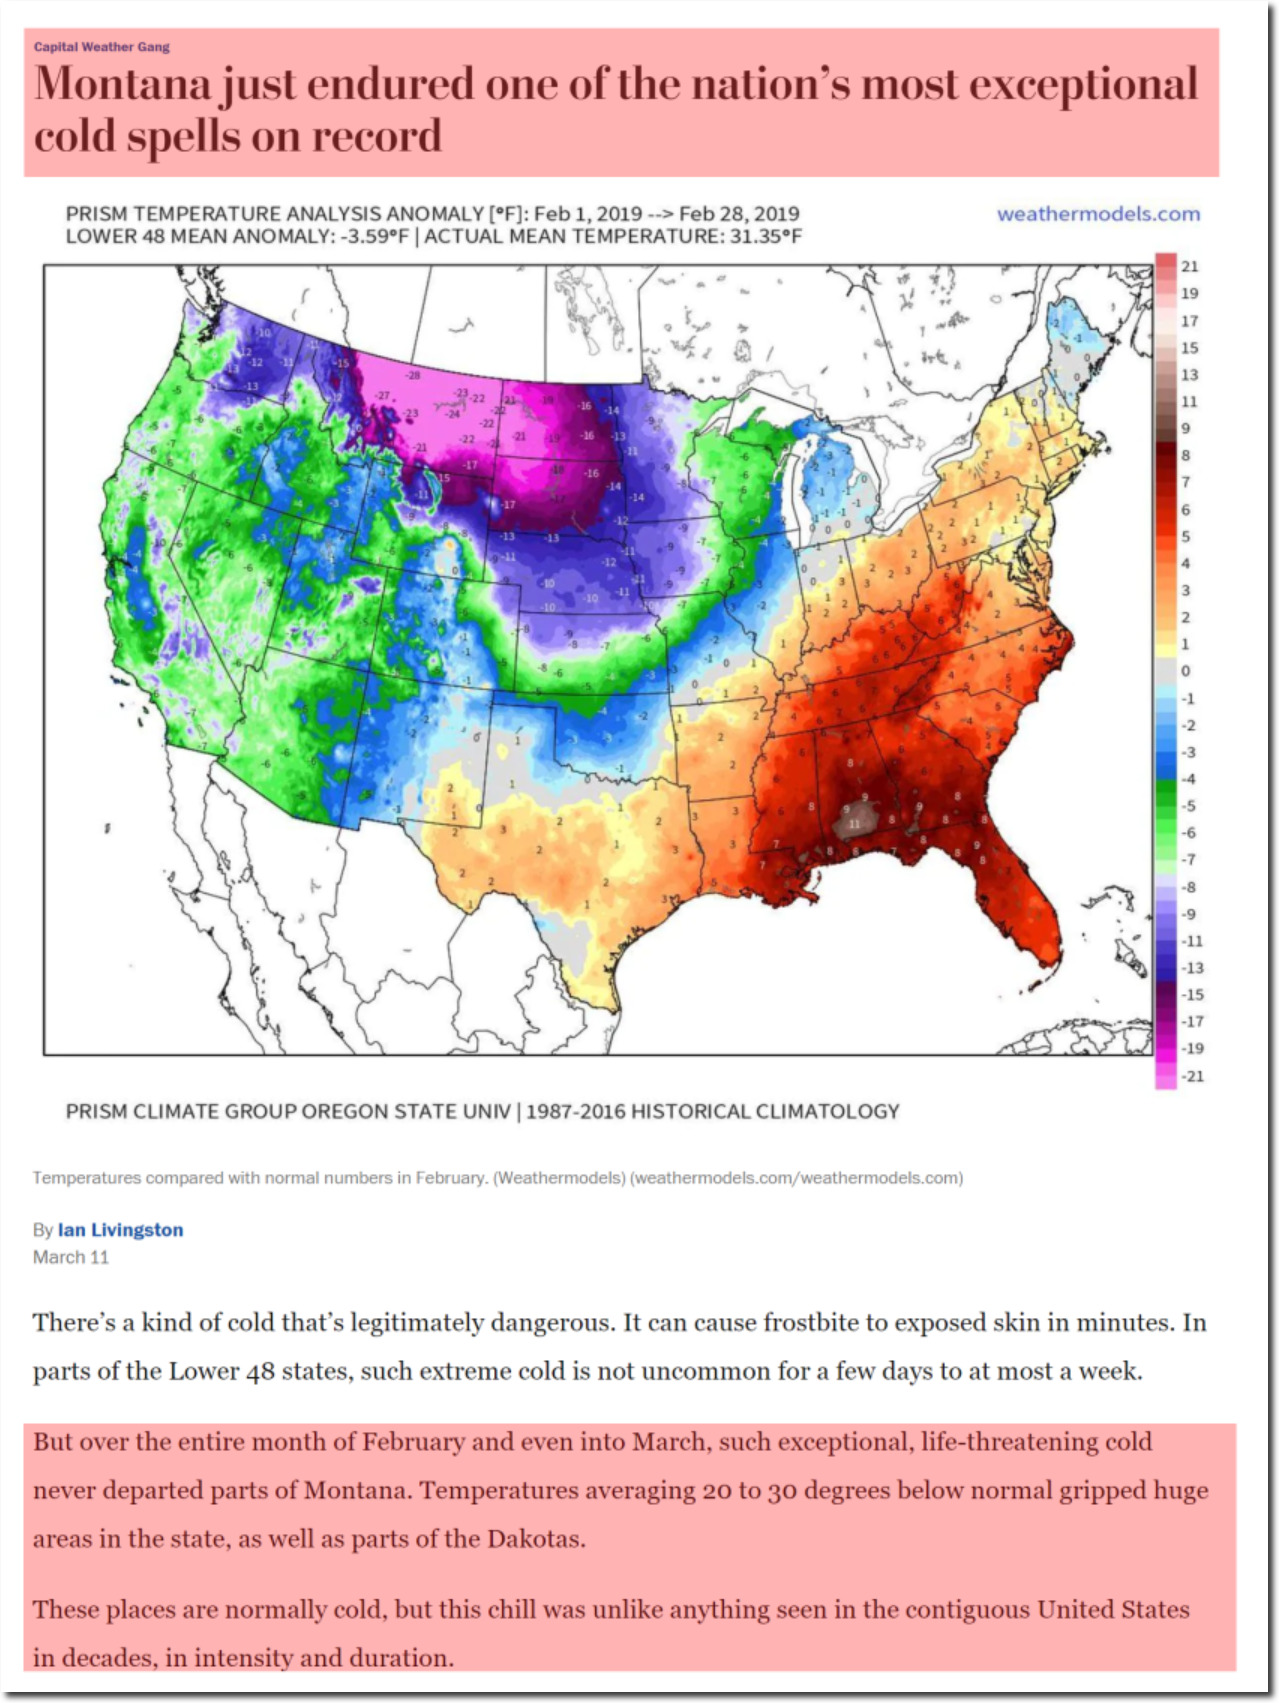
Montana just endured one of the nation’s most exceptional cold spells on record – The Washington Post

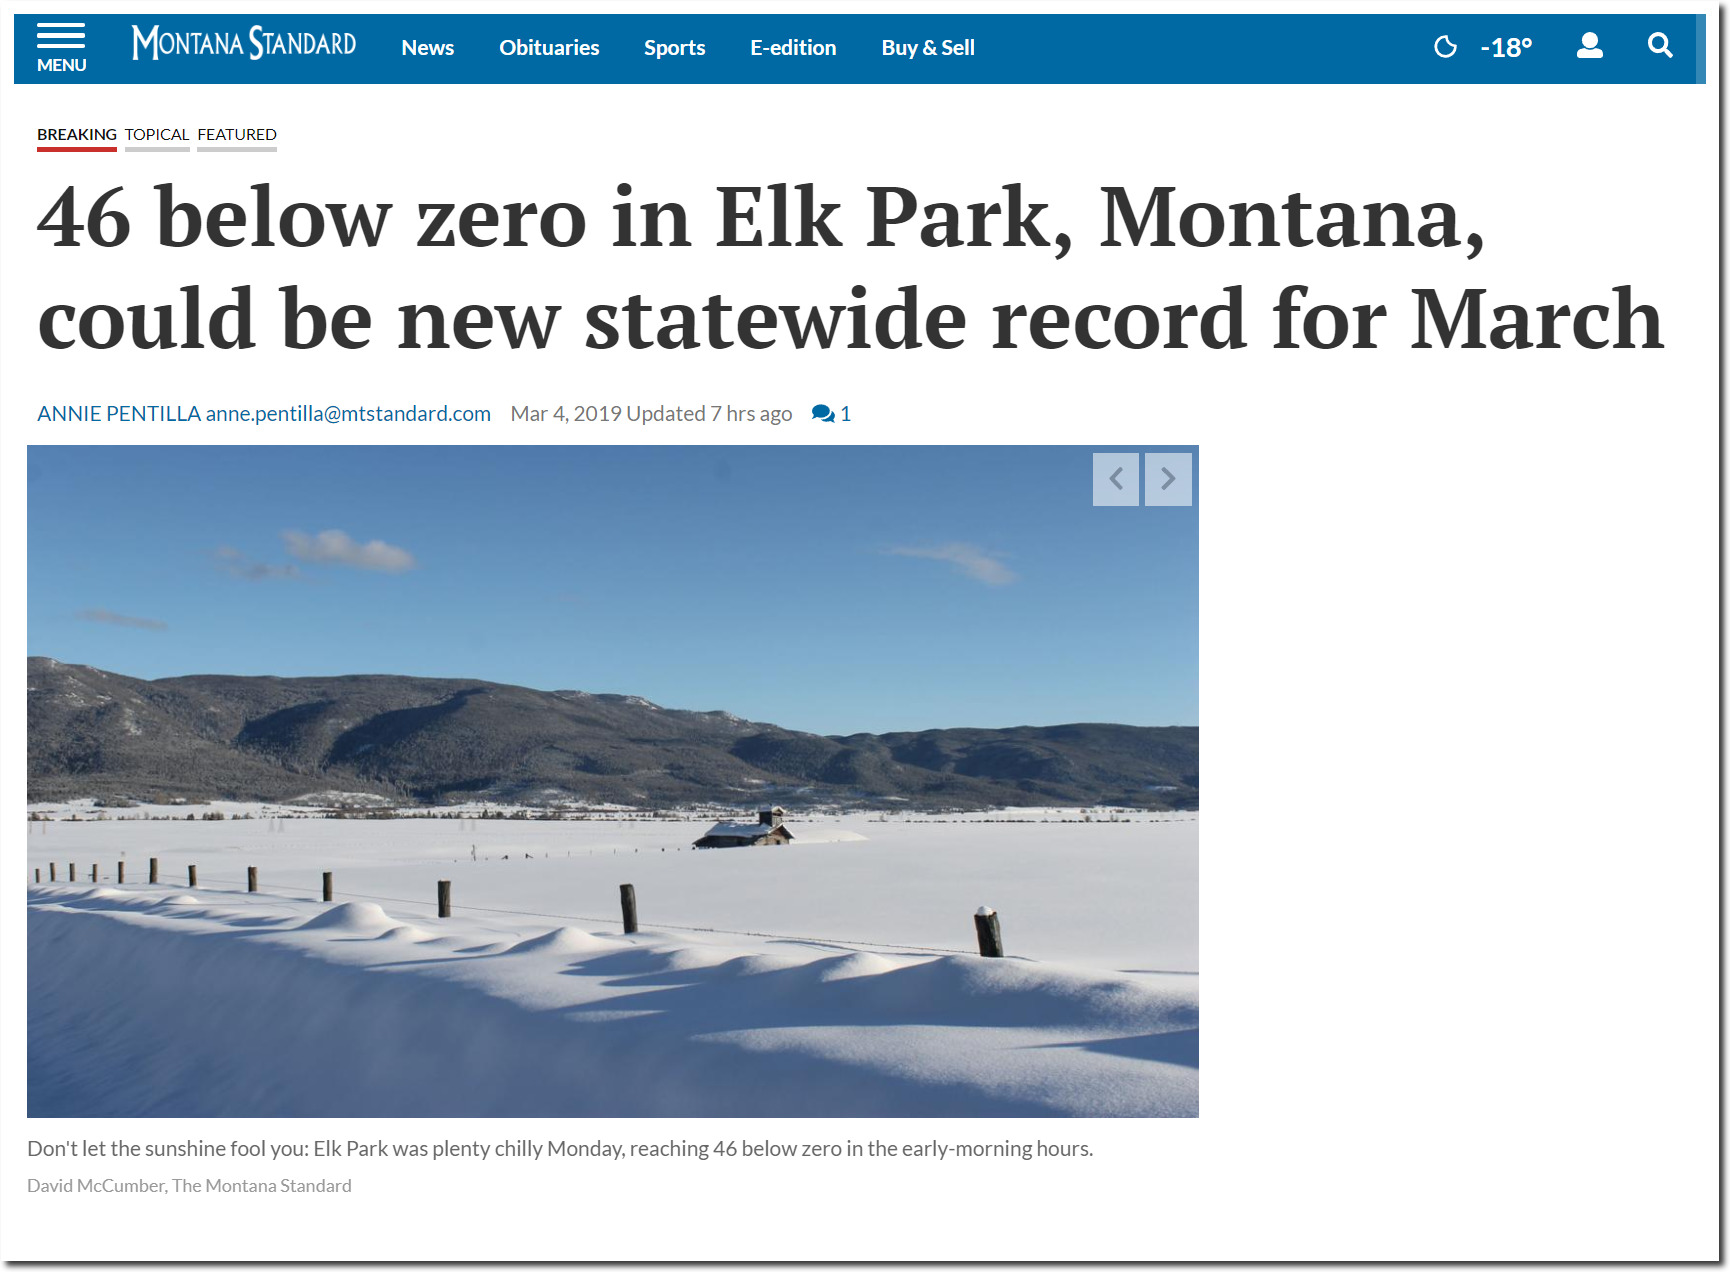
46 below zero in Elk Park, Montana, could be new statewide record for March | Local | mtstandard.com

US February temperatures were well below normal, and about 10F cooler than February 1954.
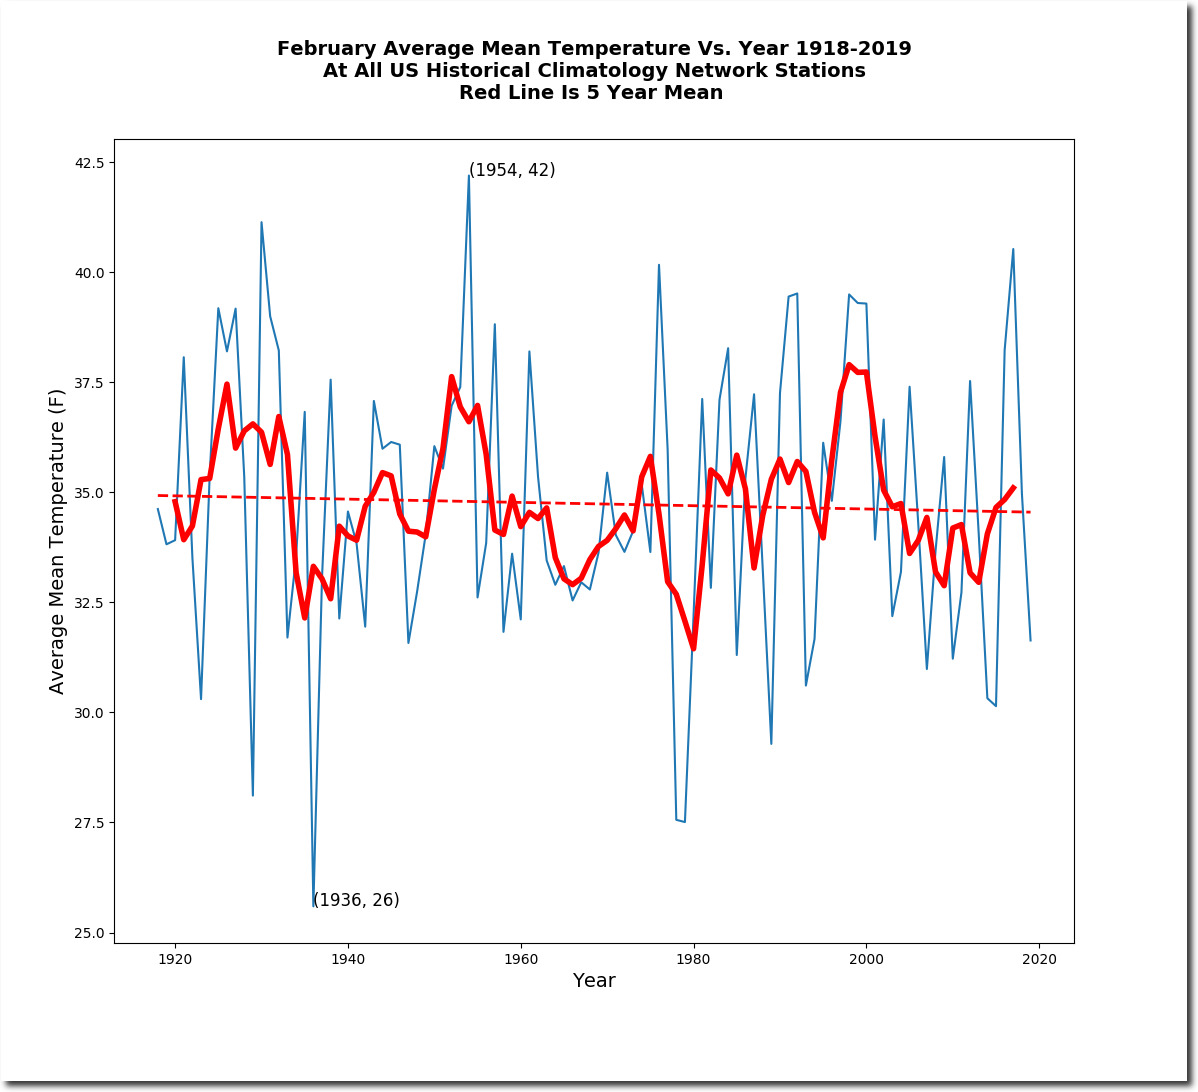
The US data is extremely important, because NOAA actually has very little historical data outside of the US, western Europe and parts of Australia..
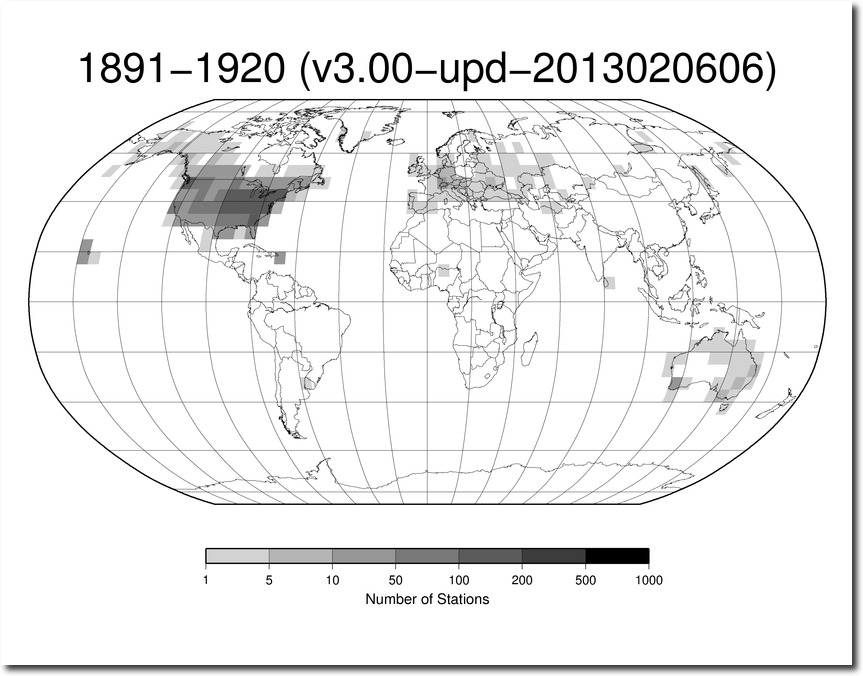
ftp://ftp.ncdc.noaa.gov/pub/data/ghcn/daily/figures/station-counts-1891-1920-temp.png

NOAA also claimed to have almost no February data for Greenland, where temperatures have been extremely cold over the past month.
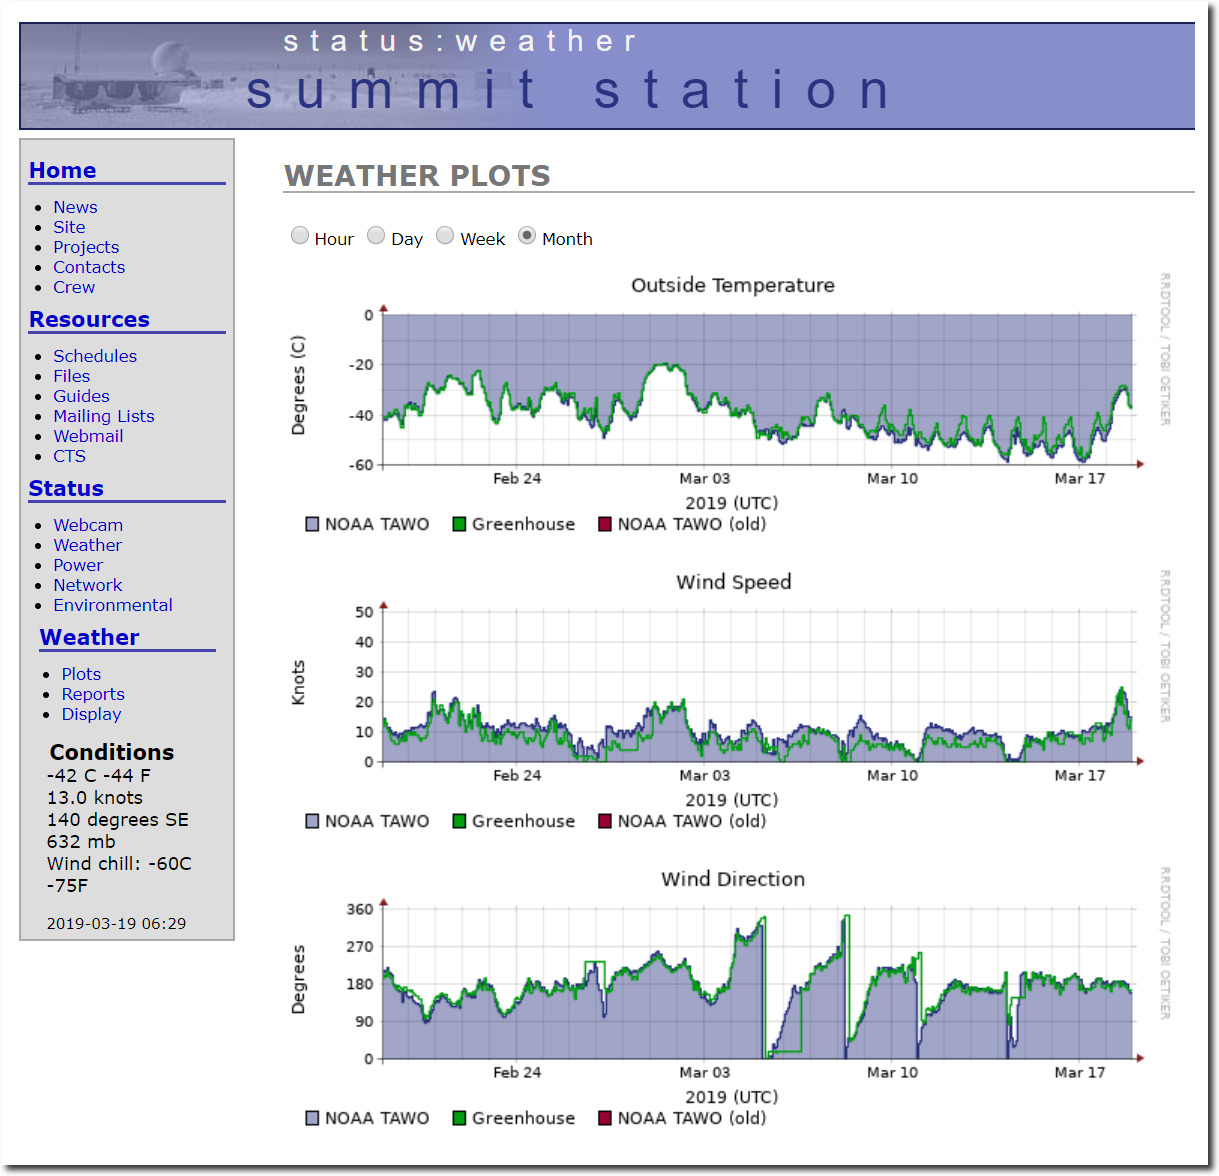
summit:status:weather

The NOAA land data is fake, and an Orwellian rewrite of record cold at spots.  But the ocean data is even faker.

the global ocean-only surface temperature was 0.70°C (1.26°F) above average and the second warmest February since global records began in 1880

They claim to have ocean temperature records back to 1880 – which is patently false.  Prior to about 15 years ago, no one even pretended to have pre-1950 global ocean data. And as Phil Jones at CRU said, much of the data they are using is “made up.”

For much of the SH between 40 and 60S the normals are mostly made up as there is very little ship data there.
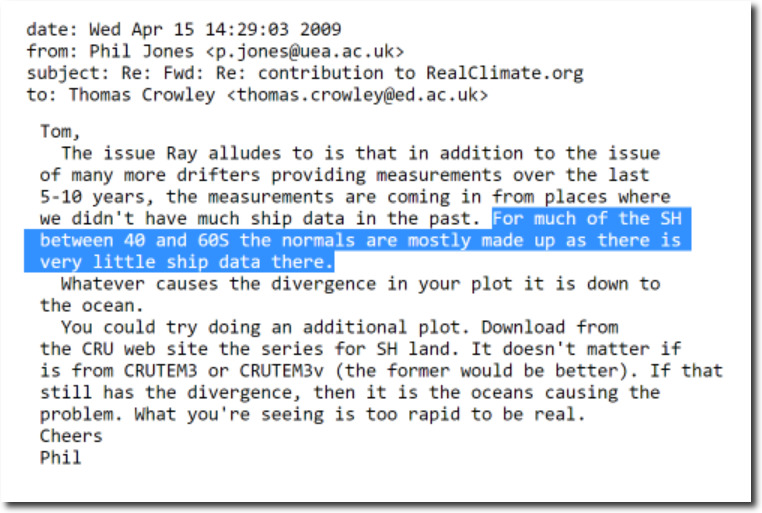
di2.nu/foia/foia2011/mail/2729.txt

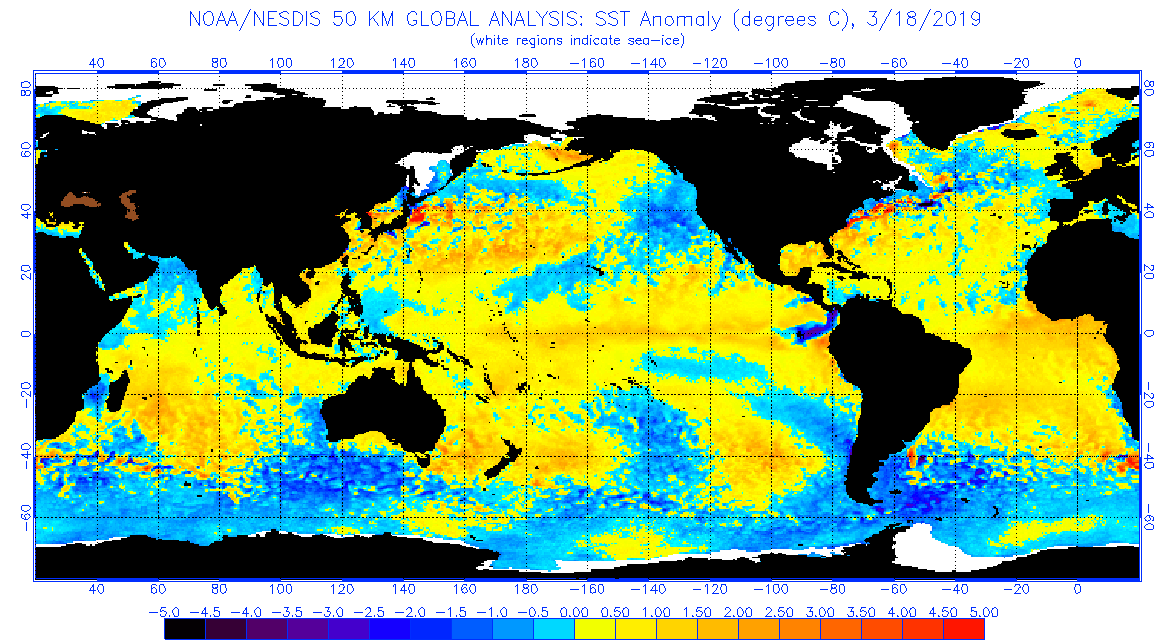
Sea surface temperatures are well below normal in much of the southern hemisphere.
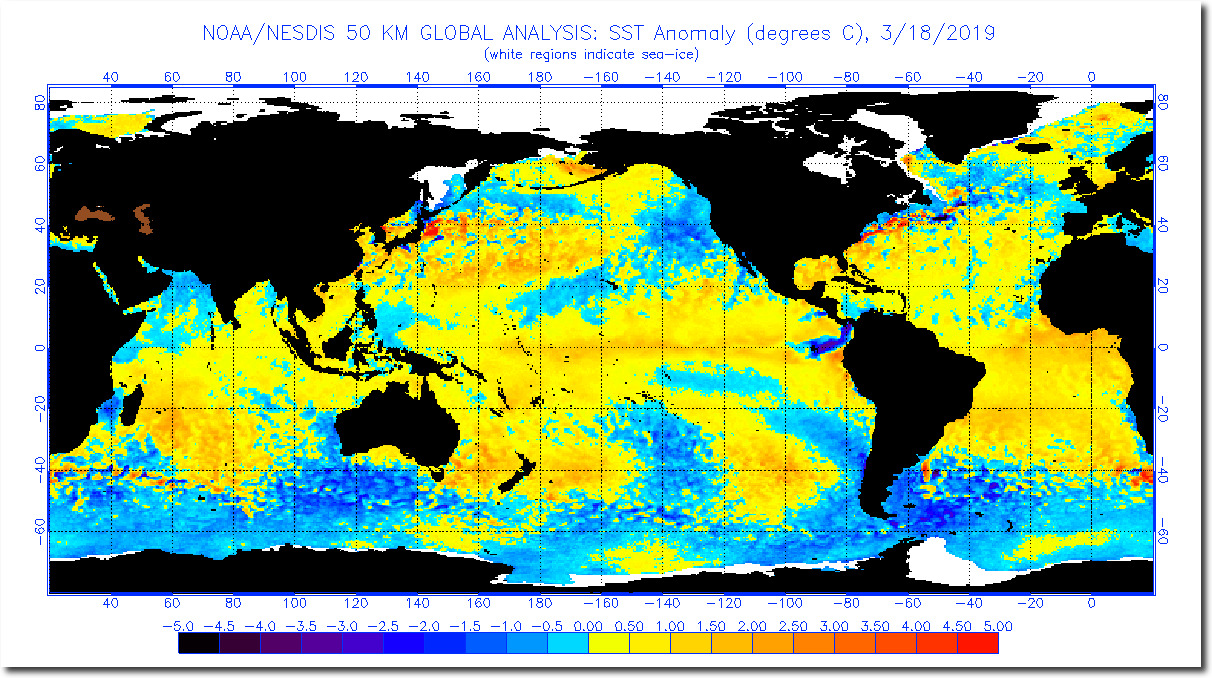
anomnight.3.18.2019.gif (1174×640)

The animation below flashes between the NOAA temperature departure map and the temperature percentile map.  You can see how blues disappear, and pink turns to red.
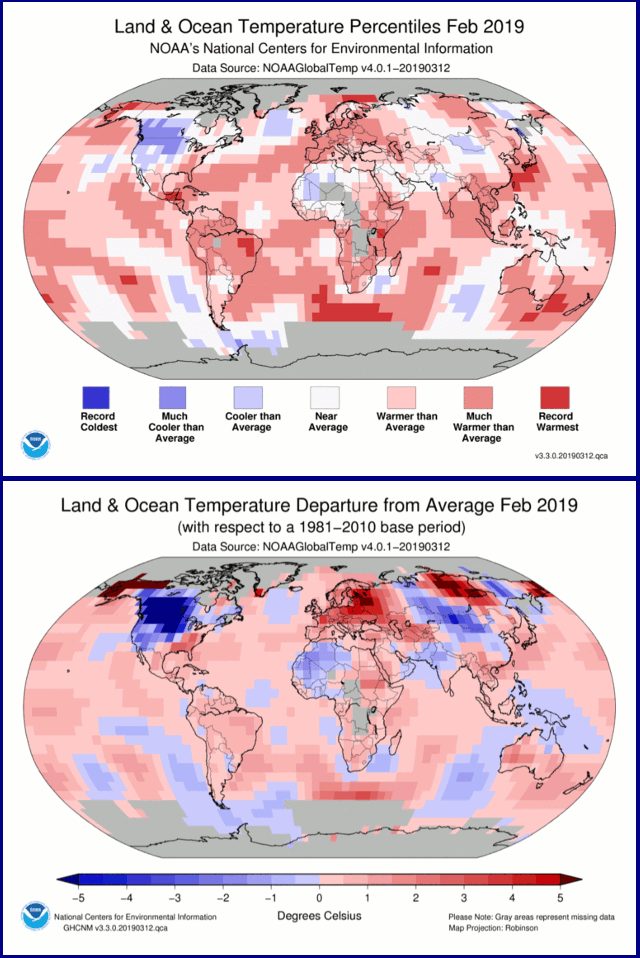
The next step of the process is generation of propaganda like this:
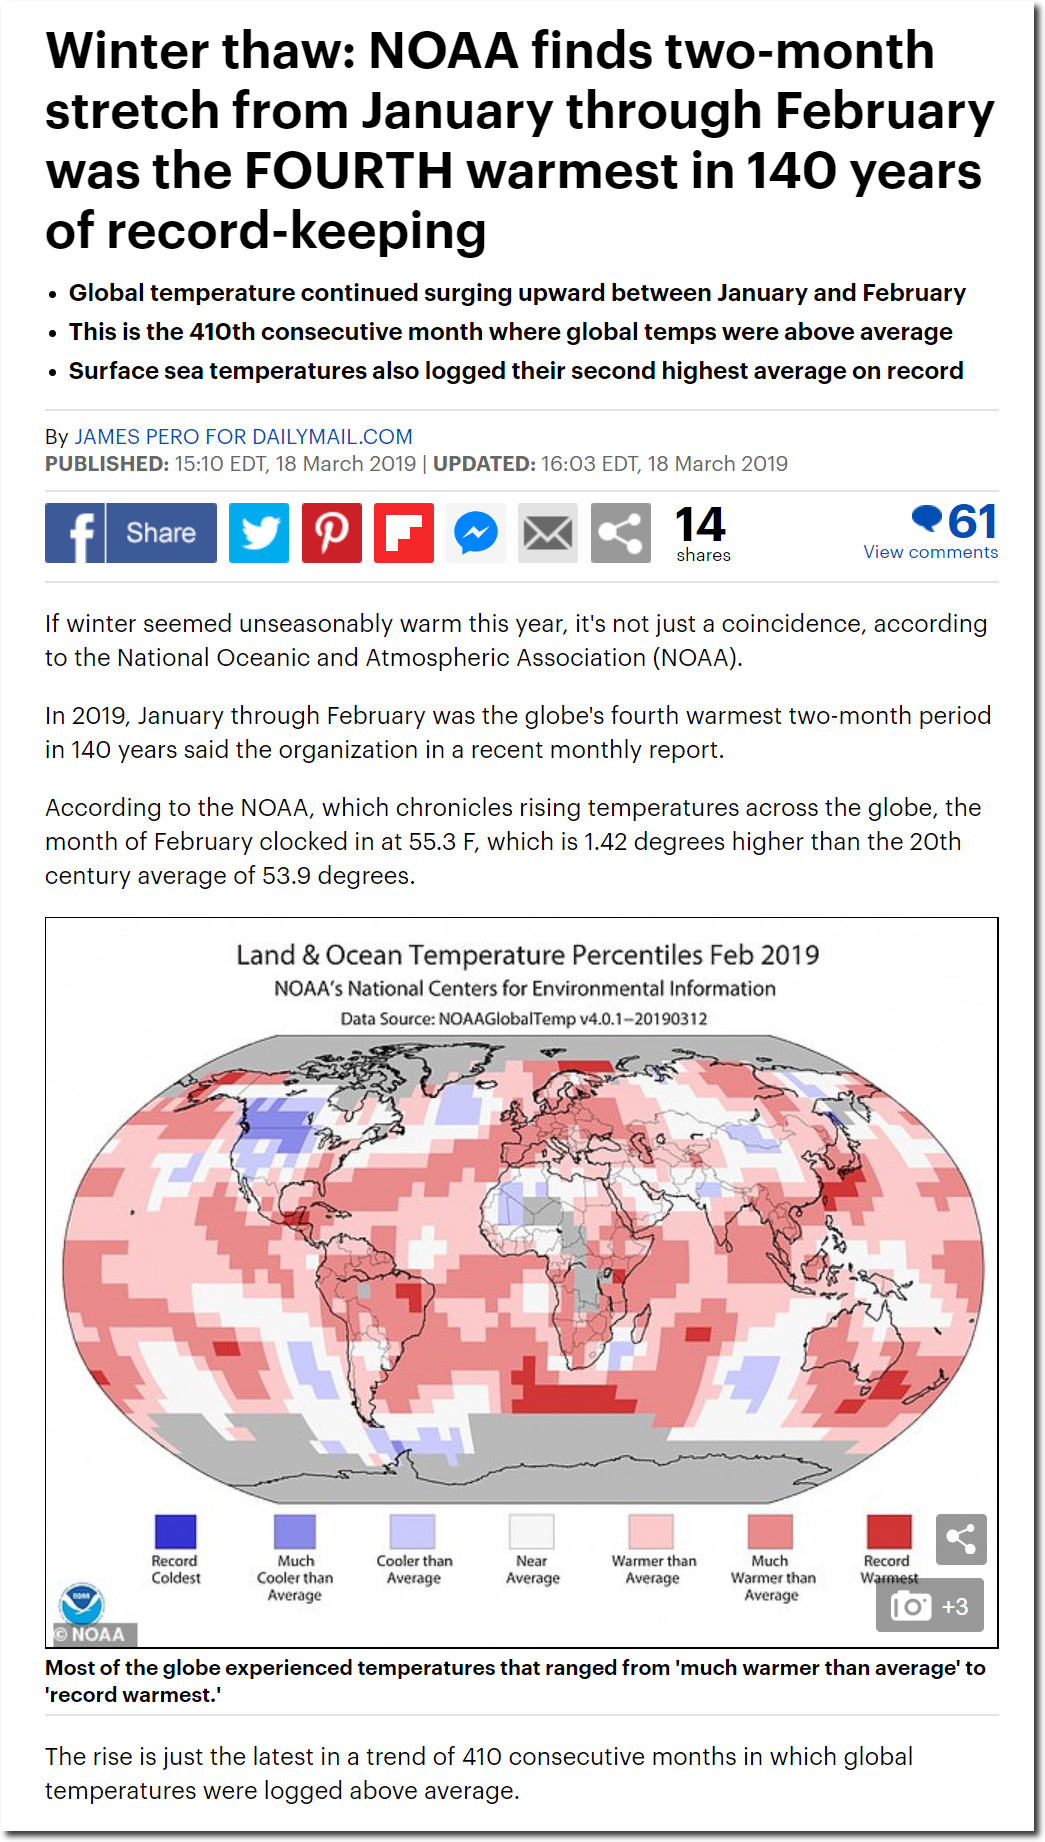
NOAA finds two-month stretch from January through February was FOURTH warmest in 140 years | Daily Mail Online

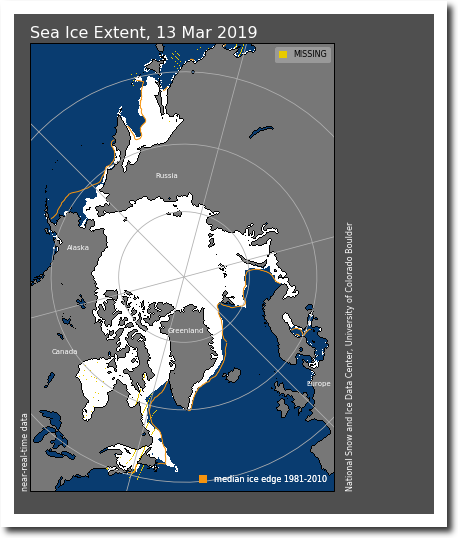
Arctic sea ice extent is very close to the 1981-2010 median edge. Ice doesn’t lie, but government climate scientists do.
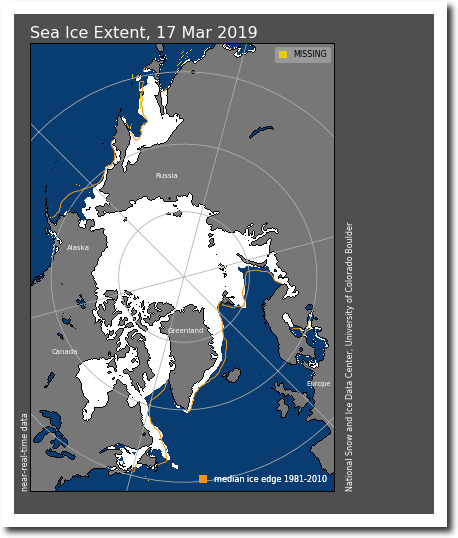
Index of /DATASETS/NOAA/G02135/north/daily/images/2019/03_Mar/

The NOAA red hot map has no basis in science, which is standard practice for climate alarmists with an agenda.

Posted in Uncategorized | Leave a comment

March 18 Low CO2 Tornadoes

March 18 has been a bad day for tornadoes.  An 1899 storm wiped out several towns in the south.


19 Mar 1899, 1 – The Anaconda Standard at Newspapers.com


The worst tornado in US history occurred on this date in 1925.

19 Mar 1925, Page 1 – Palladium-Item at Newspapers.com

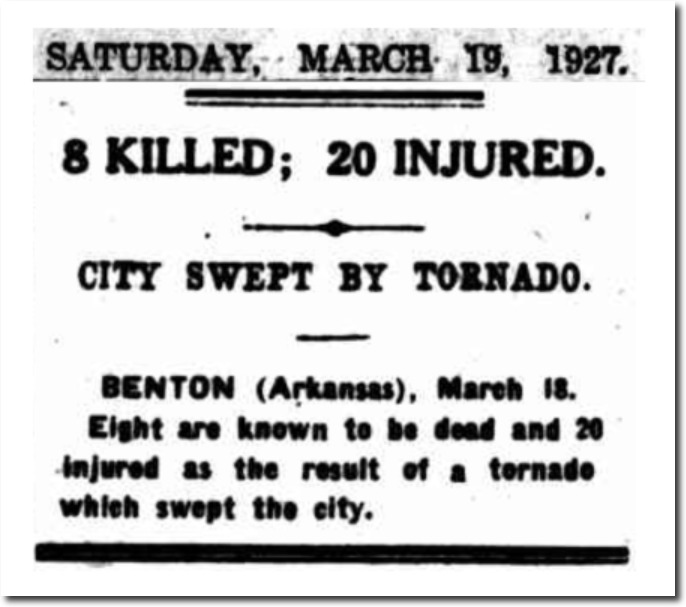
Two years later, another very bad tornado hit Arkansas on this date.

19 Mar 1927 – 8 KILLED; 20 INJURED. – Trove

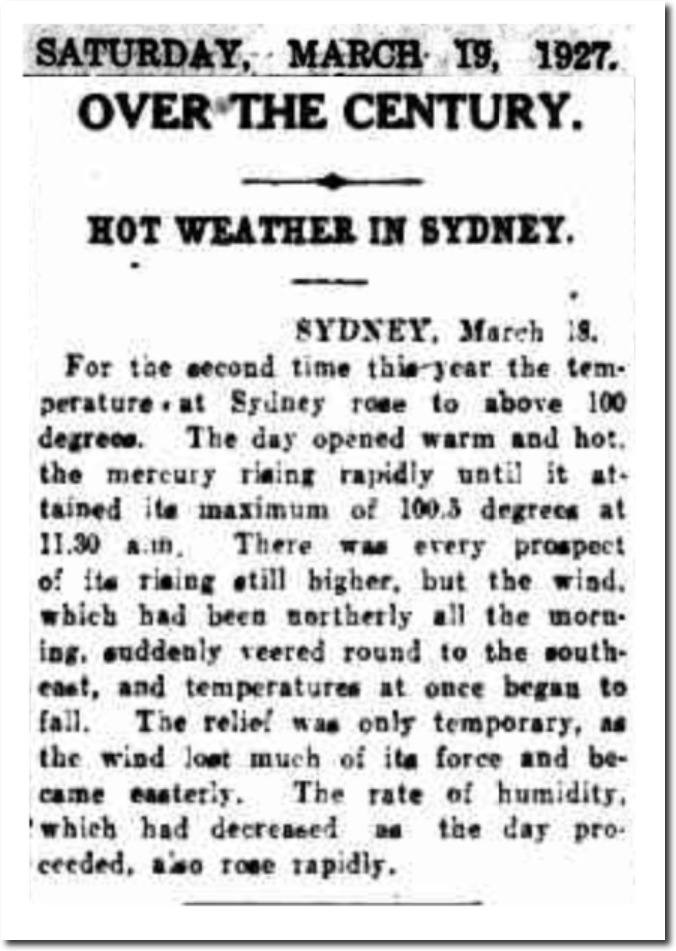
It was over 100 degrees in Sydney that day, about 30 degrees warmer than today.

19 Mar 1927 – OVER THE CENTURY. – Trove

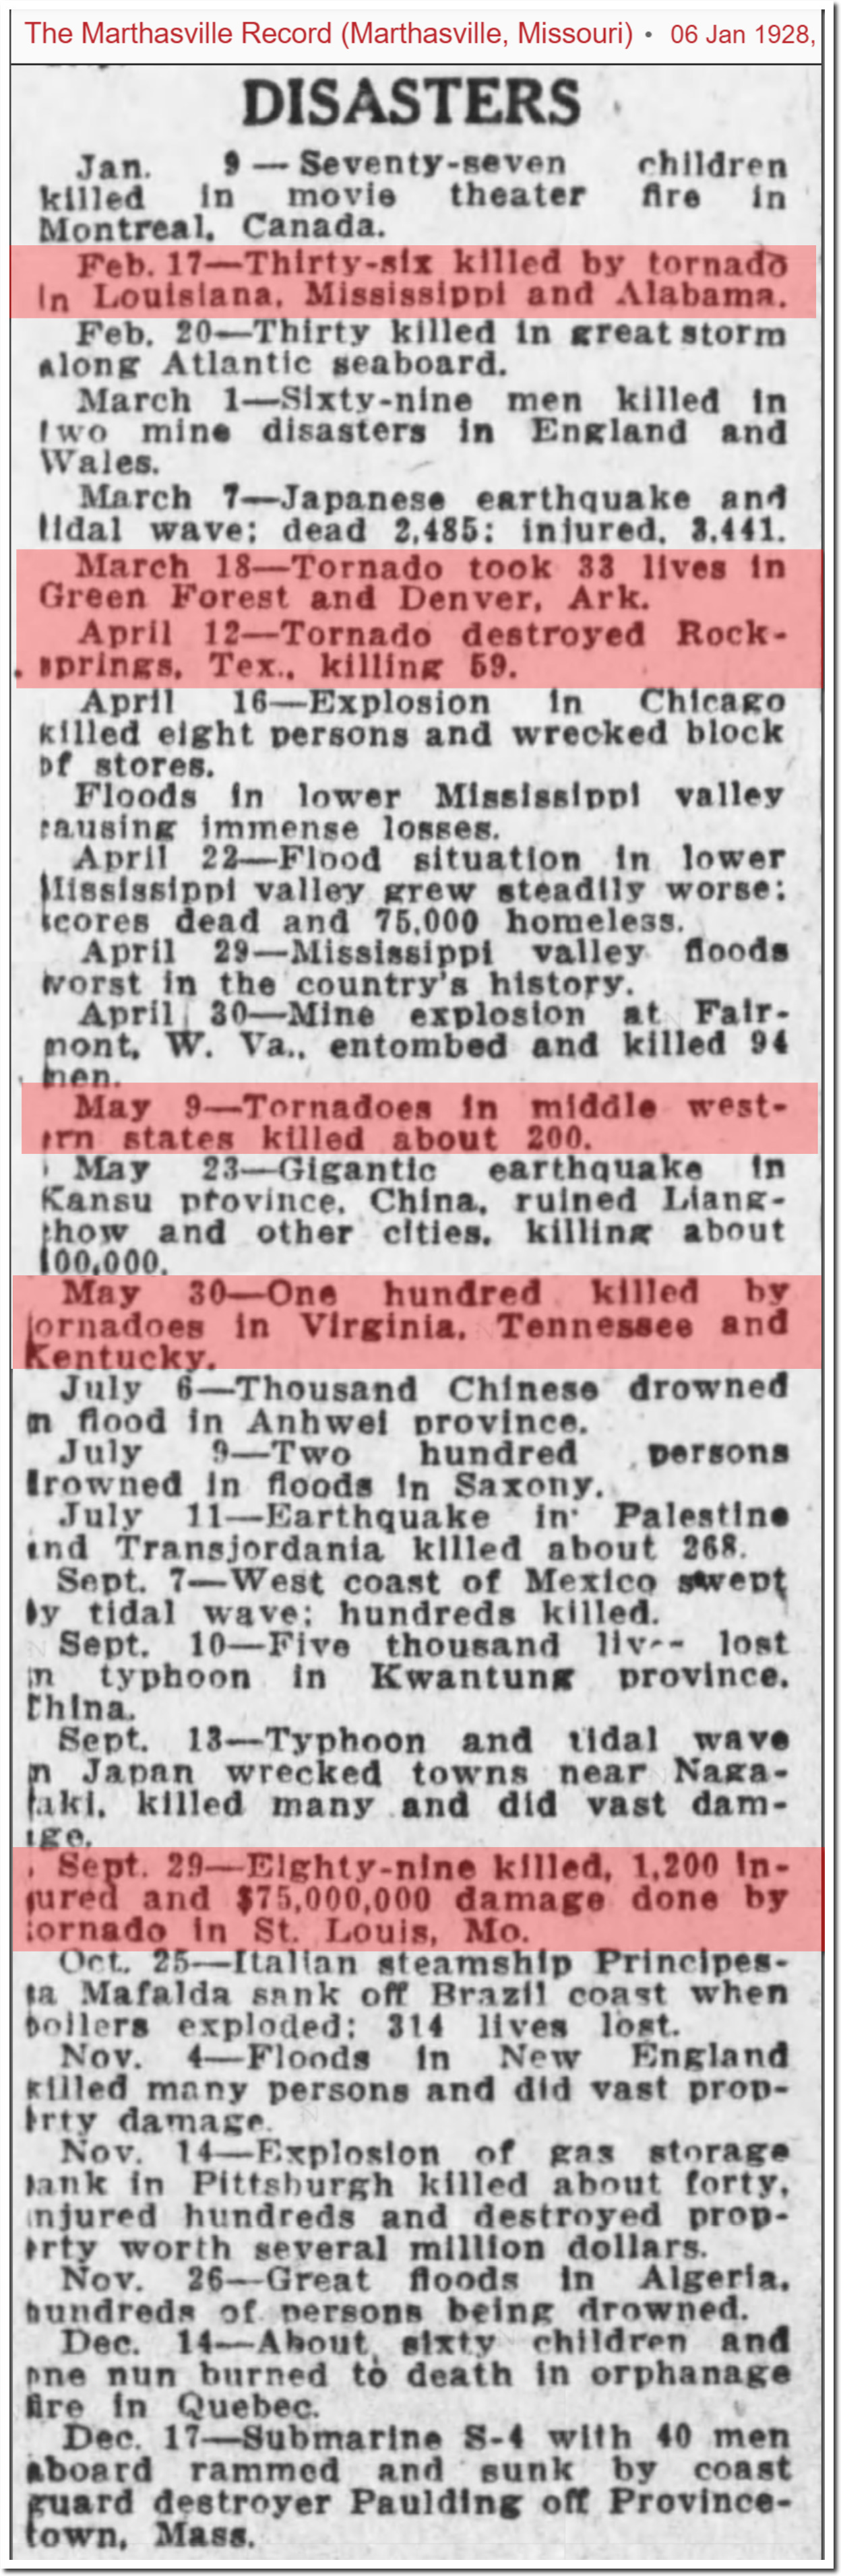
The March 18, 1927 tornado was one of five major tornado outbreaks that year, which killed hundreds of people.

06 Jan 1928, Page 4 – The Marthasville Record at Newspapers.com

The Red Cross described 1927 as the worst year in history, with 111 disasters – including 29 tornadoes, 24 floods, 9 hurricanes and 23 fires.

25 Nov 1927, Page 7 – The News-Review at Newspapers.com

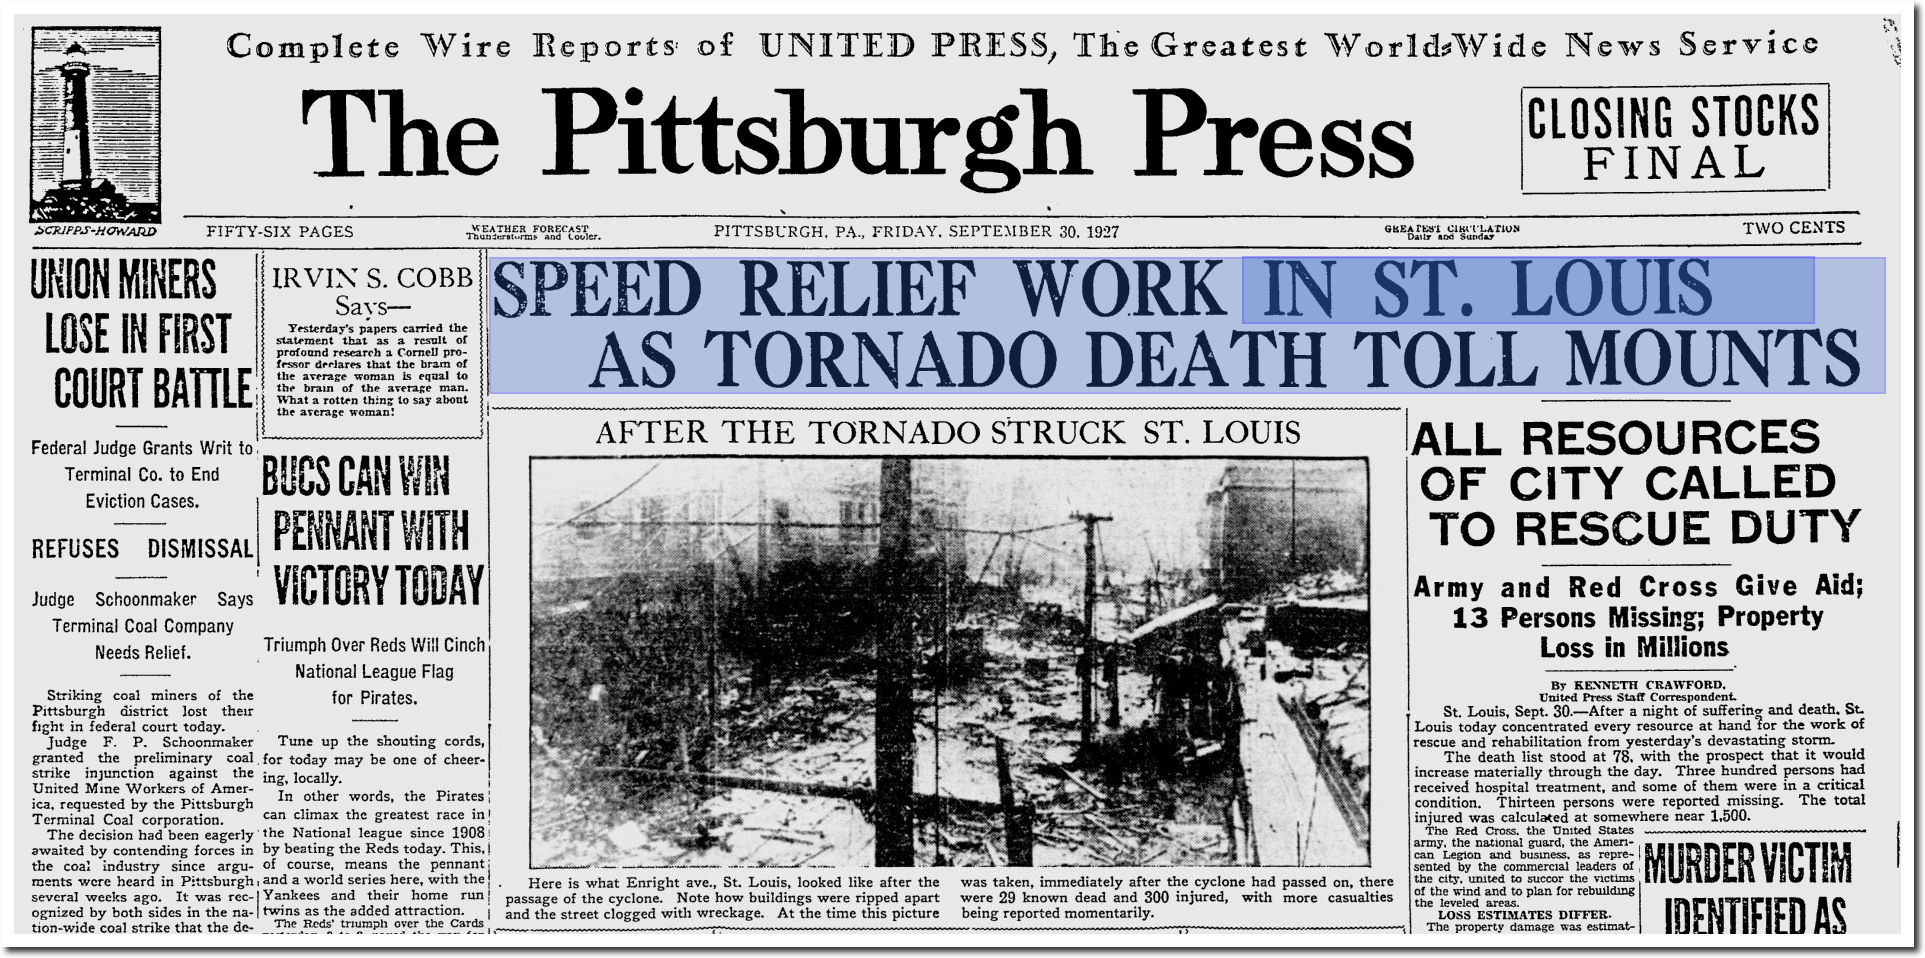
St. Louis was largely destroyed in the September 1927 tornado.

The Pittsburgh Press – Google News Archive Search

Progressives believe that lowering CO2 levels will prevent bad weather, but this belief is based in ignorance and superstition. Just like essentially everything else progressives believe.

Posted in Uncategorized | Leave a comment

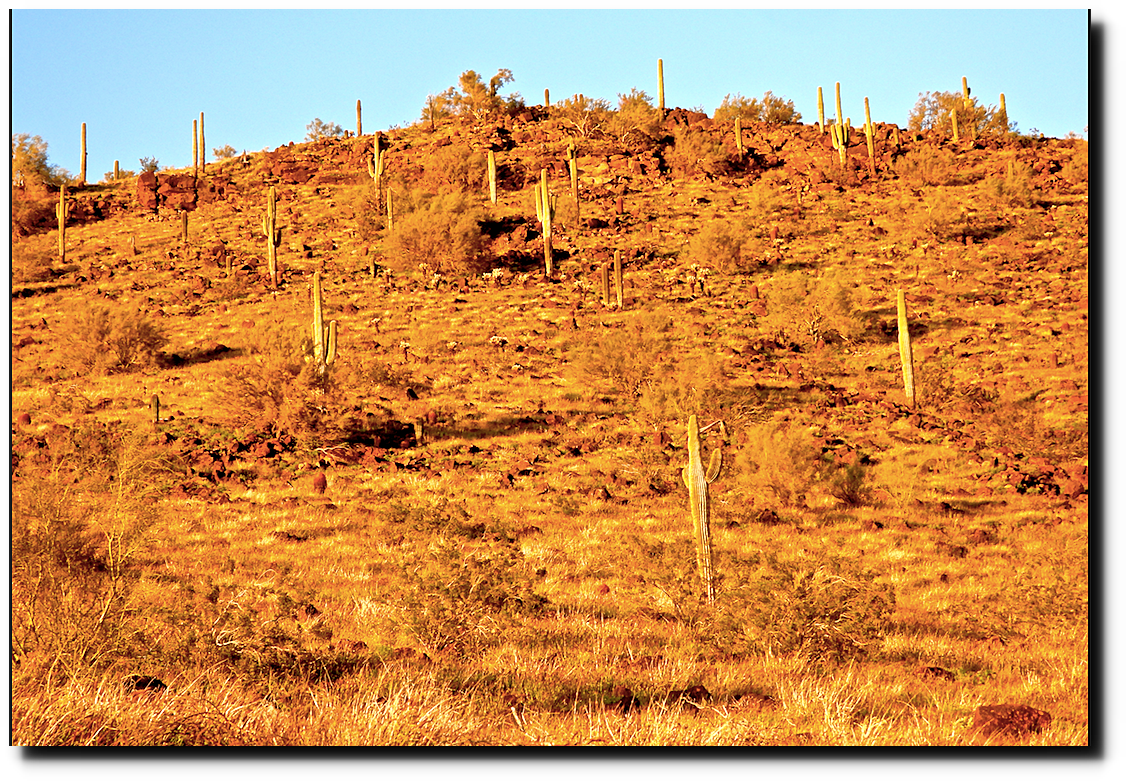
Last Day In The Desert


Posted in Uncategorized | Leave a comment

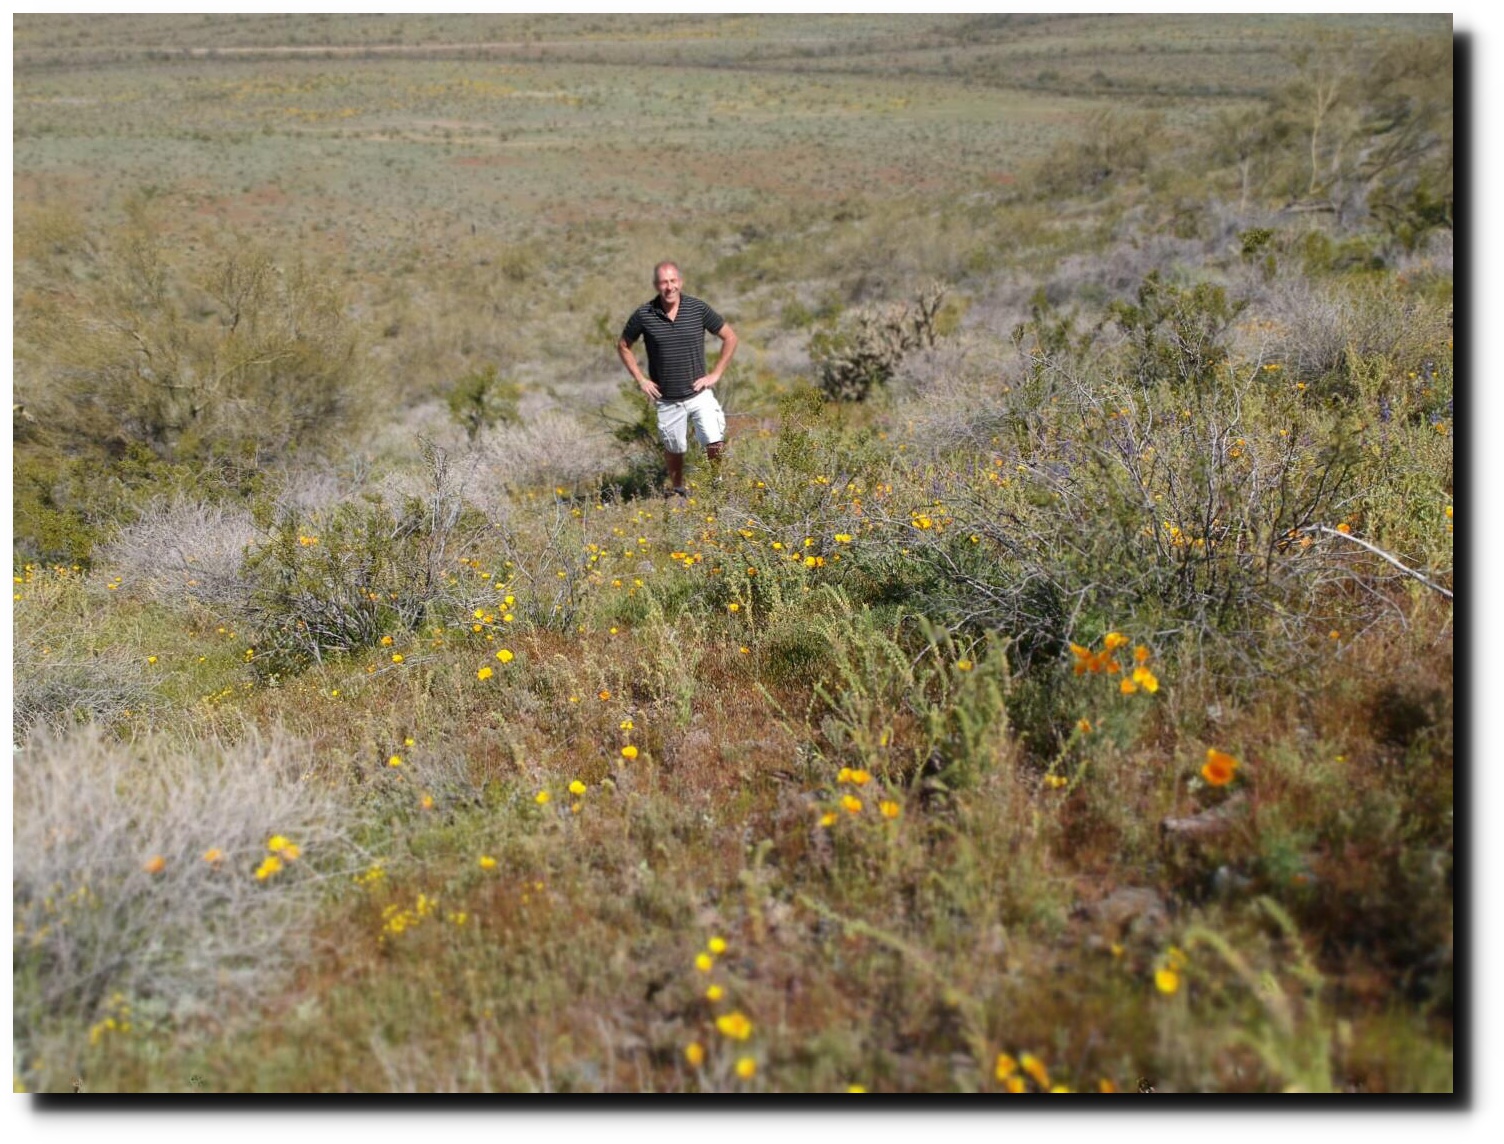
Today’s Arizona Climate Devastation

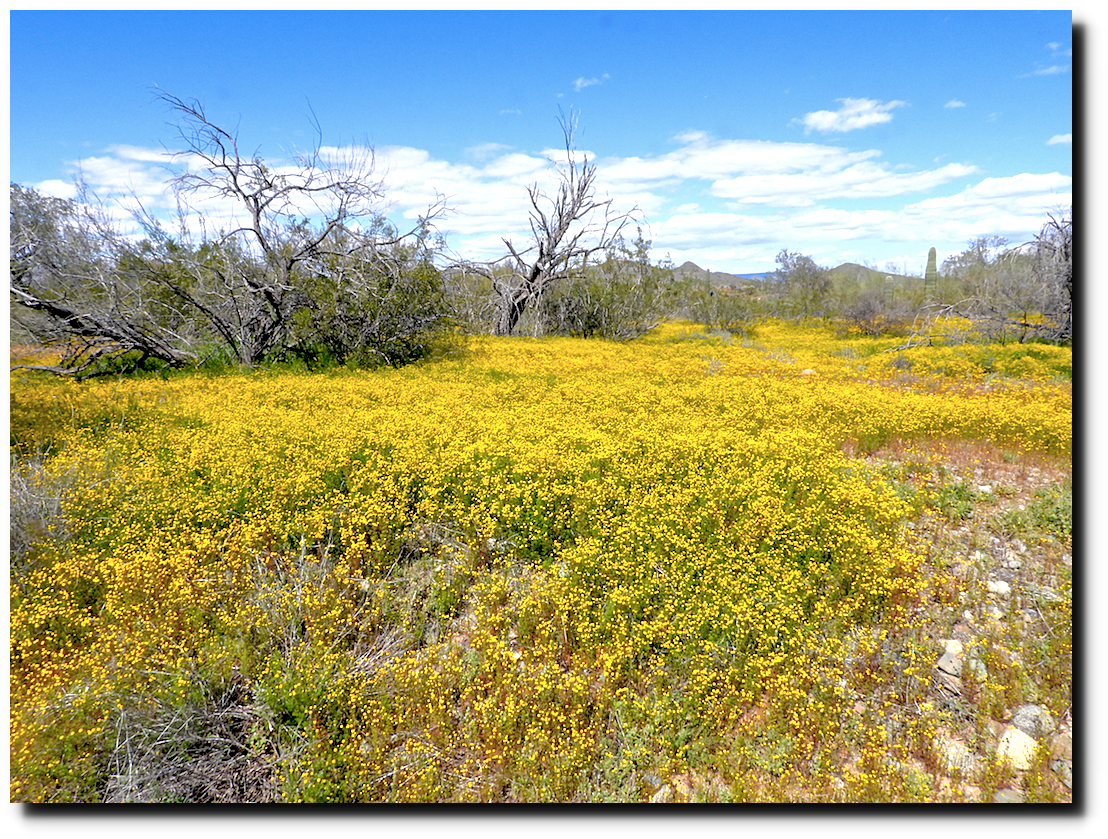
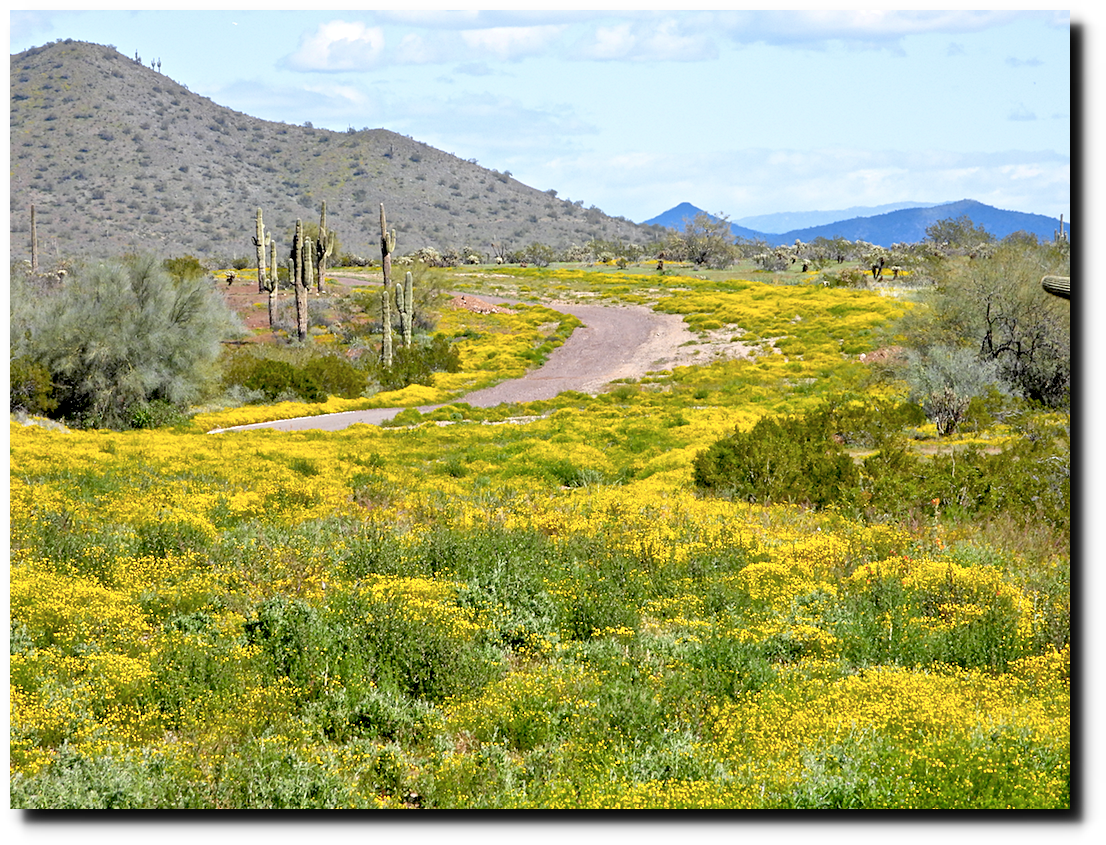
As students protested CO2 today, I was out enjoying the miracles it makes possible.


Posted in Uncategorized | Leave a comment

March Heatwaves

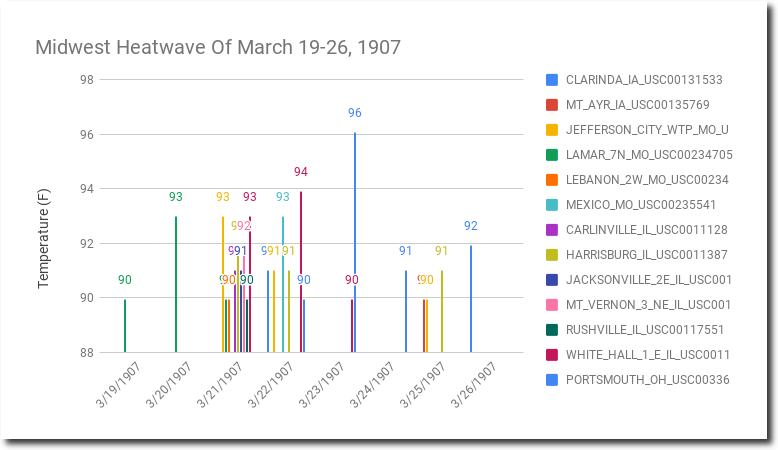
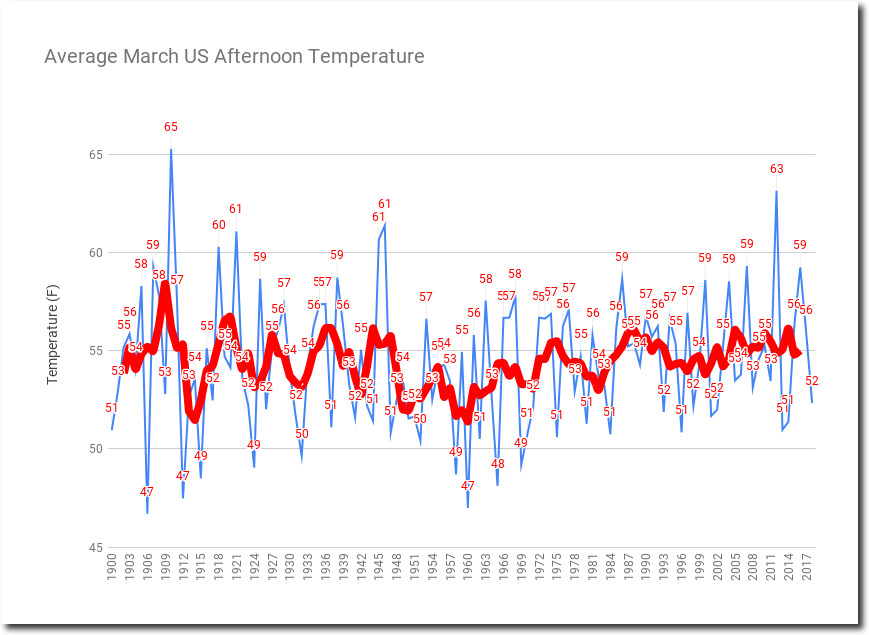
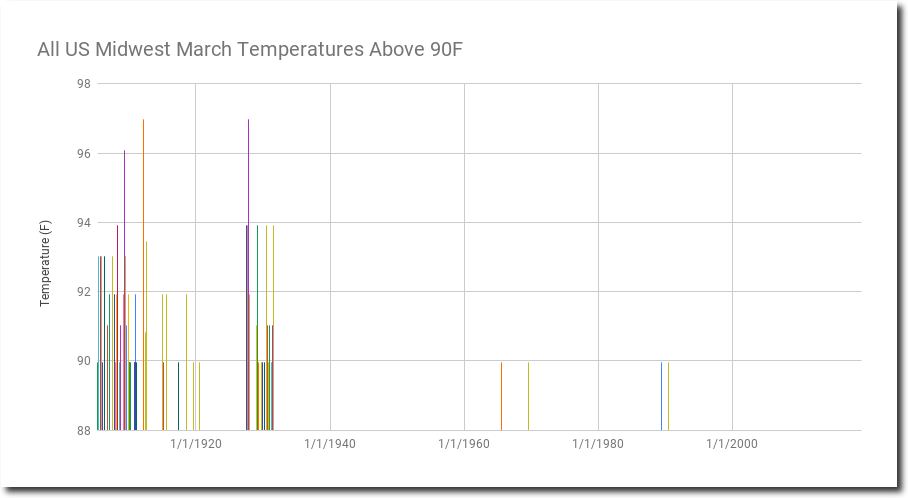
Since 1895, the US Midwest has recorded March temperatures above ninety degrees on 65 occasions, spread out over 25 days.  All of these occurred more than 30 years ago, and 63 of the 65 hot days occurred at least 90 years ago. The two hottest days were March 27, 1910 and March 24, 1929 – both of which reached 97F (36C.)

Spreadsheet

Same story with 85 degree March days – they used to be relatively common, but rarely happen any more.

The table below shows the dates when March ninety degree temperatures were recorded. Note that the Midwest had 90 degree temperatures on eight consecutive days from March 19, 1907 to March 26, 1907.

3/29/1905 
3/19/1907 3/20/1907 3/21/1907 3/22/1907 3/23/1907 3/24/1907 3/25/1907 3/26/1907 
3/22/1910 3/23/1910 3/24/1910 3/25/1910 3/27/1910 3/28/1910 
3/29/1913 
3/21/1916 
3/30/1917 
3/14/1918 
3/22/1928 
3/23/1929 3/24/1929 3/25/1929 
3/24/1967 
3/6/1988

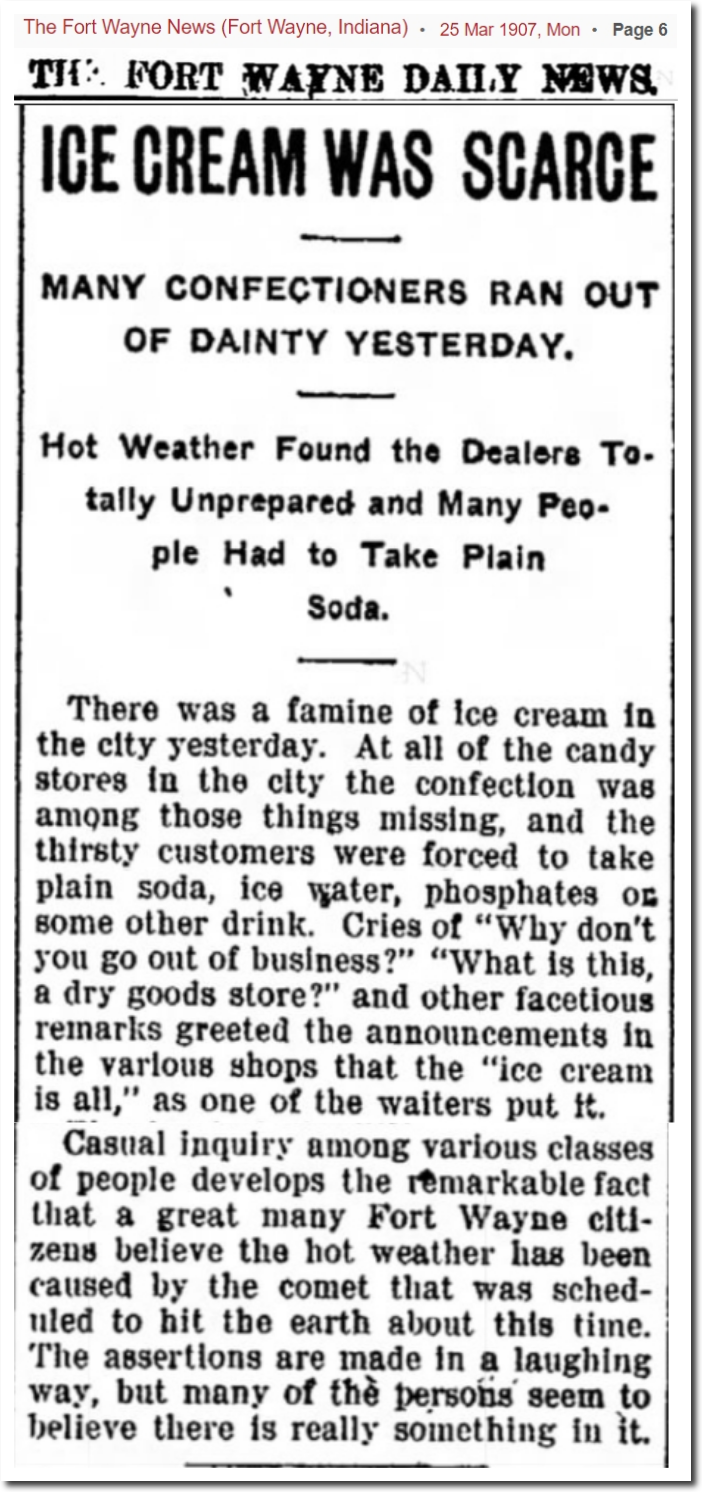
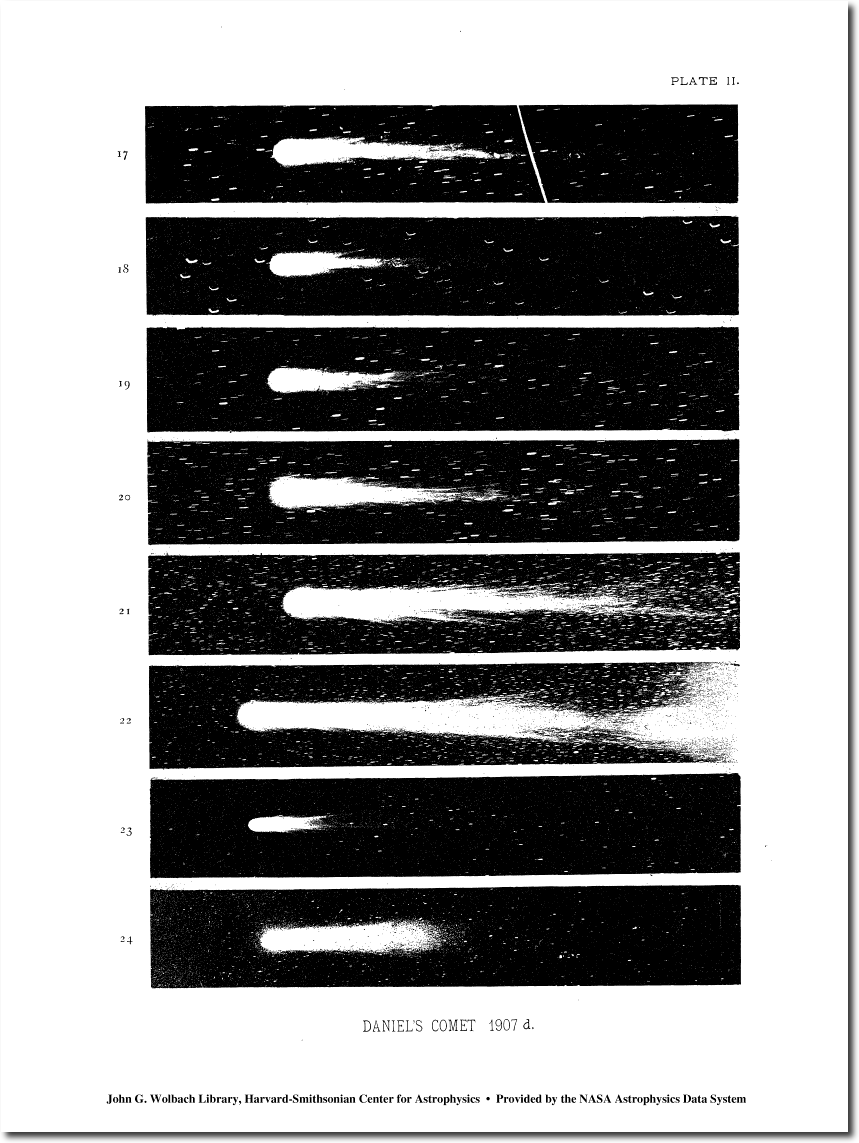
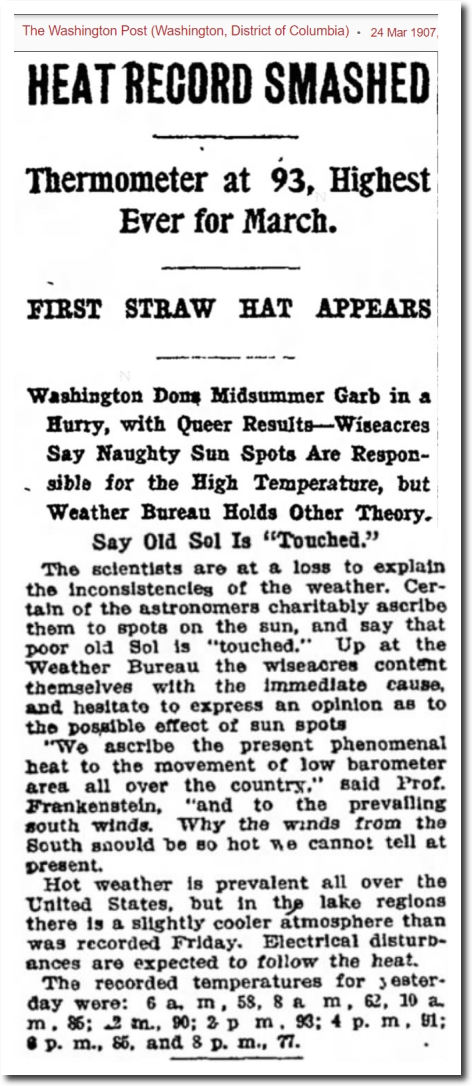
On March 24, 1907 there was an ice cream shortage due to the heat, and people blamed the heat on a comet.


25 Mar 1907, Page 6 – The Fort Wayne News at Newspapers.com

1908HarCi.144R…2P Page 2.2

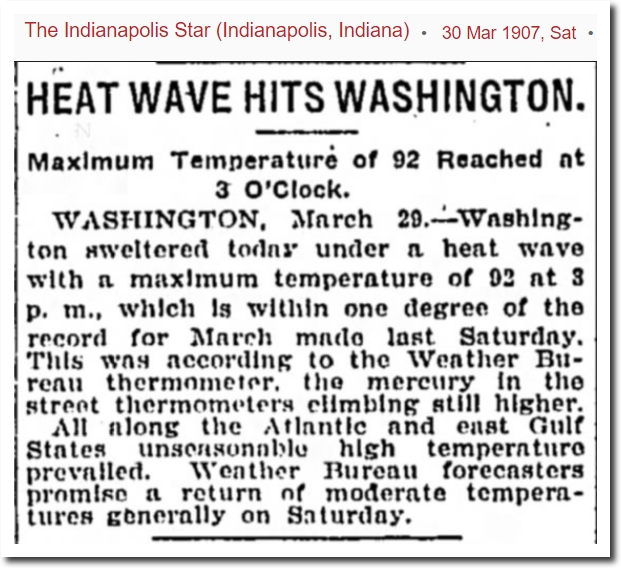
The East coast was also having a record heatwave, and people blamed the heat on sunspots.

24 Mar 1907, Page 11 – The Washington Post at Newspapers.com

30 Mar 1907, Page 2 – The Indianapolis Star at Newspapers.com

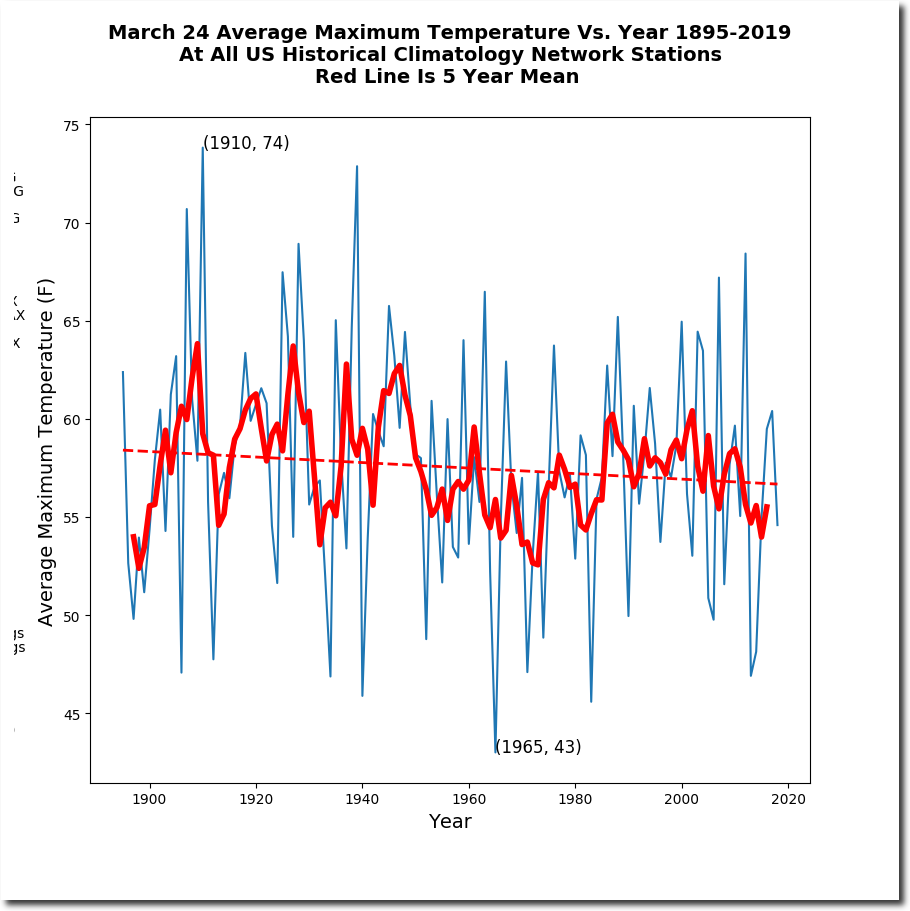
The warmest March in the US occurred in 1910.

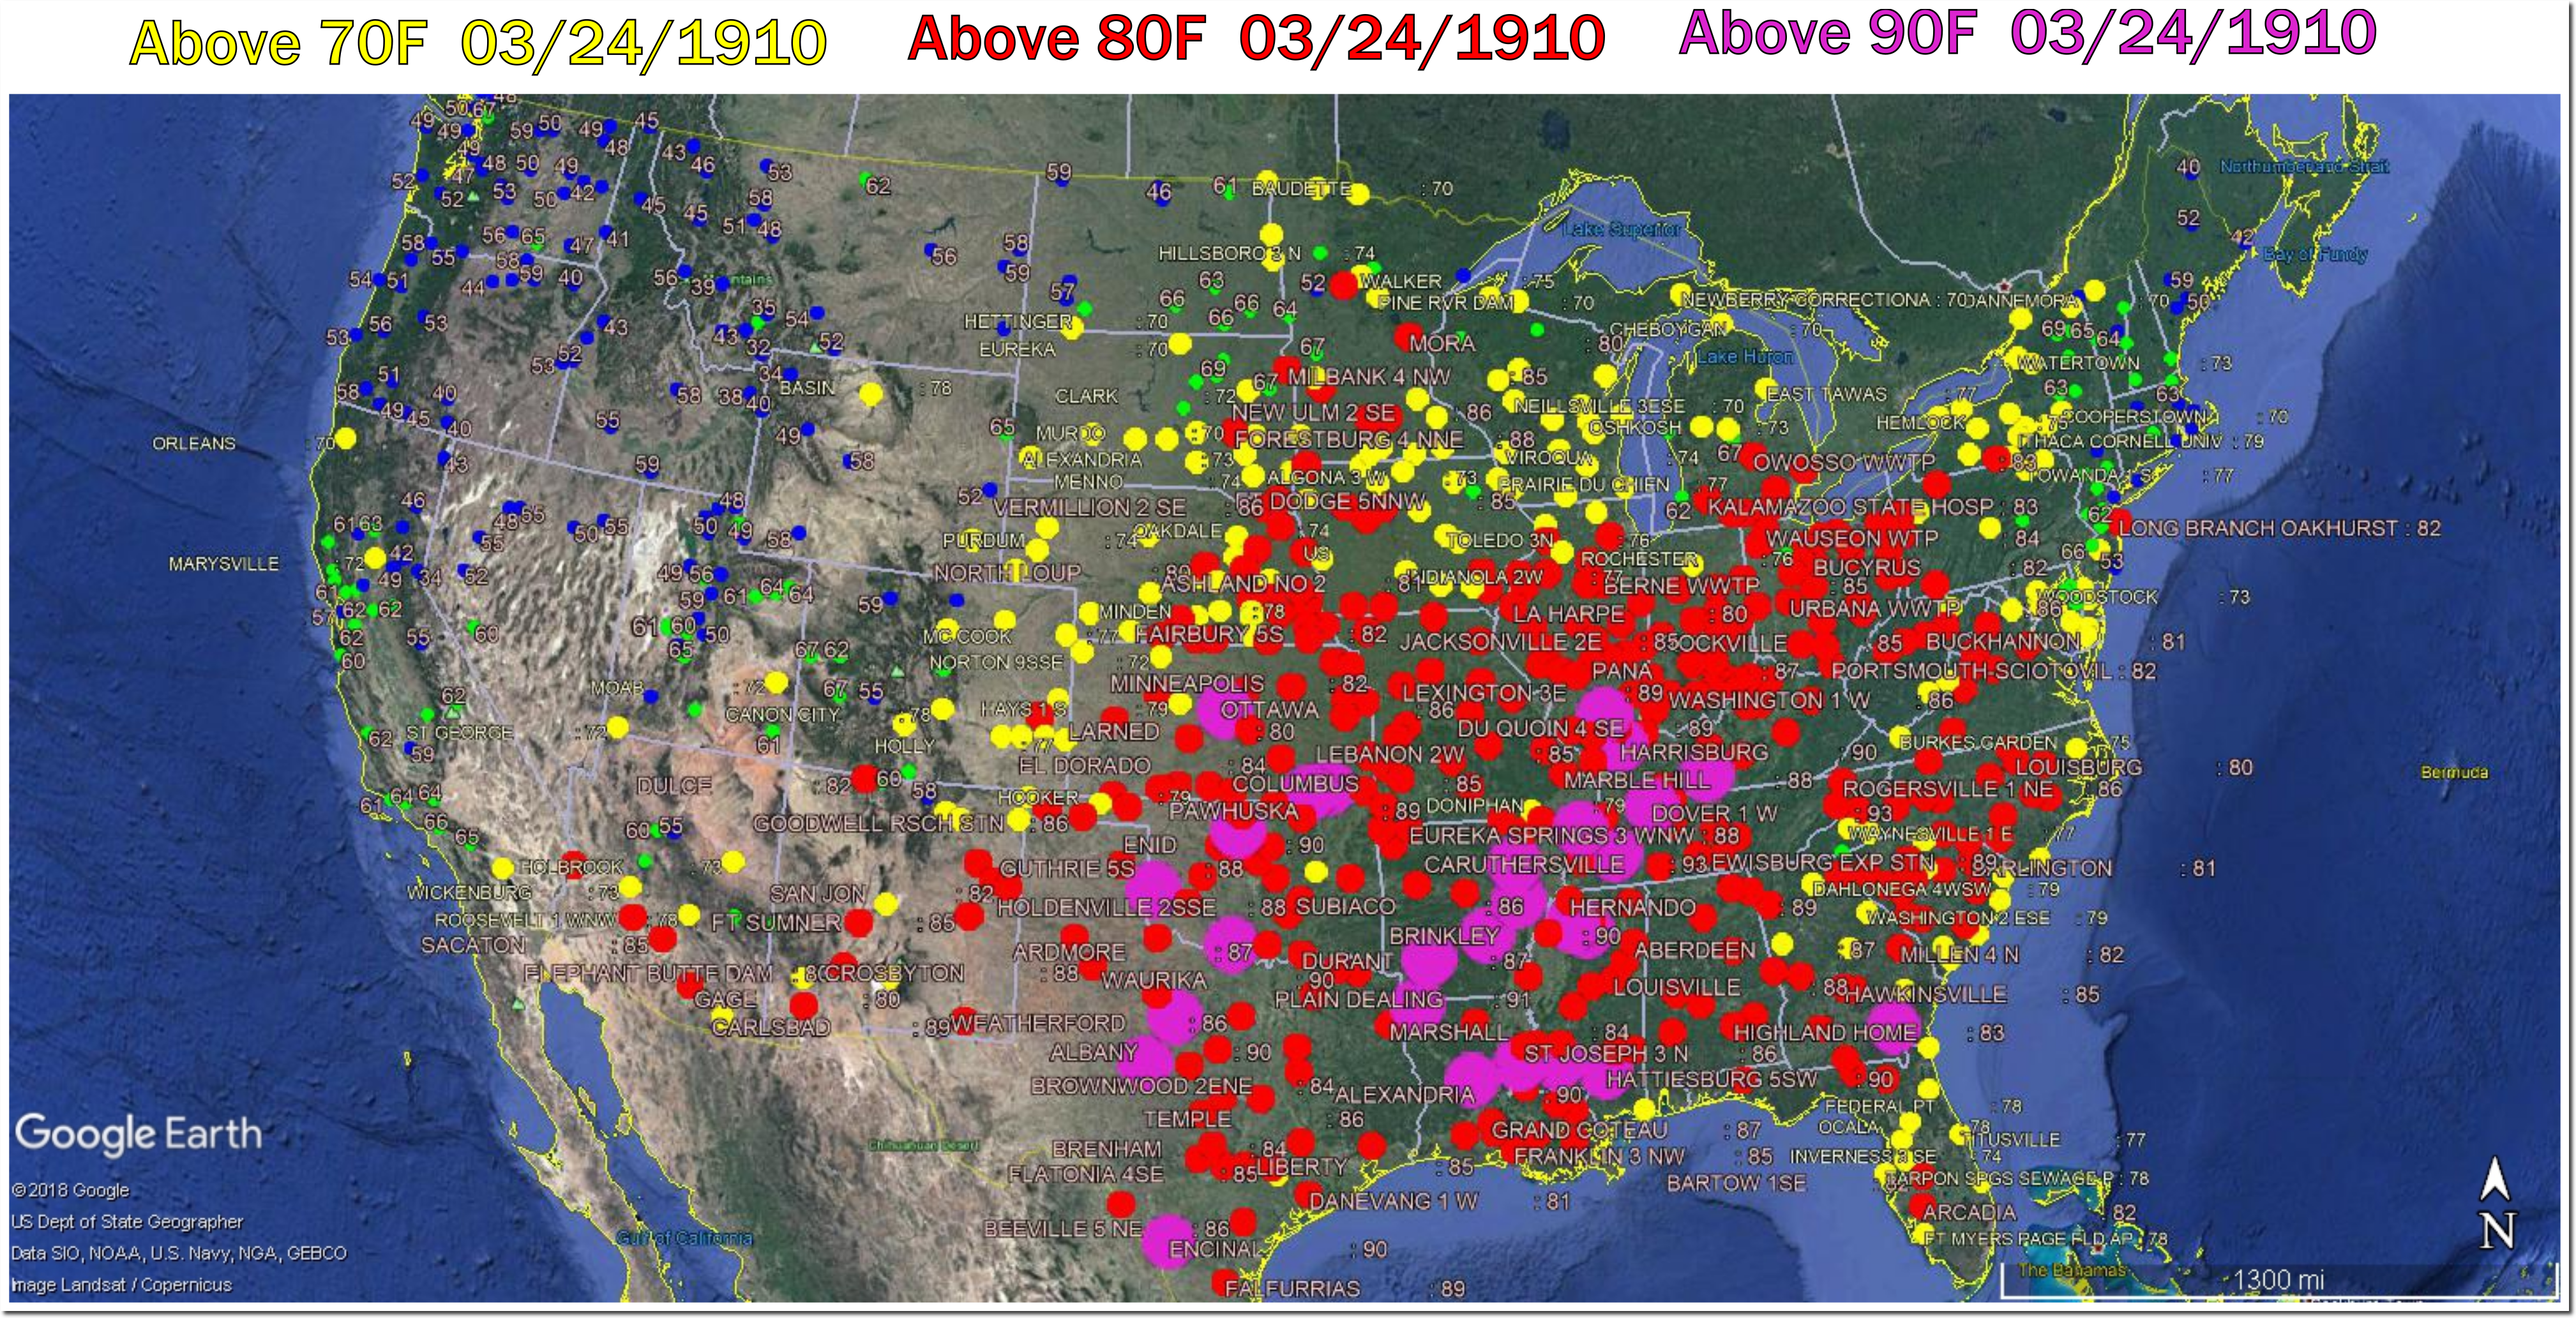
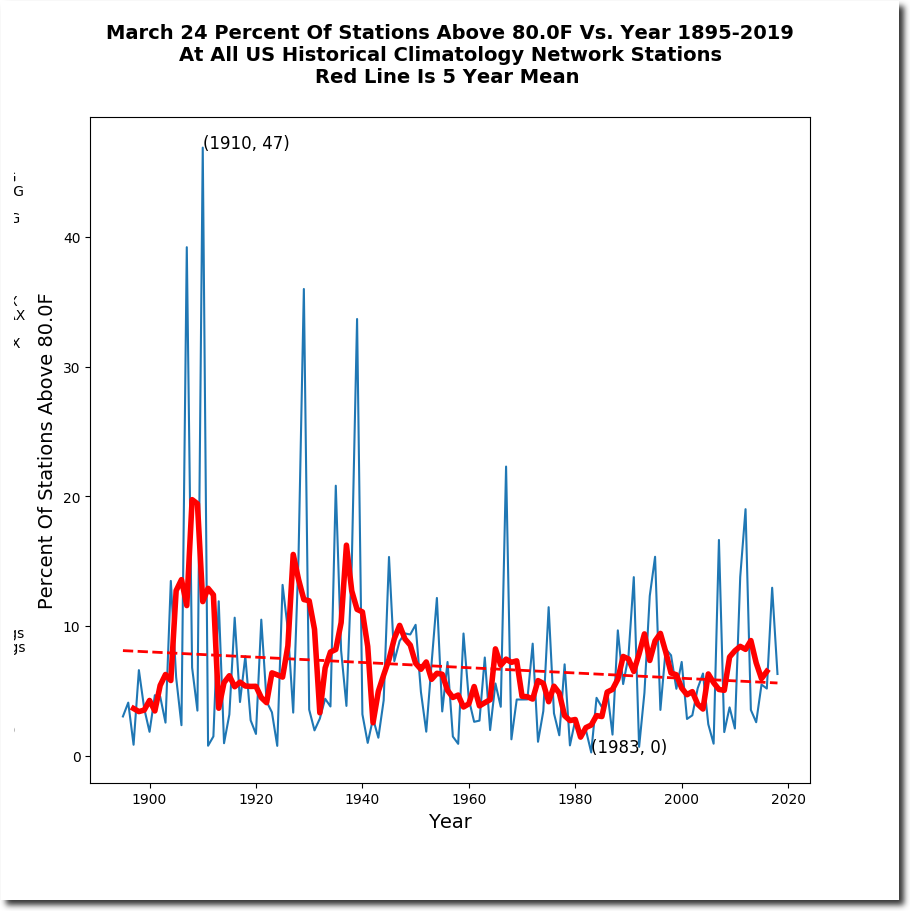
On March 24, 1910 the average maximum temperature across the US was 74 degrees, and nearly half of the US was above 80 degrees.

Heat like this is inconceivable now, but if it did happen climate experts would declare 99% certainty it was caused by CO2.

Posted in Uncategorized | Leave a comment

My Solution To Global Warming

Global warming can be solved overnight.

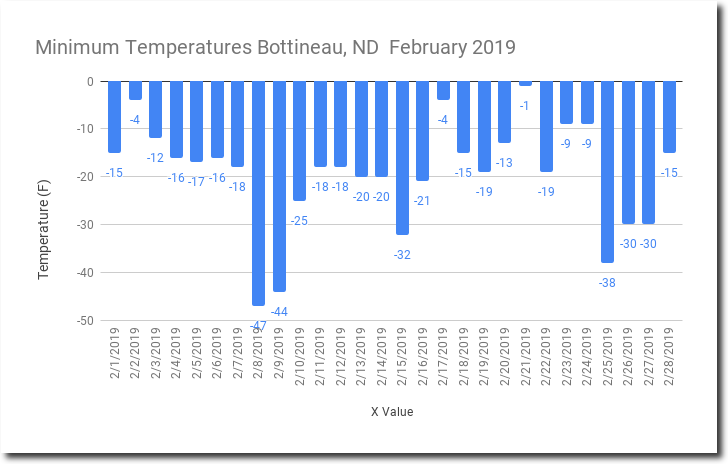
Move the experts at NOAA who say winter is hot, to North Dakota.  Bottineau, ND just had their second coldest February on record, with an average minimum temperature of -19F.  It was also the first February with no nights above 0F, and the -47F on February 8th was their second lowest February temperature on record.
Posted in Uncategorized | Leave a comment

Rain Stopped, And The Sun Has Returned

Posted in Uncategorized | Leave a comment

Scientists Created Hitler, And Later Erased Him

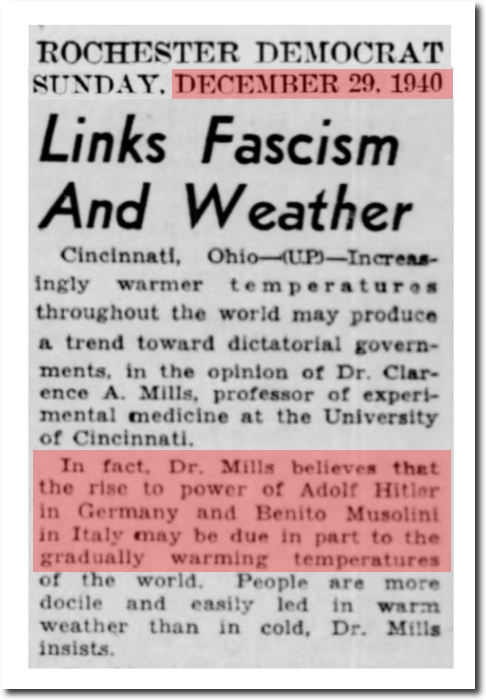
In 1940, scientists blamed the rise of Hitler on global warming.

29 Dec 1940, Page 55 – Democrat and Chronicle at Newspapers.com

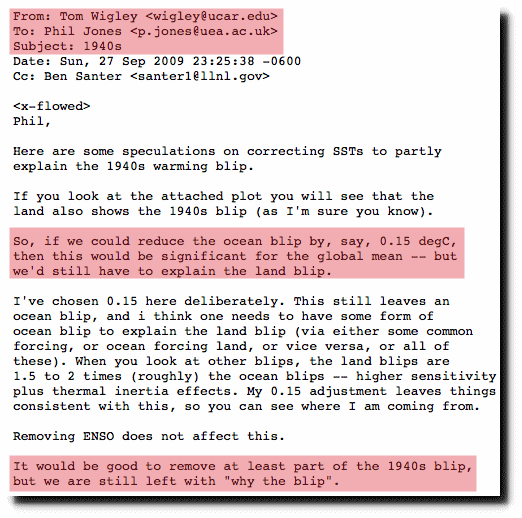
But no worries, they later erased the 1940s warmth – presumably making Hitler disappear.

di2.nu/foia/1254108338.txt

Posted in Uncategorized | Leave a comment

Arctic Ice Still Refuses To Melt As Ordered

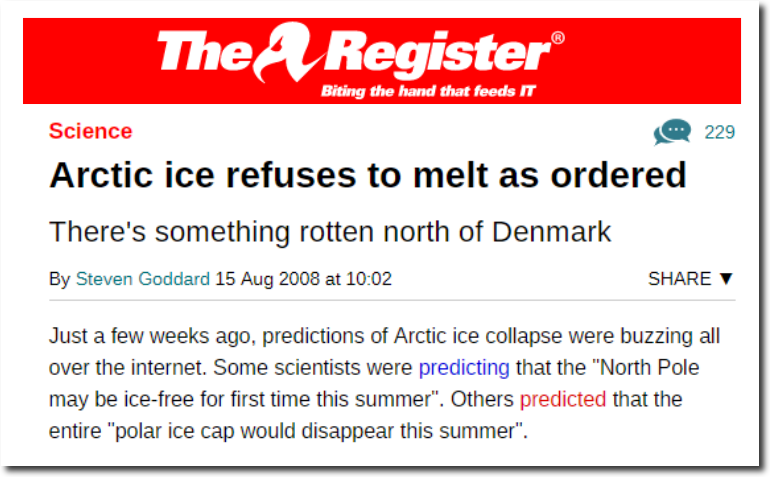
Eleven years ago, I started analyzing the junk science behind the Arctic meltdown. This made the purveyors of the Arctic melting scam very angry.

Arctic ice refuses to melt as ordered • The Register

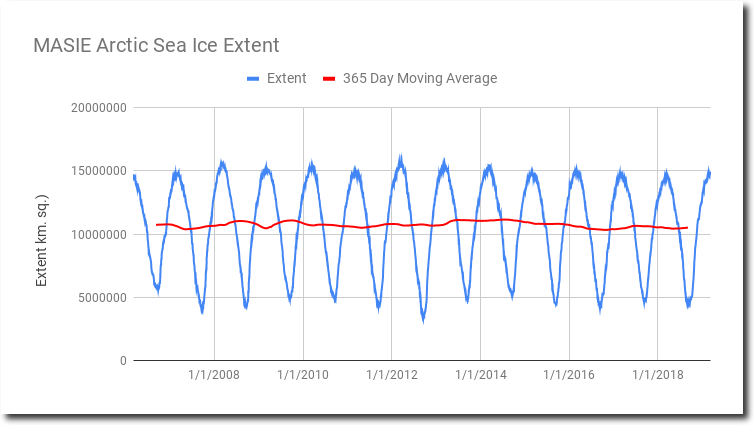
And eleven years later, there has been no change in Arctic sea ice.

Spreadsheet  Data

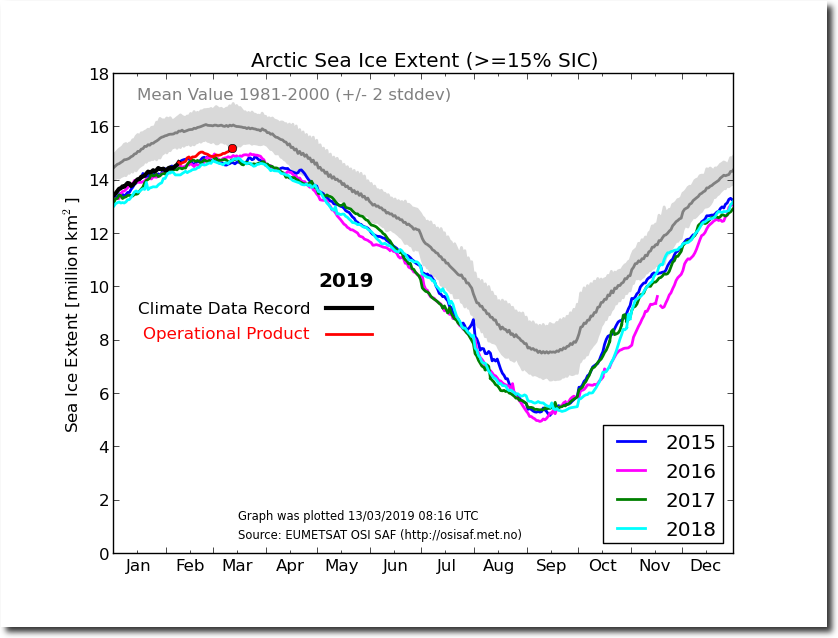
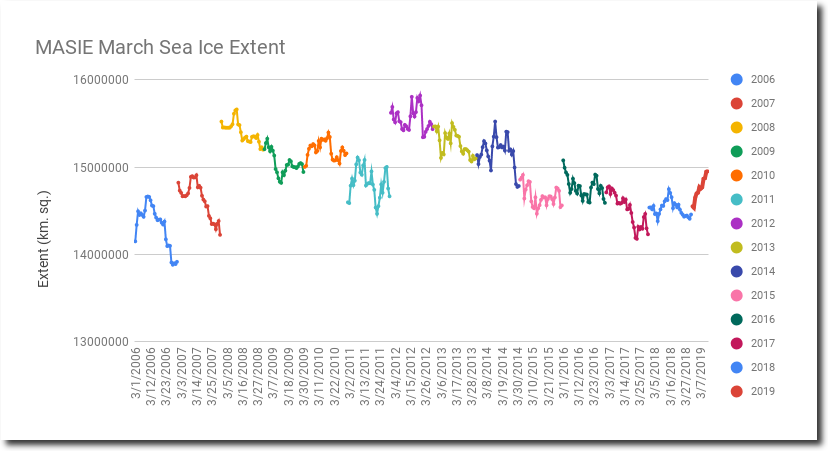
March 14 is on average the peak date for Arctic sea ice extent.  This year it is continuing to increase.

Ocean and Ice Services | Danmarks Meteorologiske Institut

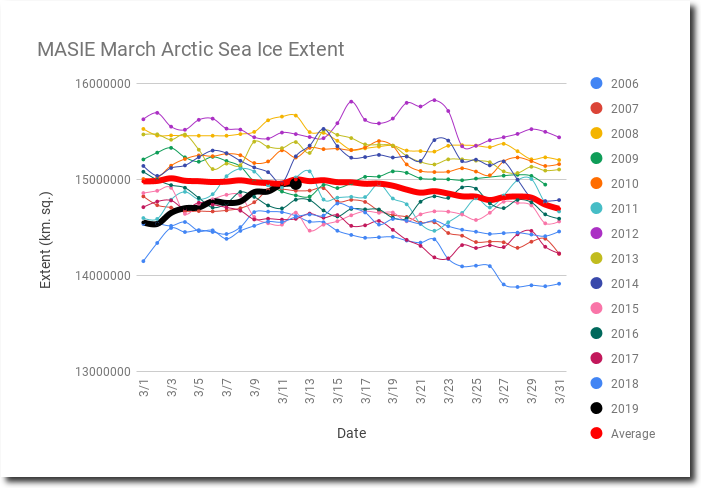
Extent is right at the MASIE average for the date.

The highest March extent occurred in 2o12, which also had the lowest minimum. The lowest March extent occurred in 2006, which also had the highest minimum.  So there is no correlation between winter maximum and summer minimum.

Spreadsheet   Data

Ice extent is “normal” everywhere except the Bering Sea.

N_20190313_extn_v3.0.png

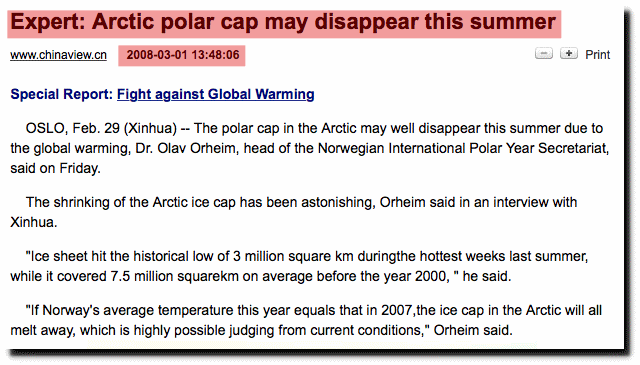
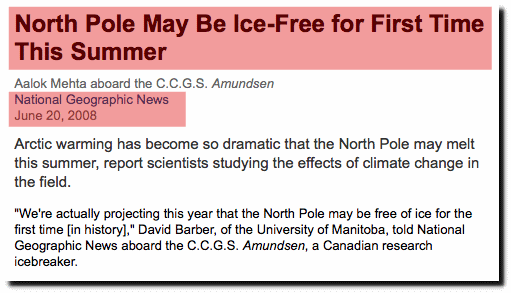
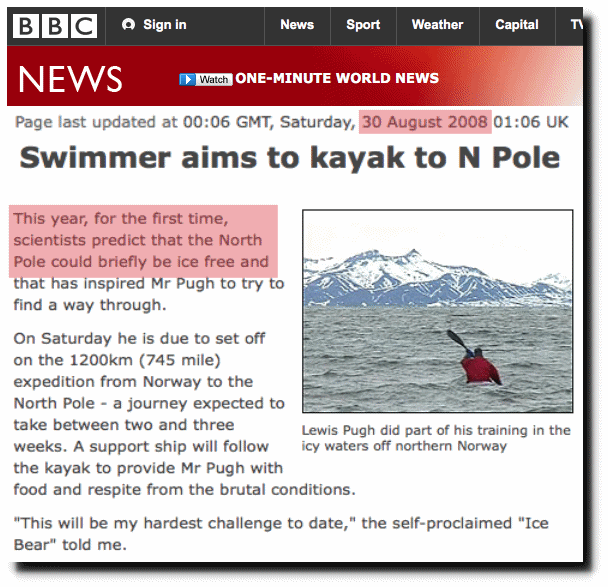
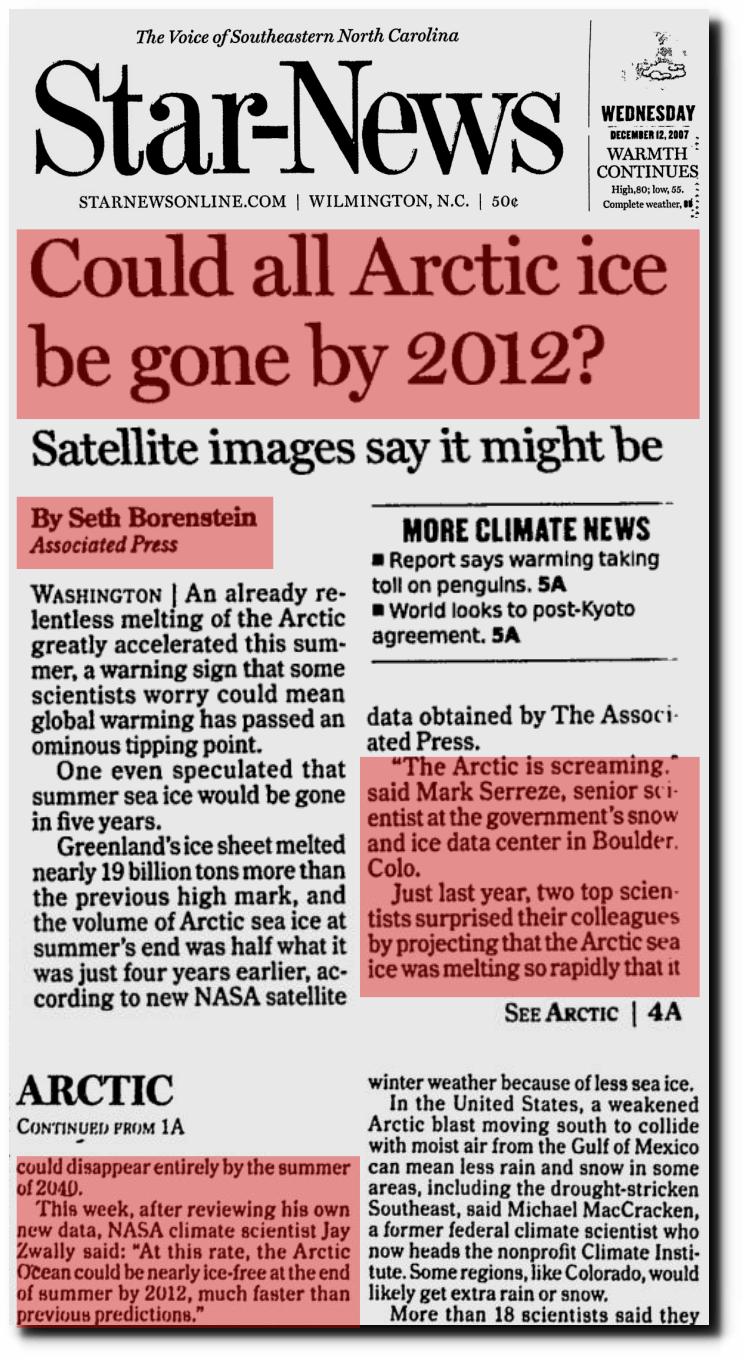
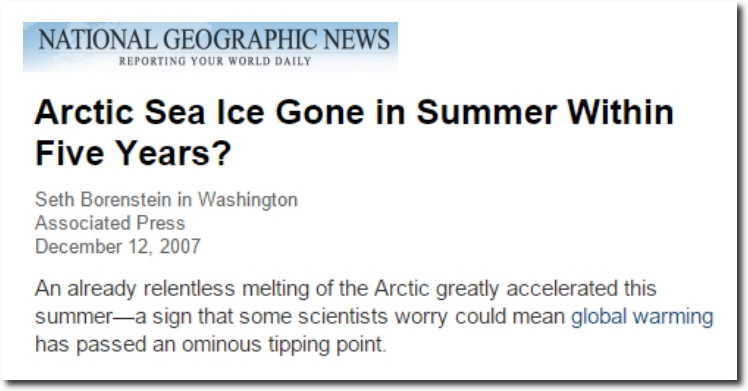
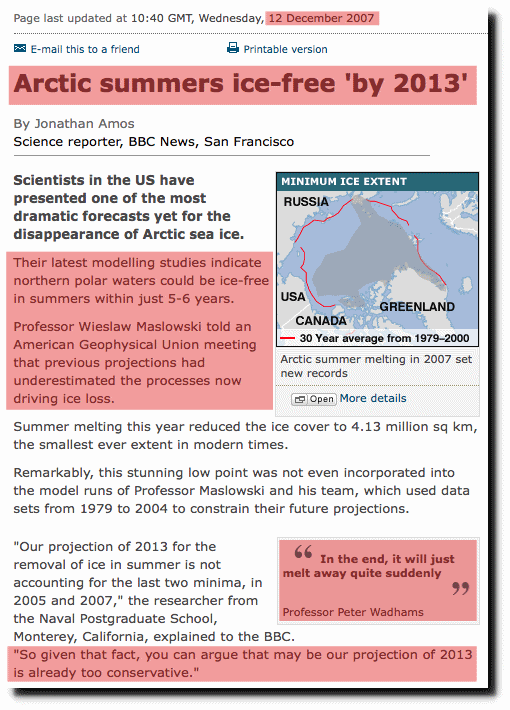
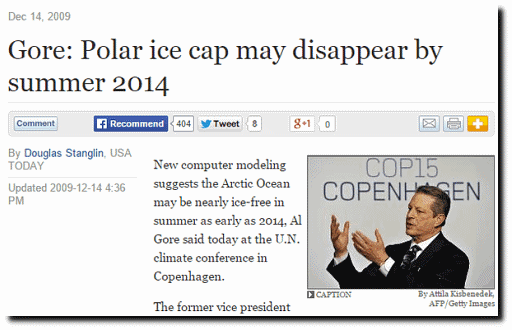
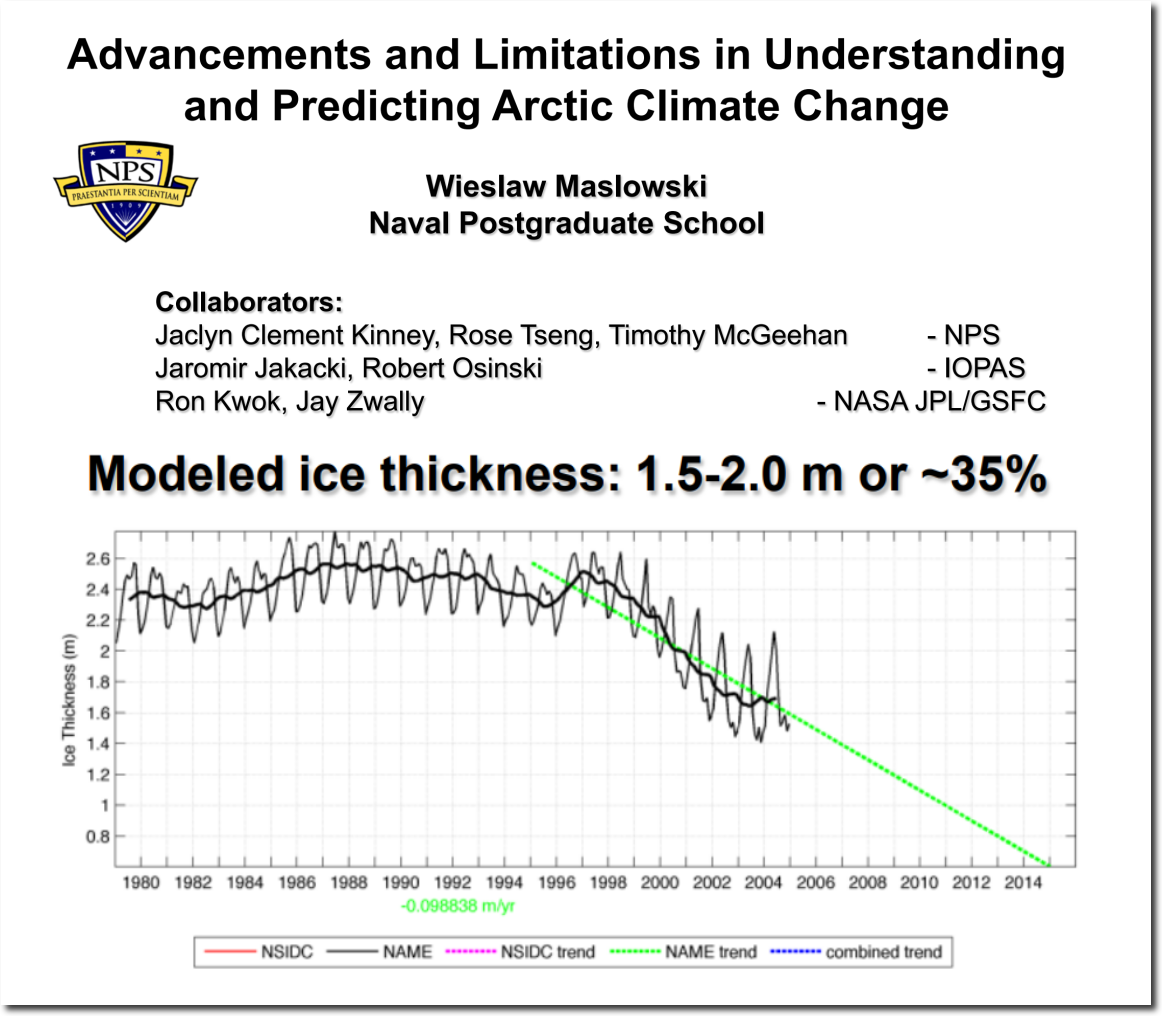
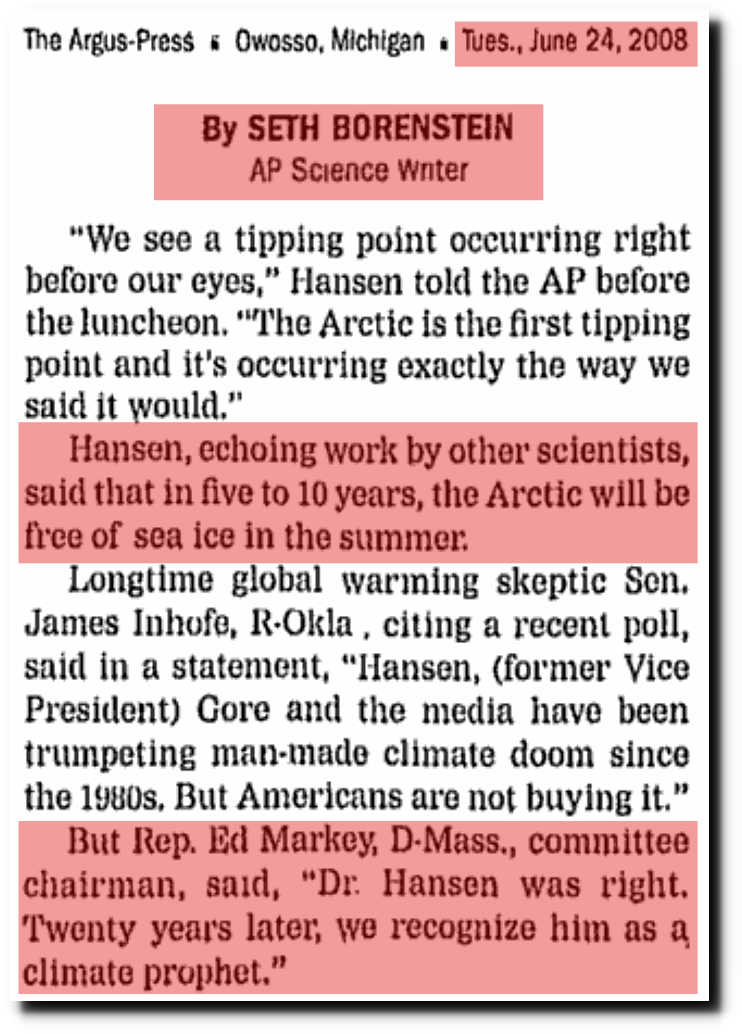
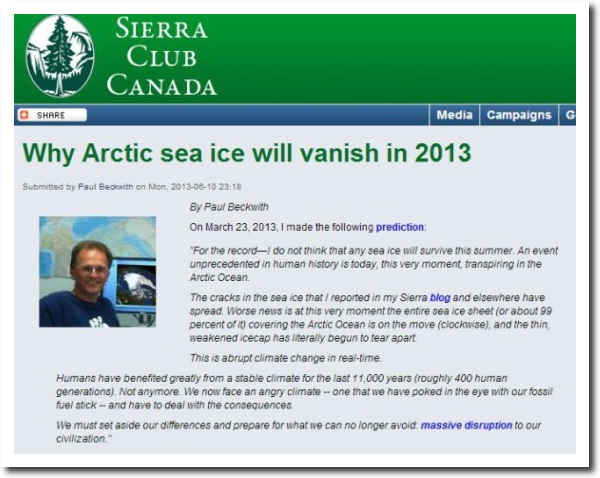
Our top experts said the Arctic would be ice-free by 2008, and almost every year since then.

Expert: Arctic polar cap may disappear this summer_English_Xinhua

North Pole May Be Ice-Free for First Time This Summer

BBC NEWS | UK | Swimmer aims to kayak to N Pole

Star-News – Google News Archive Search

Arctic Sea Ice Gone in Summer Within Five Years?

BBC NEWS | Science/Nature | Arctic summers ice-free ‘by 2013’

Gore: Polar ice cap may disappear by summer 2014

Wayback Machine

The Argus-Press – Google News Archive Search

Why Arctic sea ice will vanish in 2013 | Sierra Club Canada

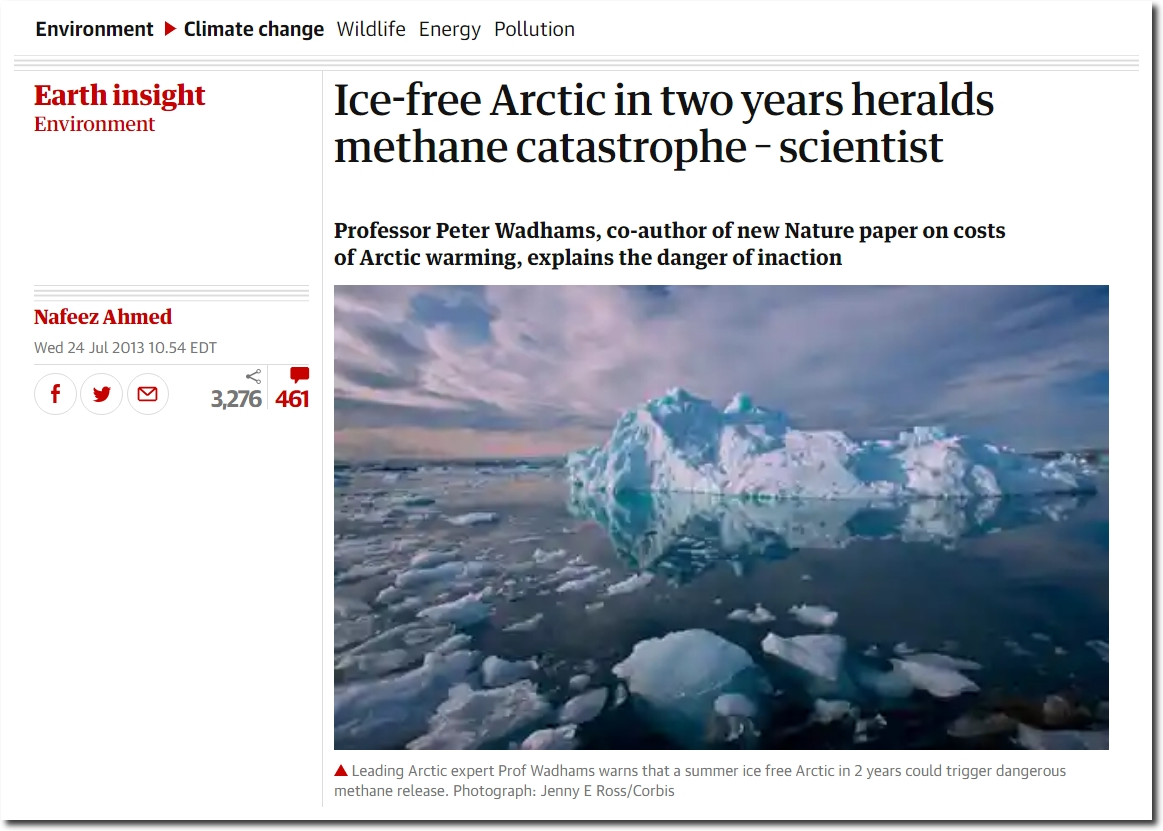
Ice-free Arctic in two years heralds methane catastrophe – scientist | Environment | The Guardian

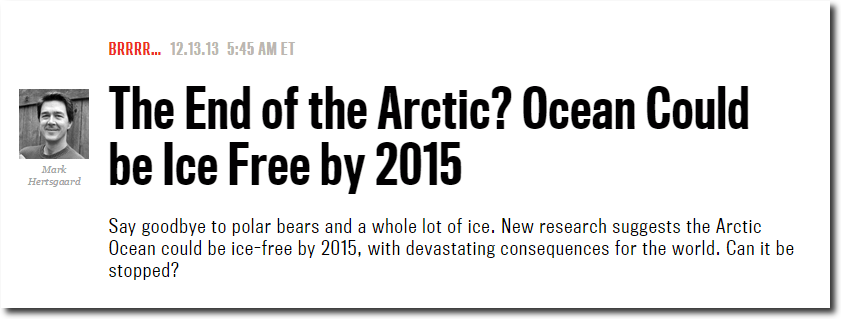
The End of the Arctic? Ocean Could be Ice Free by 2015 – The Daily Beast

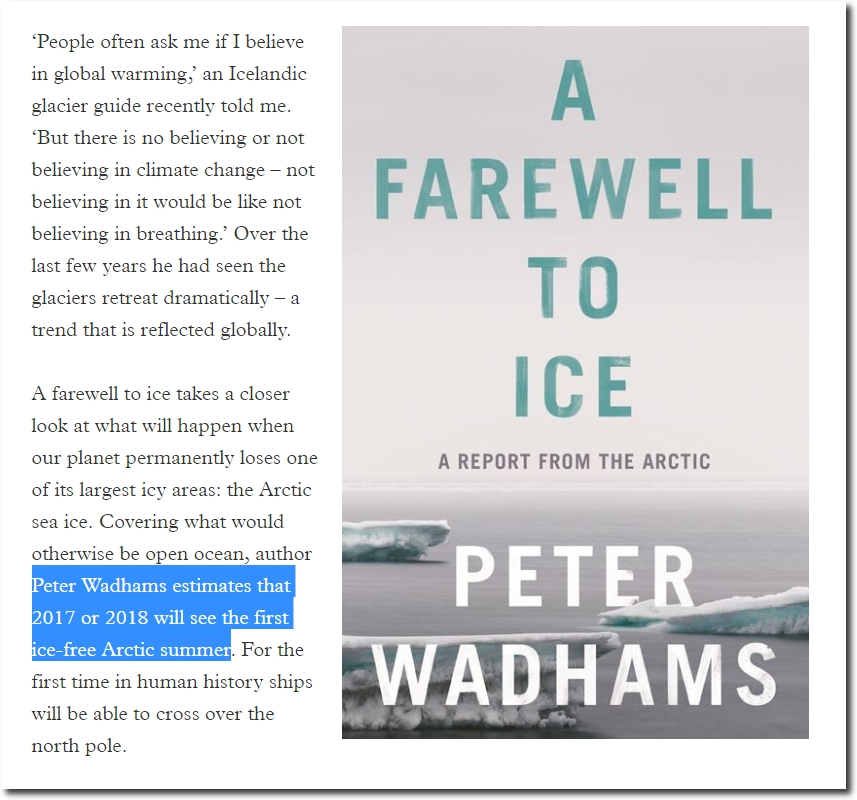
A farewell to ice | Review | Chemistry World

And President Obama’s science adviser predicted ice-free winters.

…if you lose the summer sea ice, there are phenomena that could lead you not so very long thereafter to lose the winter sea ice as well. And if you lose that sea ice year round, it’s going to mean drastic climatic change all over the hemisphere.

– John Holdren, 2009

Posted in Uncategorized | Leave a comment

Yes, But The Laws Are Different For Democrats

Posted in Uncategorized | Leave a comment