In case you forgot why climate scientists pretend they don’t have Arctic sea ice satellite data before 1979.
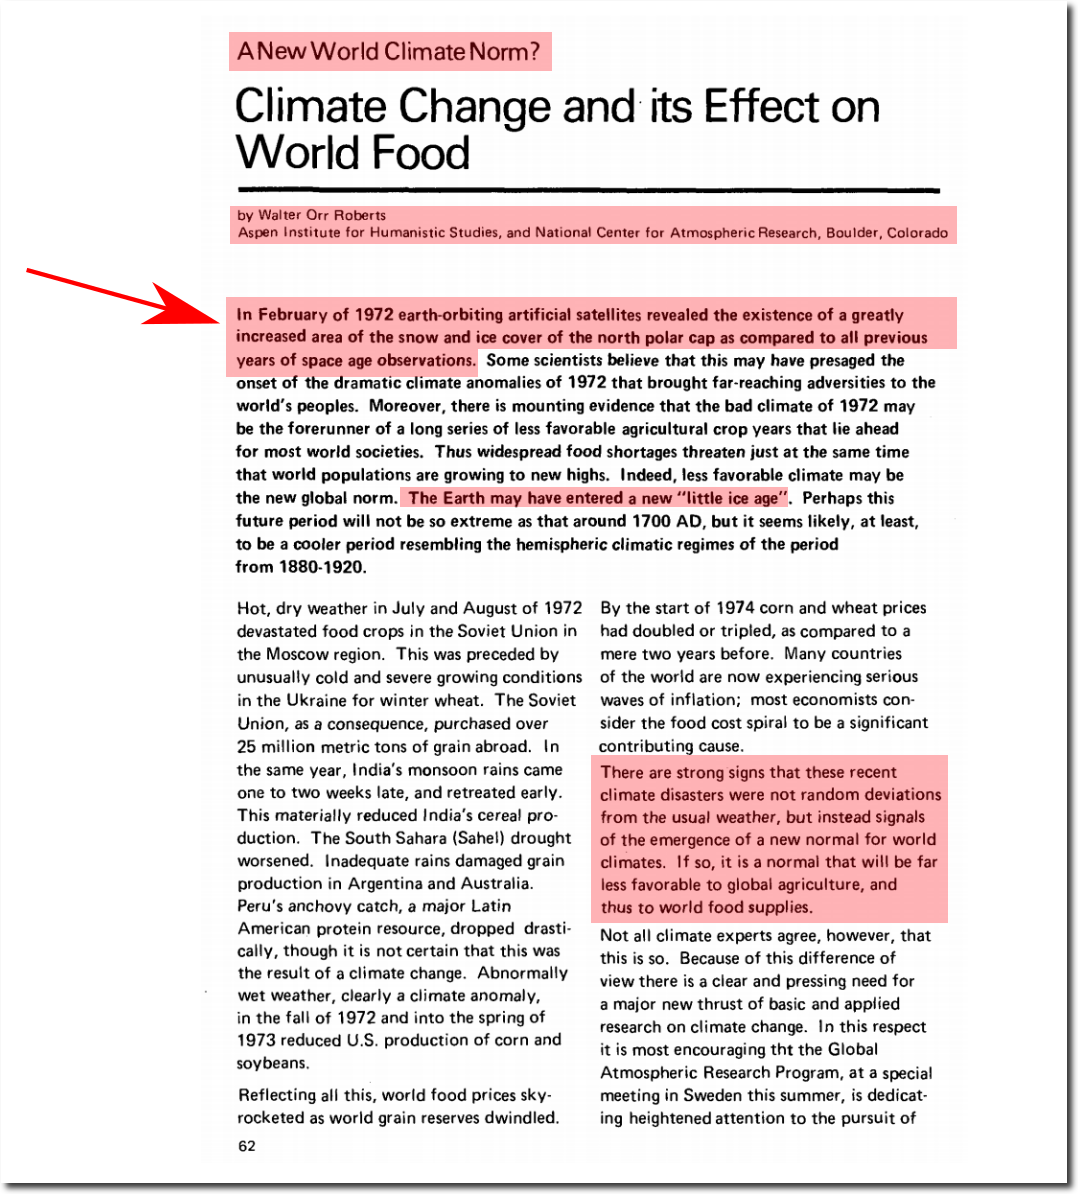
In case you forgot why climate scientists pretend they don’t have Arctic sea ice satellite data before 1979.
One of the many excuses used by climate alarmists (and some skeptics) to ignore my data tampering graphs, is that I don’t grid the data. What I do is take a straight numerical average of temperatures at all stations, which is the cleanest and easiest way to understand and interpret the data. The graph below compares my numerical USHCN average vs. NCDC gridded US temperatures. The trends are nearly identical.
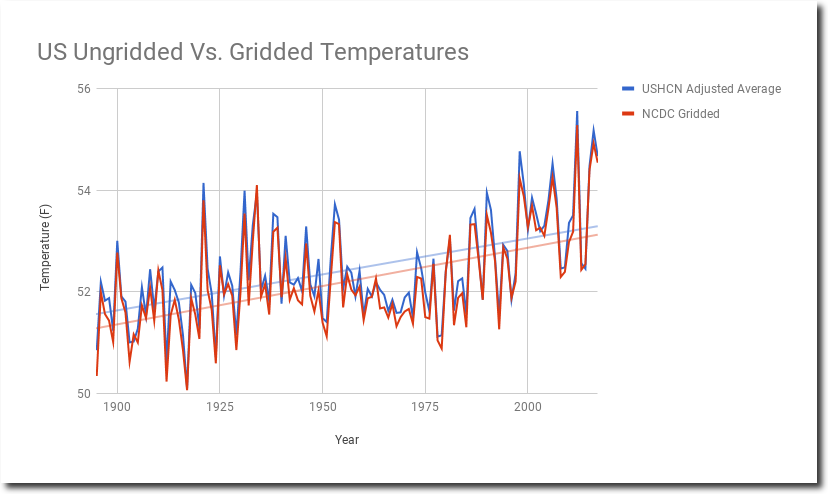
As you can see, gridding has very little effect on the trend.

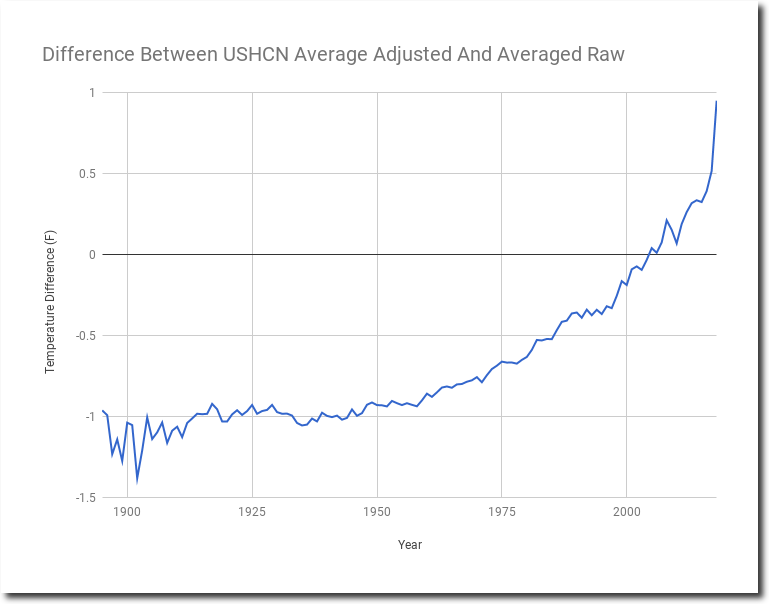
What alarmists choose to ignore is the data tampering, which makes a huge difference.

So why doesn’t gridding matter? Because USHCN stations are relatively evenly spaced around the country.
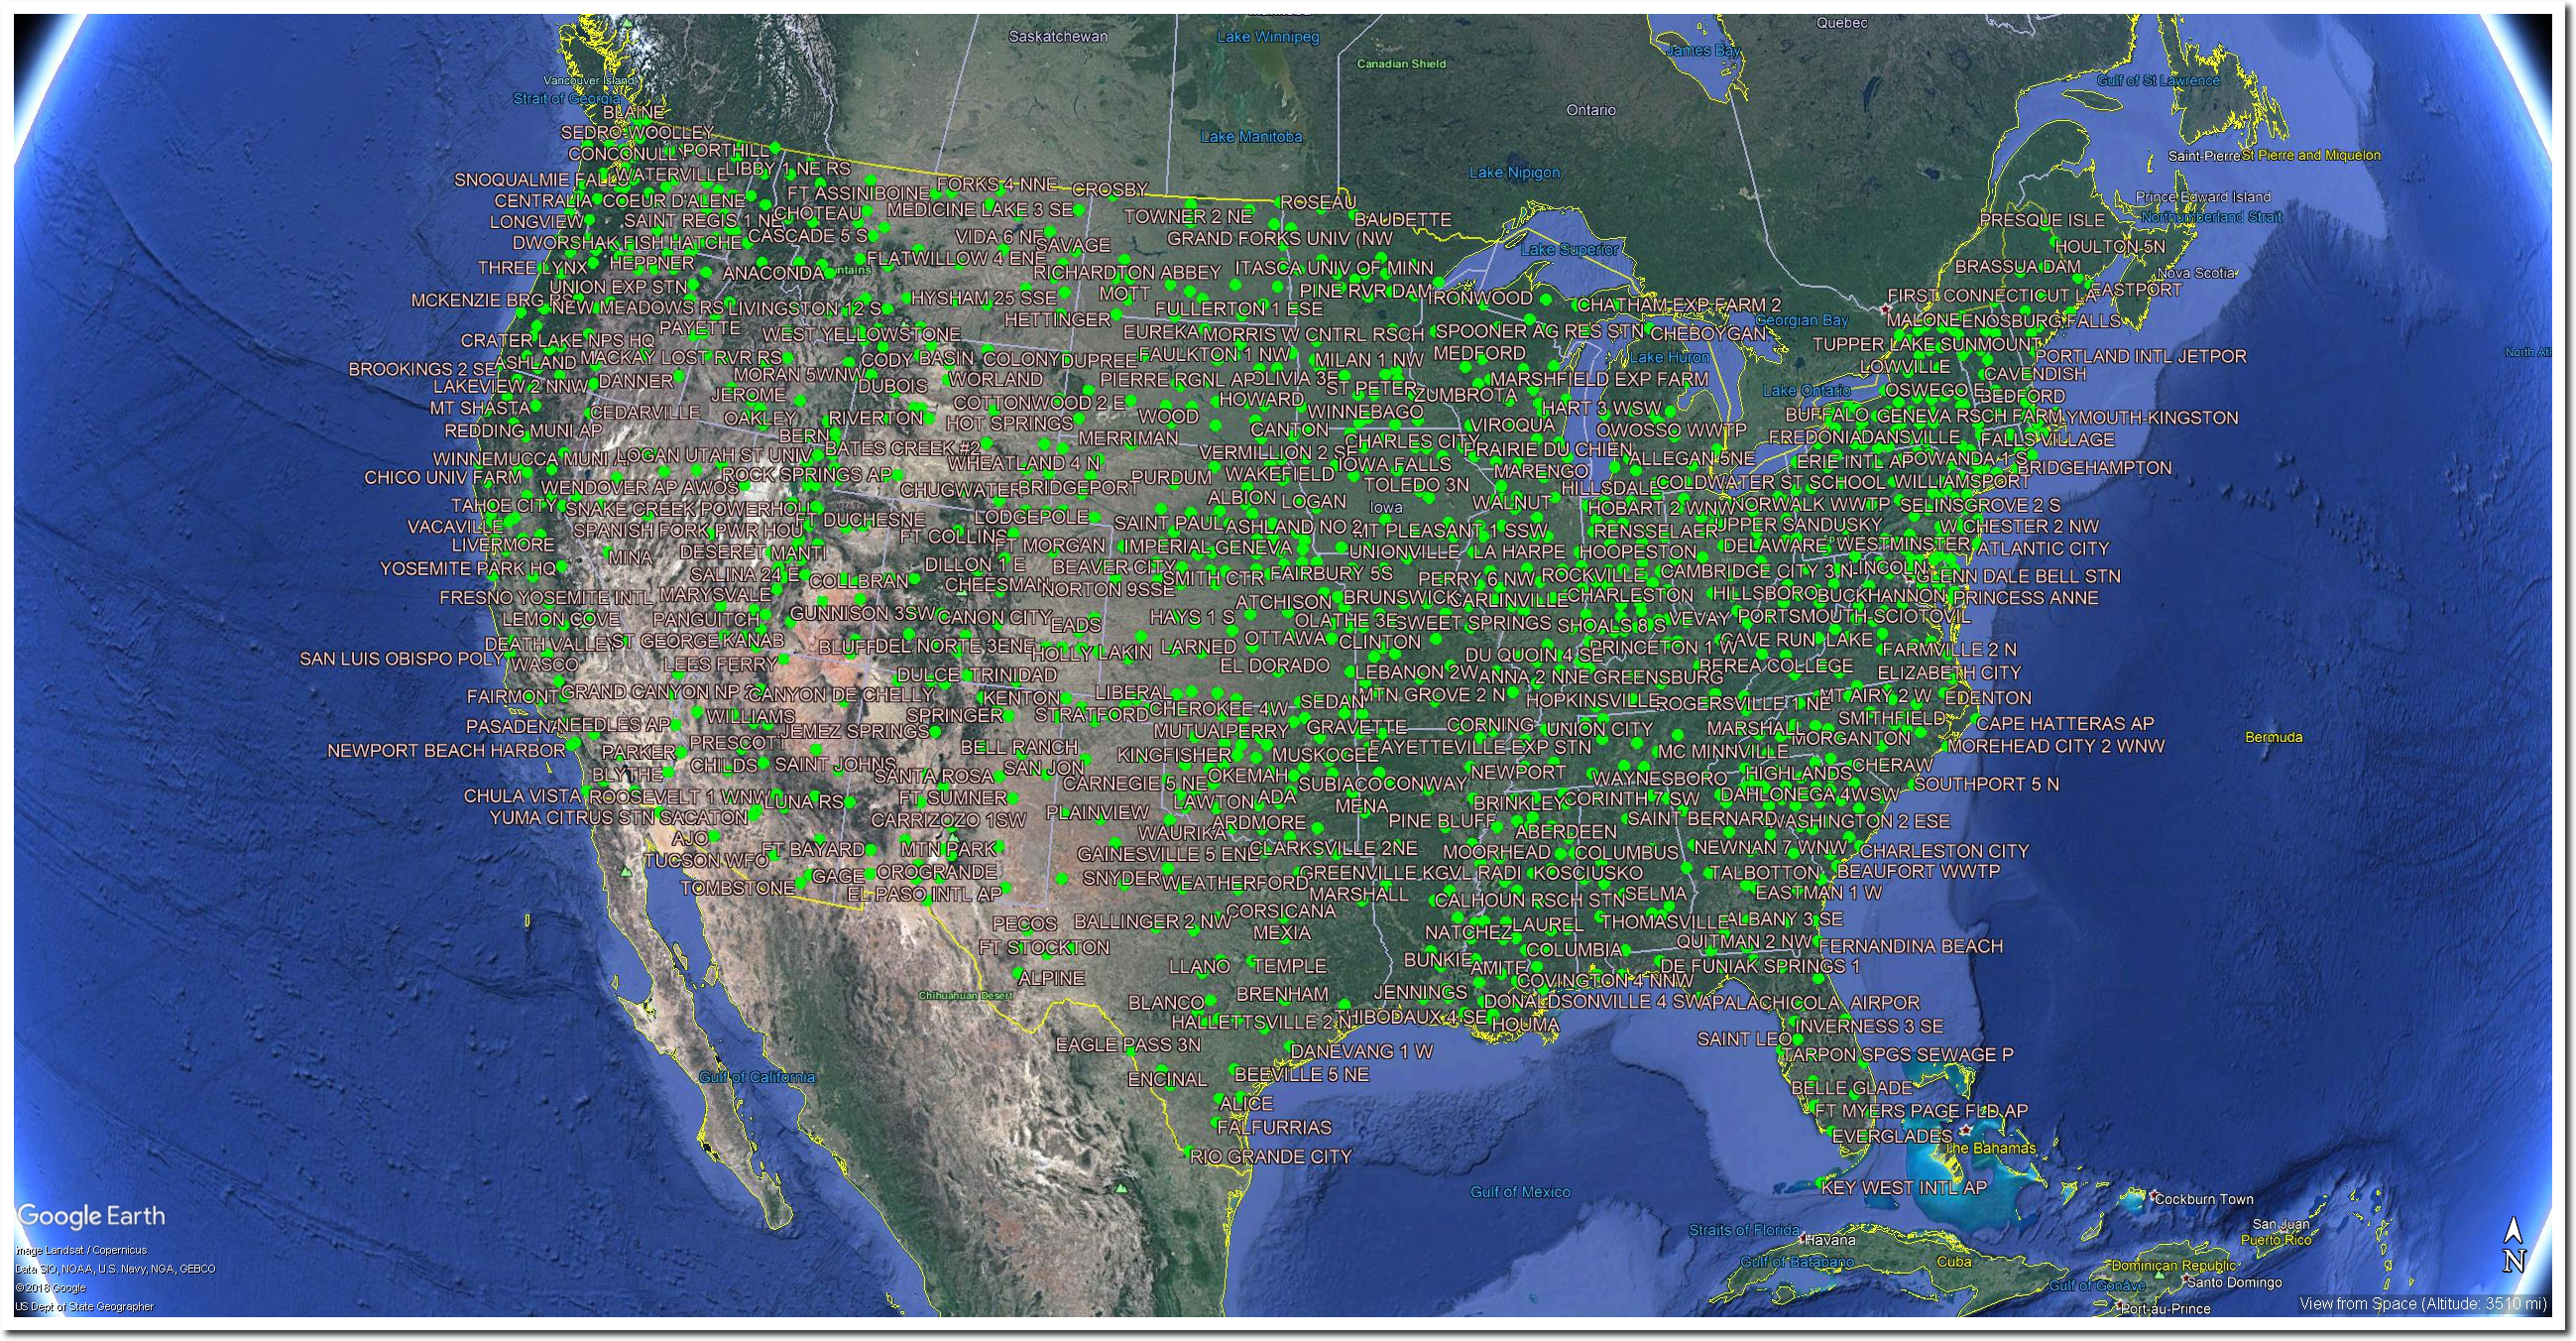
Climate alarmists can’t stand clean, unadjusted data – and the fact is that gridding obfuscates and contaminates data and hardly makes any difference to the trend.
The gods of the climate change superstition demand that greens destroy the environment.

Millions of trees chopped down to make way for Scottish wind farms – Telegraph
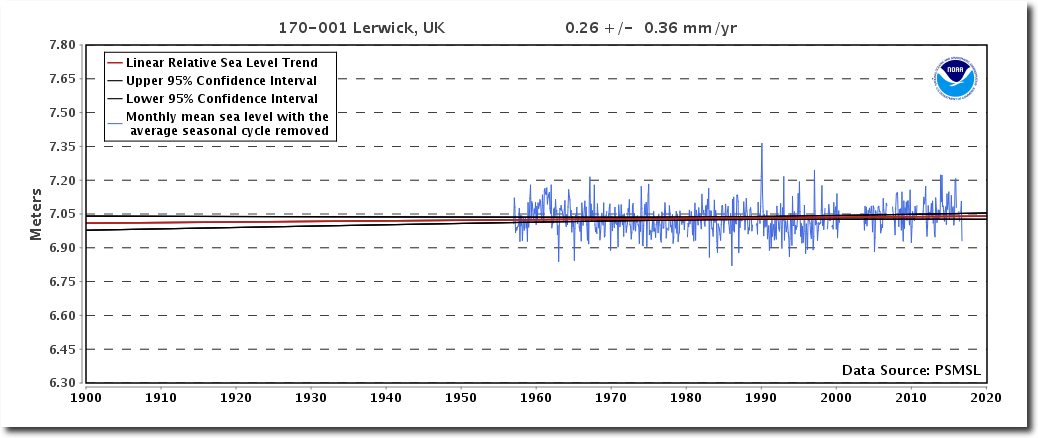
Scottish greens believe this is necessary to stop imaginary sea level rise.
From Skeptical Science:
Are surface temperature records reliable?
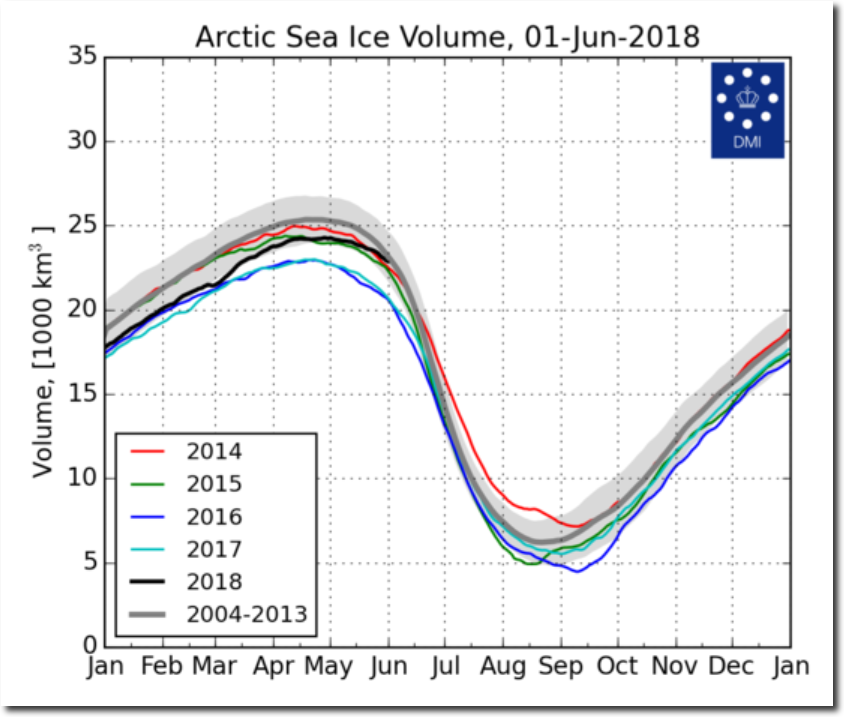
2. Arctic sea ice volume is normal and highest in five years.
FullSize_CICE_combine_thick_SM_EN_20180601.png (1337×1113)
3. In 1989, NOAA hadn’t yet realized there was money to be made via data tampering.
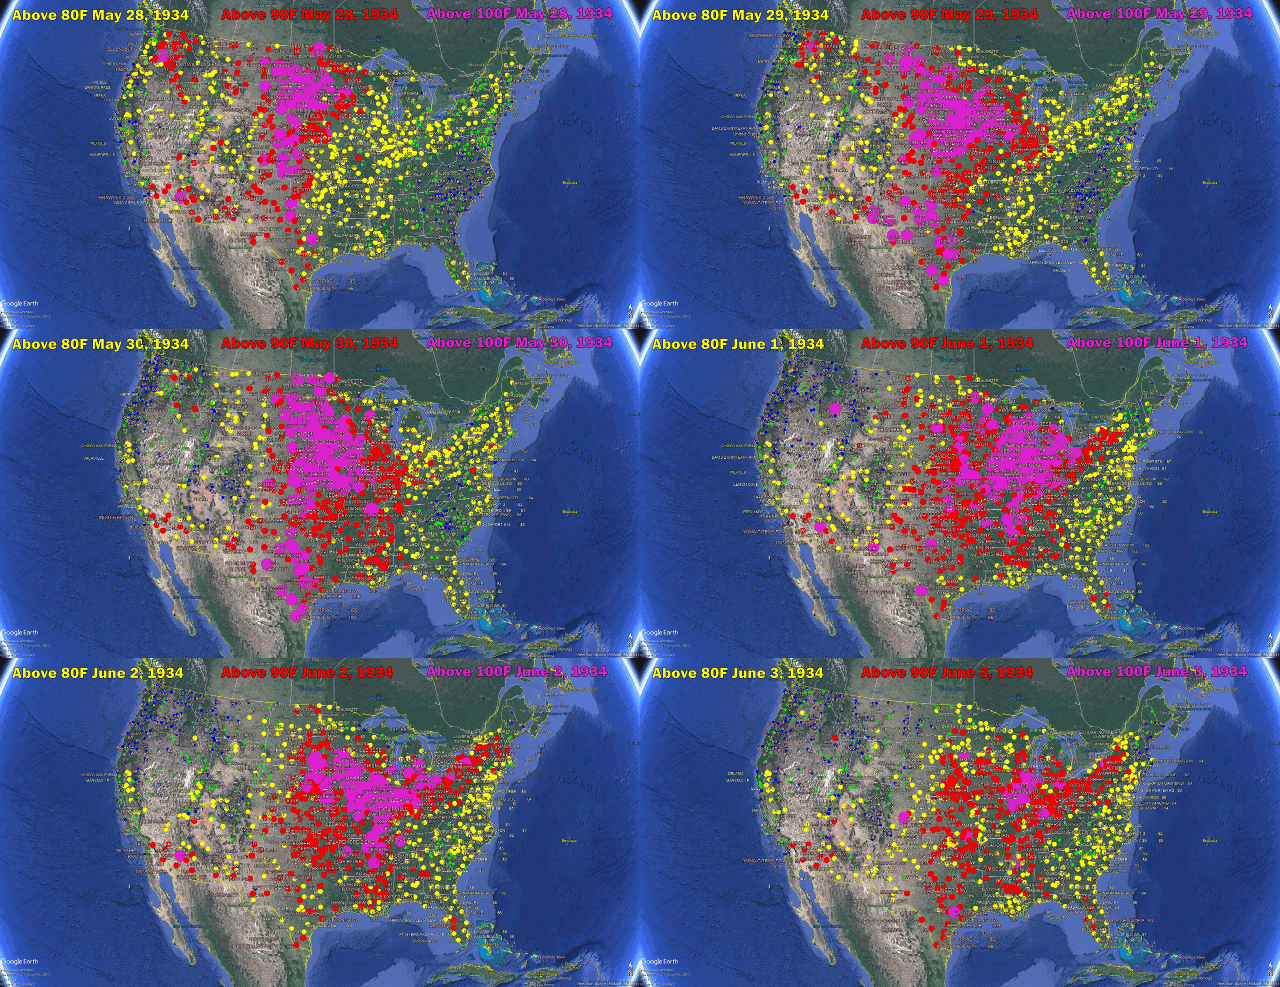
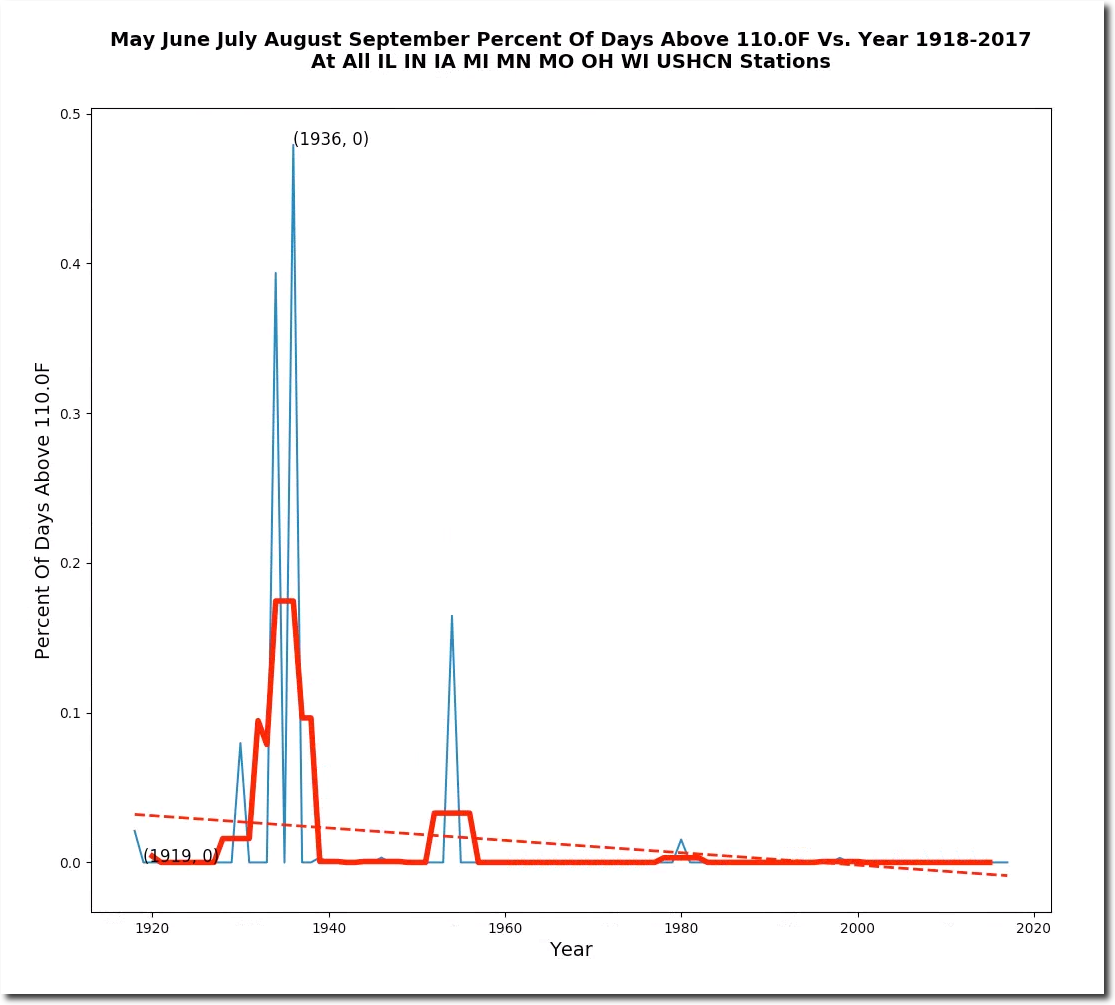
The Midwest hardly ever reaches 100 degrees anymore, but from May 28 to August 19, 1934 the Midwest recorded temperatures over 100 degrees on seventy-two of eighty-three days. Here is an animation of the May 28 to June 3, 1934 heatwave.
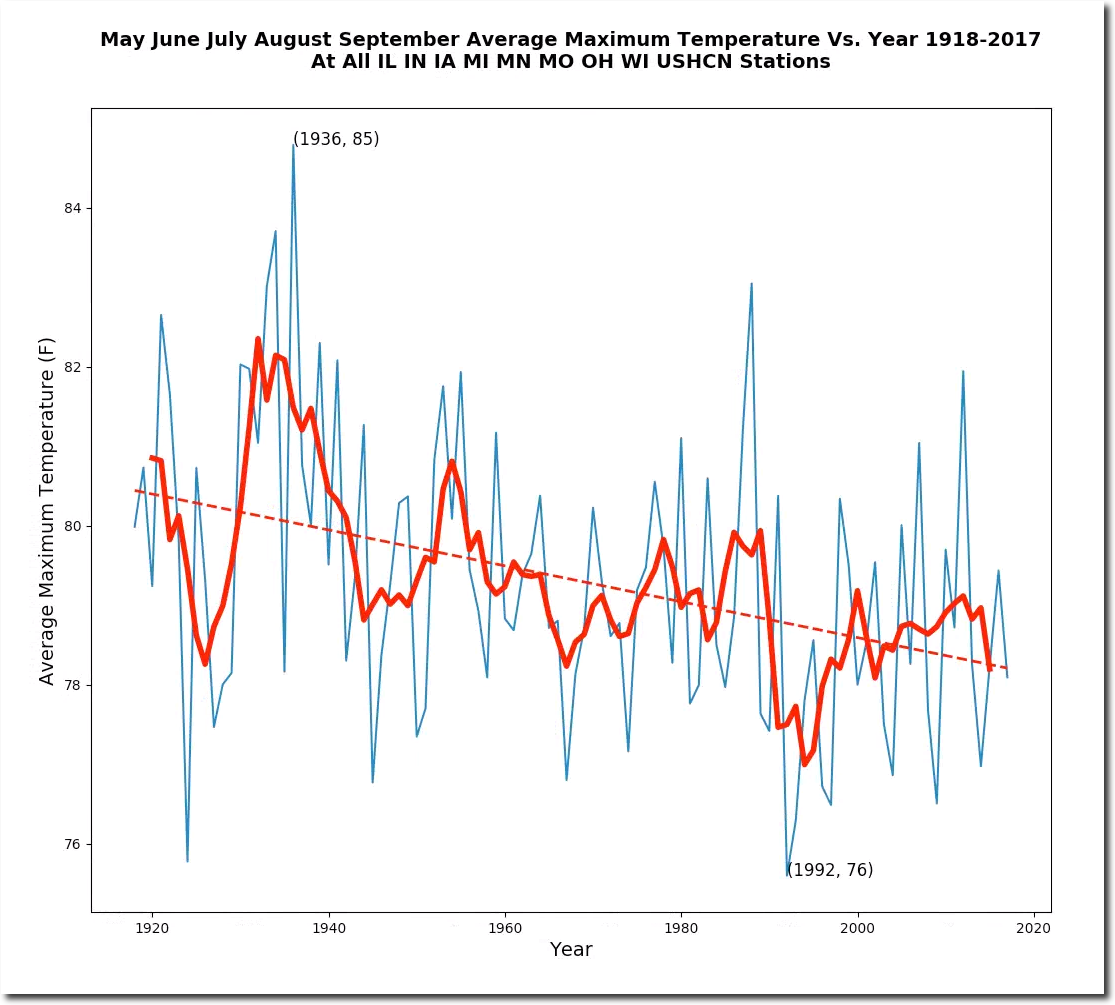
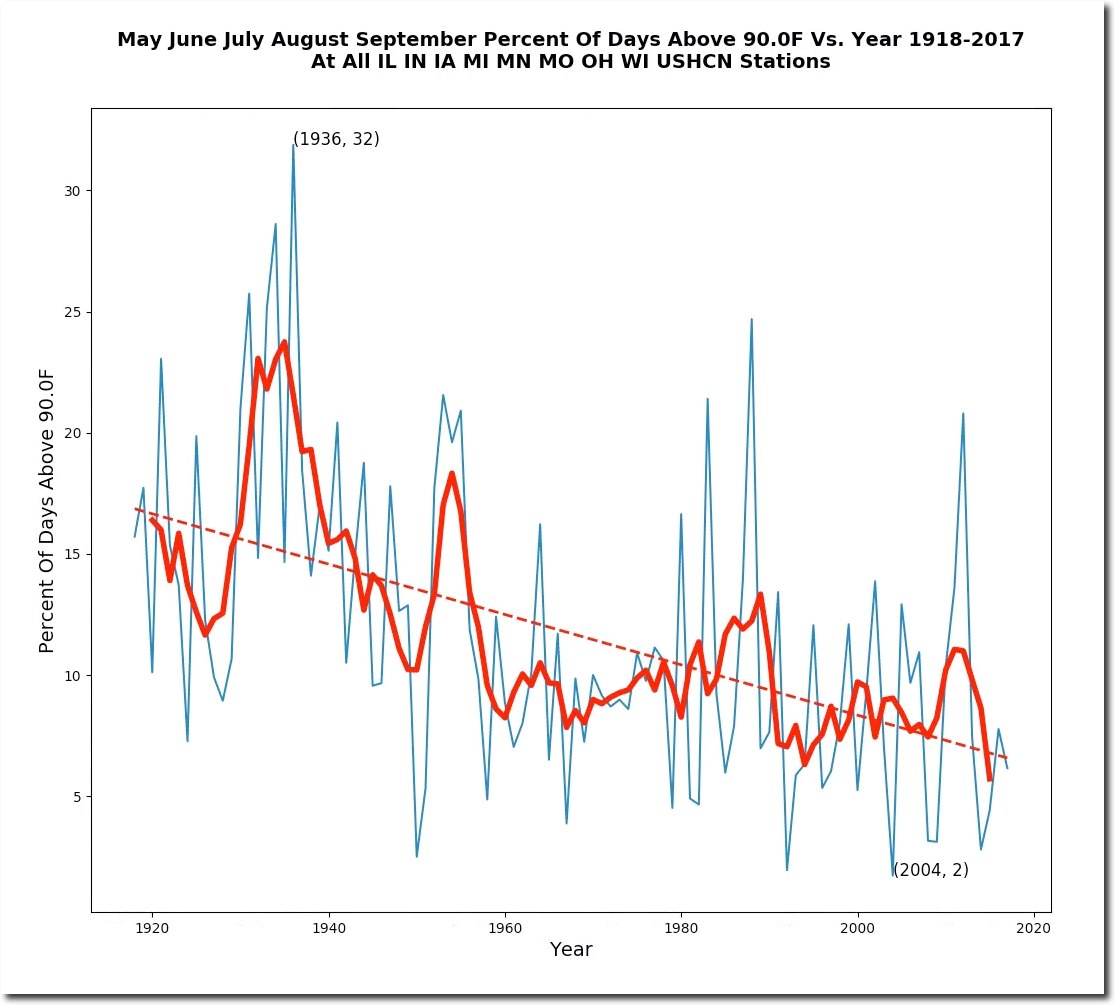

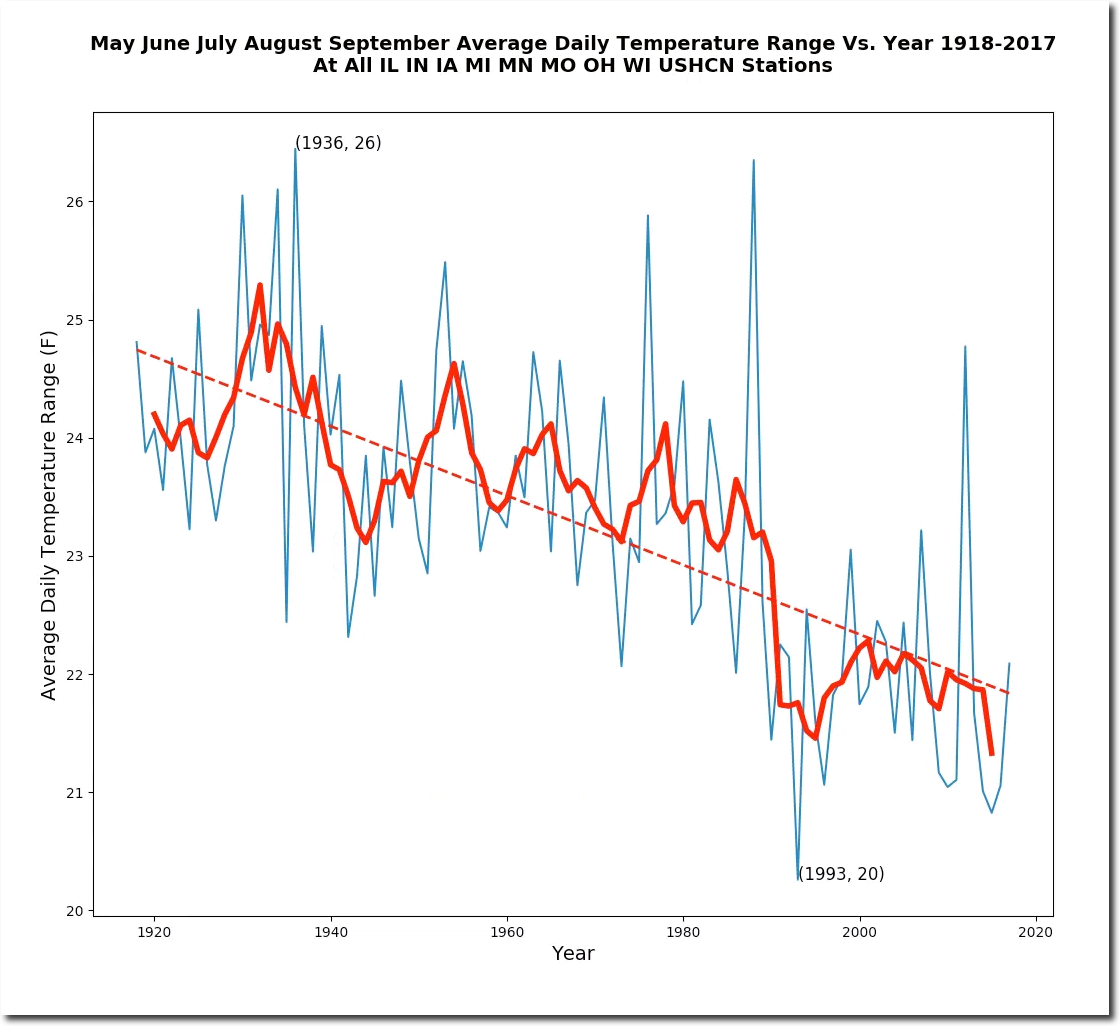
Midwest summer temperatures have become much less extreme over the past century. The average daily temperature range of temperature has dropped about three degrees.
Kenyan-born US Senate hopeful, Barrack Obama, appeared set to take over the Illinois Senate seat after his main rival, Jack Ryan, dropped out of the race on Friday night amid a furor over lurid sex club allegations.
From Kenya’s leading newspaper.

Kenyan-born Obama all set for US Senate
From Nigeria’s leading newspaper.

Nigerian Observer Online Edition
And then things got even worse ….
Does anyone believe this won’t eventually lead back to Barack Obama?

Born in Kenya and raised in Indonesia and Hawaii’

“Who controls the past controls the future. Who controls the present controls the past.”
? George Orwell, 1984
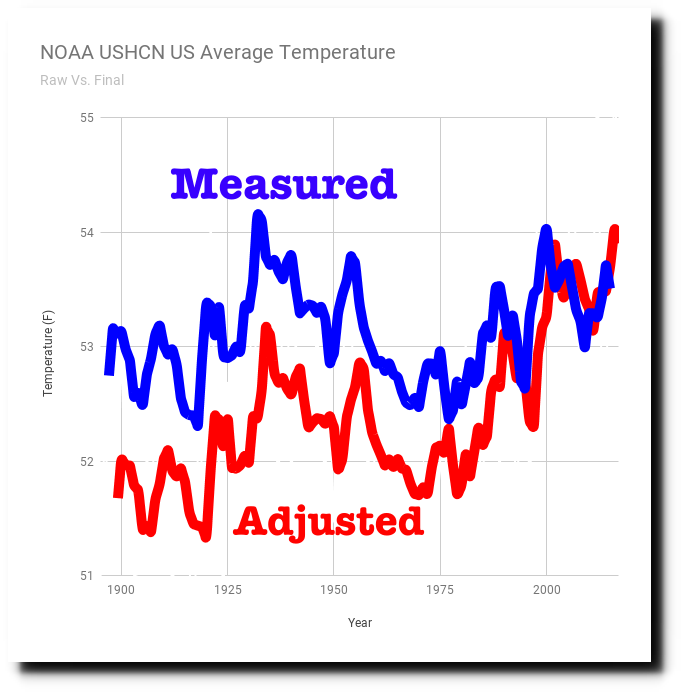
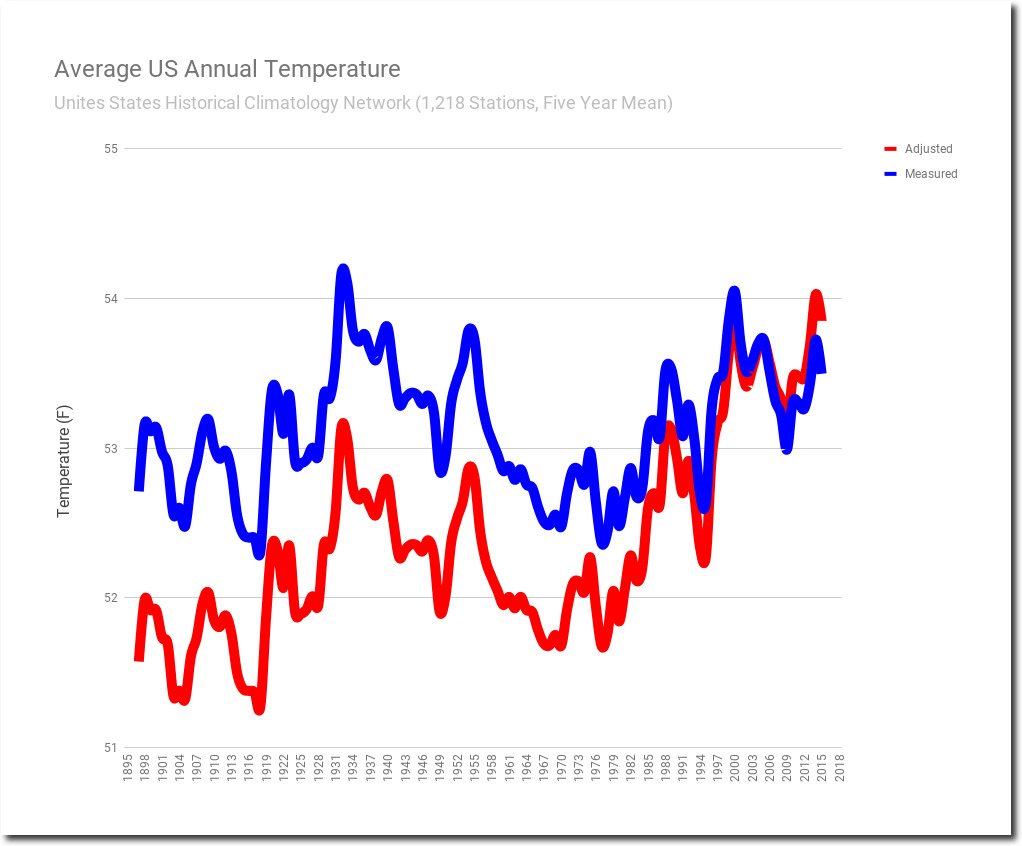
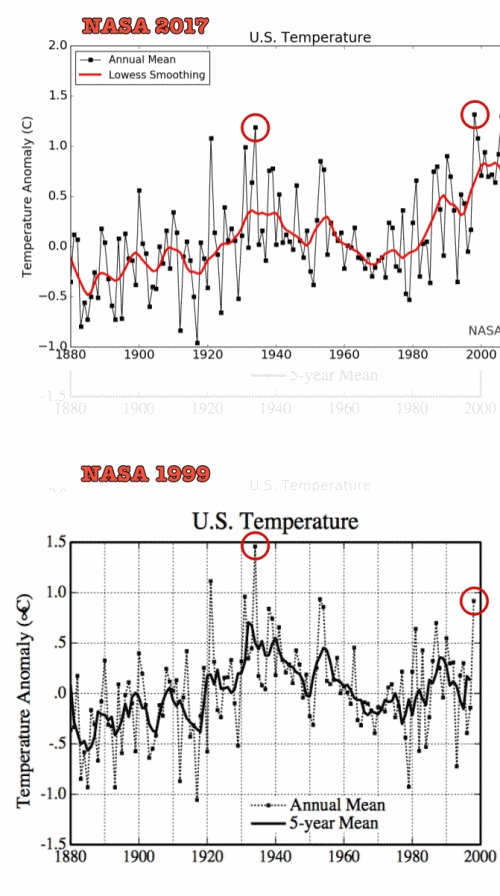
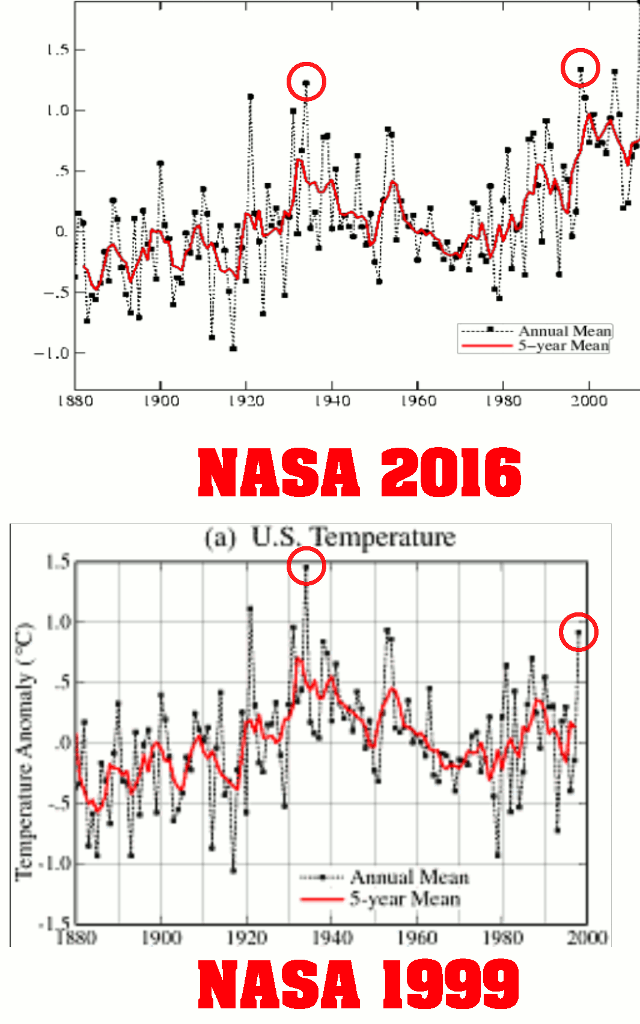
I frequently post these graphs showing how NOAA and NASA have erased America’s hot past, and particularly how they made the incredibly hot year of 1934 disappear.
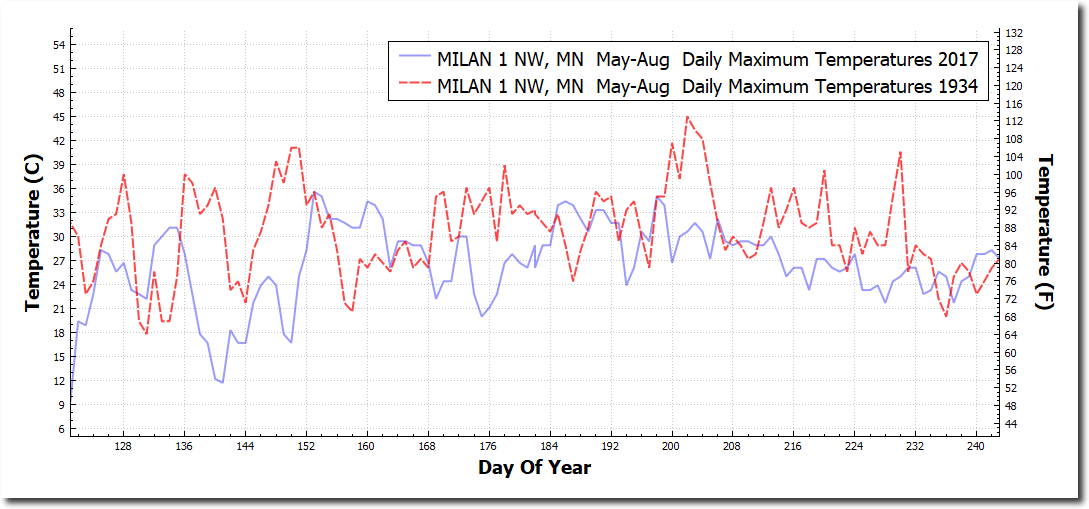
Let’s look at what they are erasing. The summer of 1934 had ten massive heat waves east of the Rockies. Minnesota had a record cold spring this year, but in 1934 Minnesota was an extremely hot place – with many days over 100 degrees. Milan, Minnesota reached 113 degrees in 1934, compared to a maximum of 96 degrees last year.
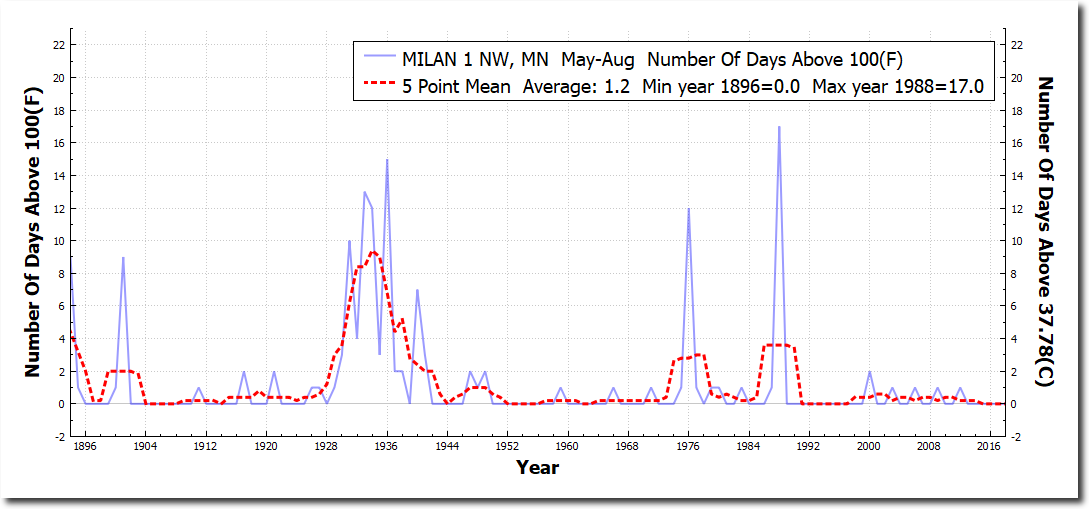
Minnesota had many hot summers when CO2 was below 350 PPM, but none since CO2 reached James Hansen’s deadly threshold. The last hot summer in Minnesota was 1988, when Hansen warned Congress that the Midwest was going to burn up and dry up.
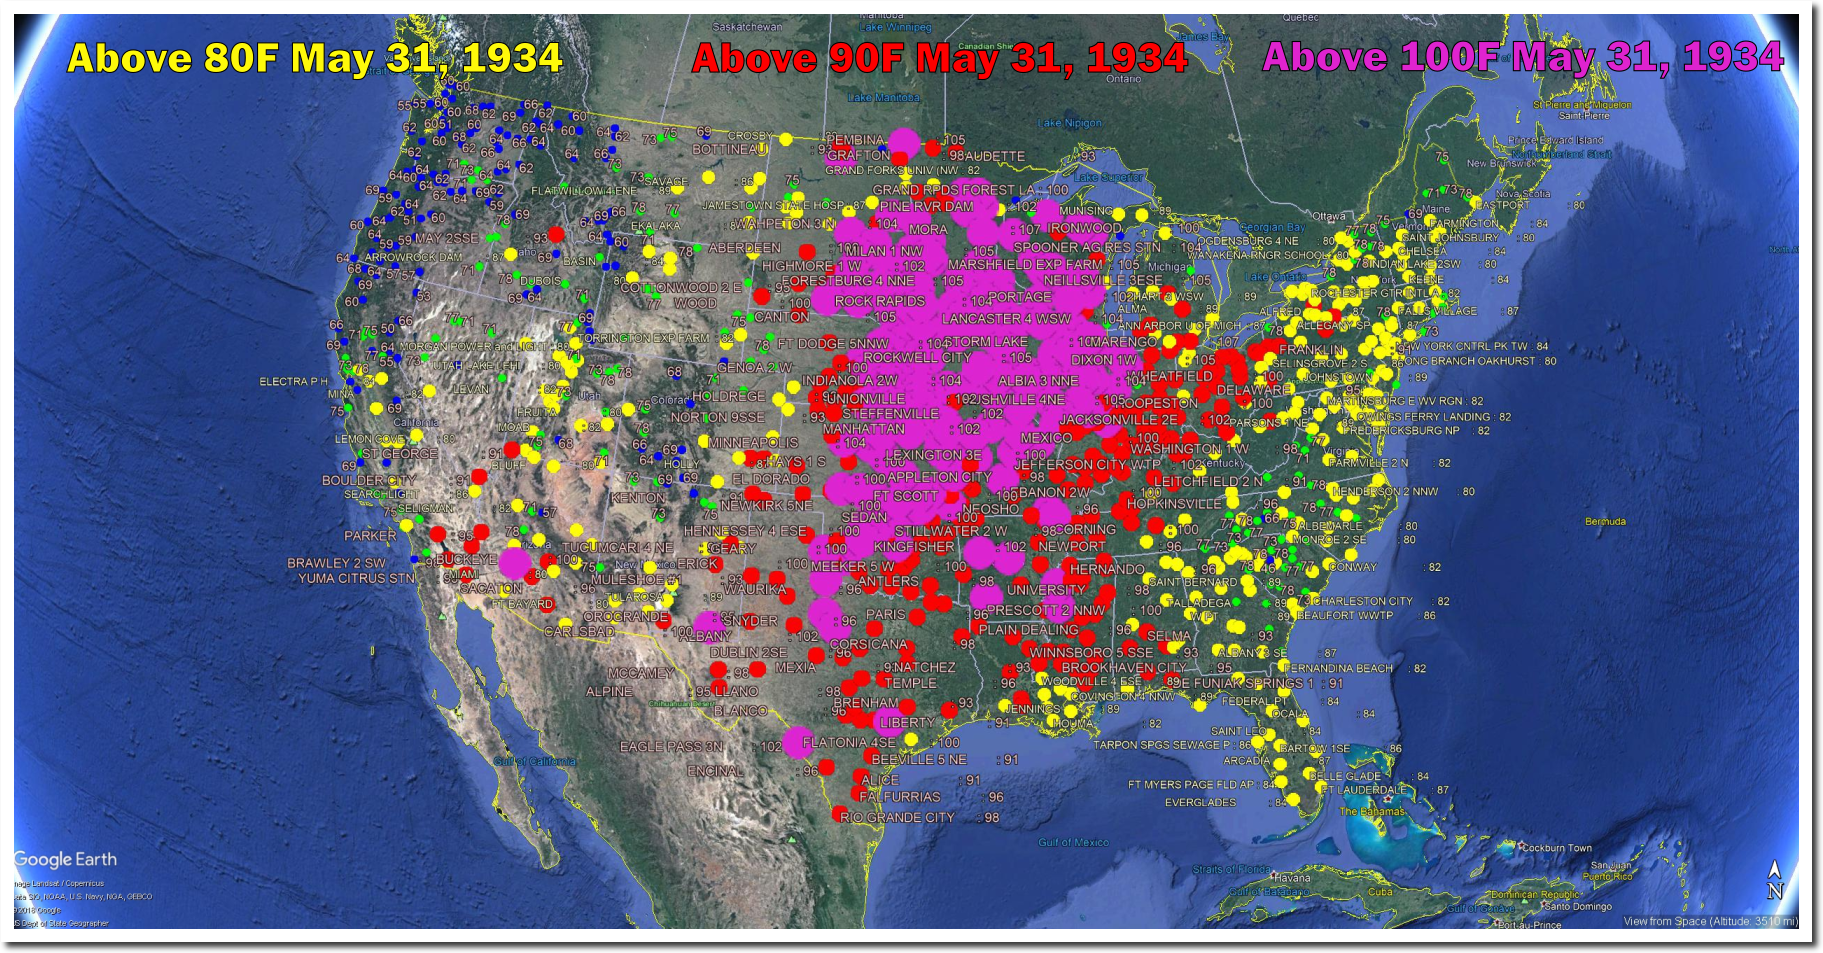
Here are some of the heatwaves of 1934 which Hansen et al erased via data tampering.

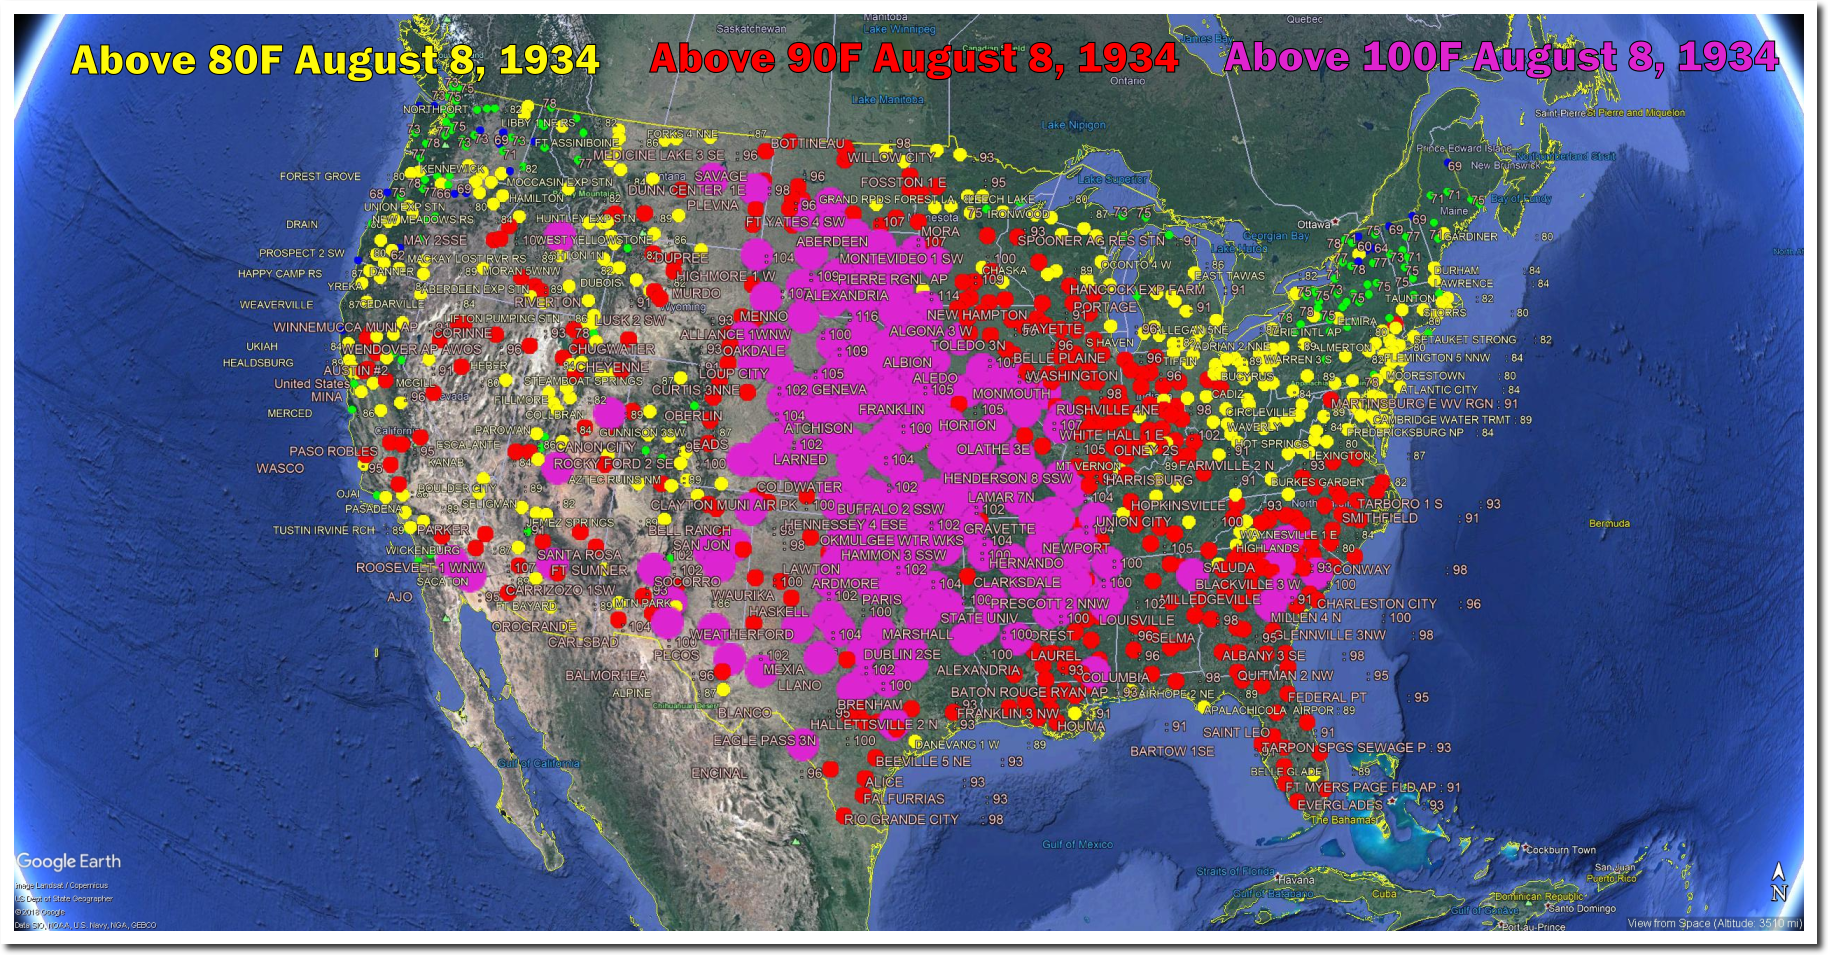
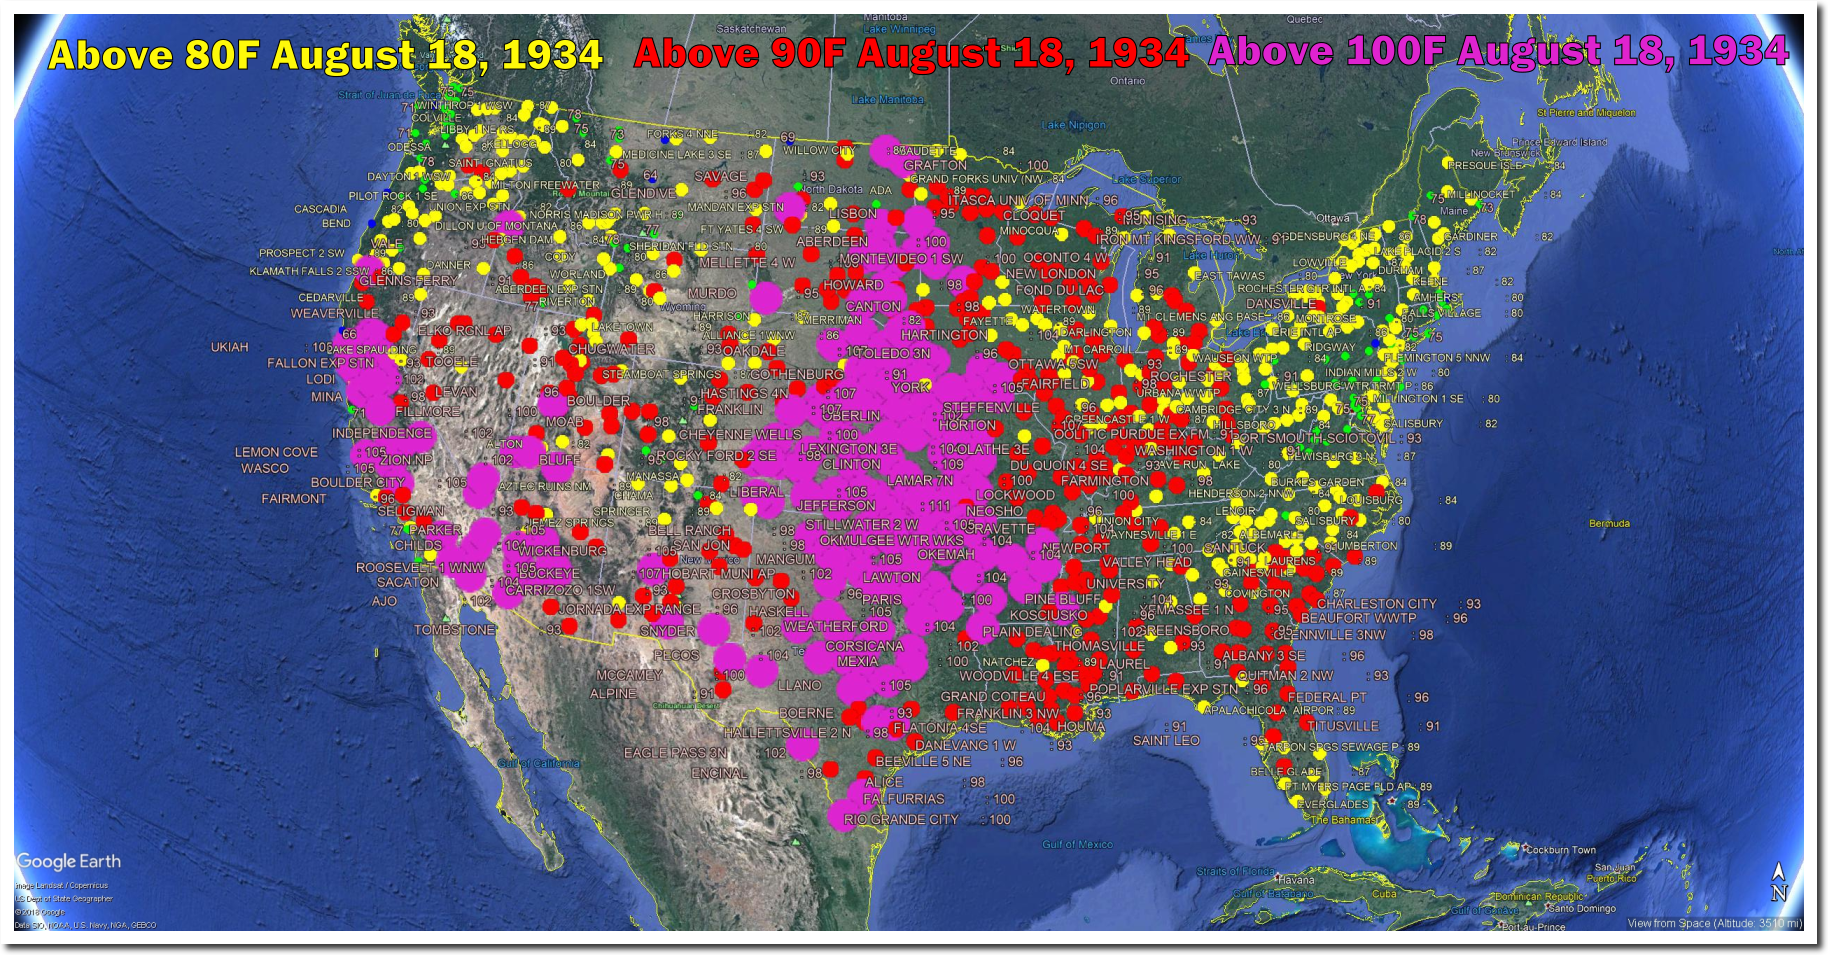
But what NASA and NOAA are really erasing is their failed predictions. Thirty years ago this month, NASA’s James Hansen warned Congress of increased heatwaves and droughts in the Midwest. He had it exactly backwards.
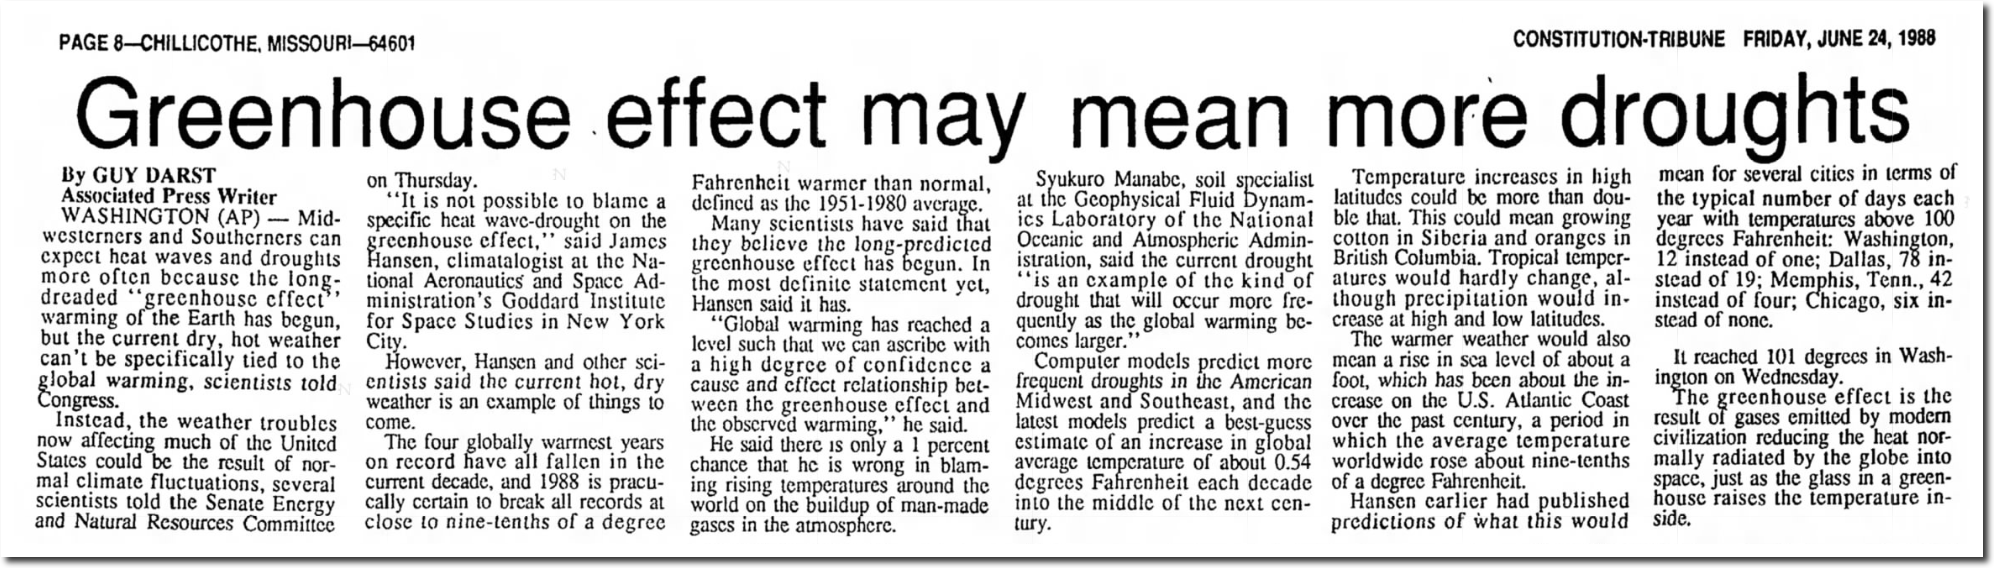
24 Jun 1988, Page 8 – The Chillicothe Constitution-Tribune at Newspapers.com
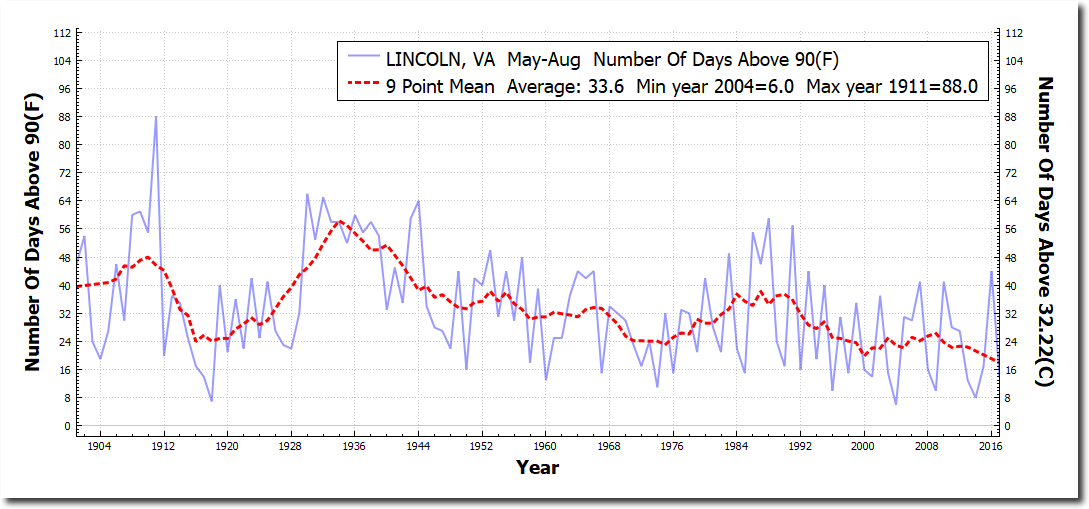
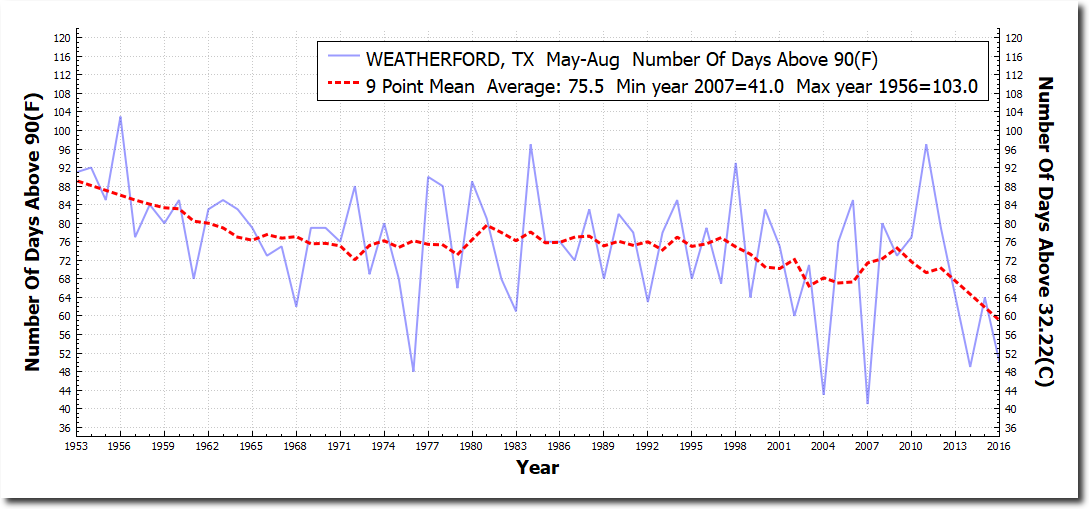
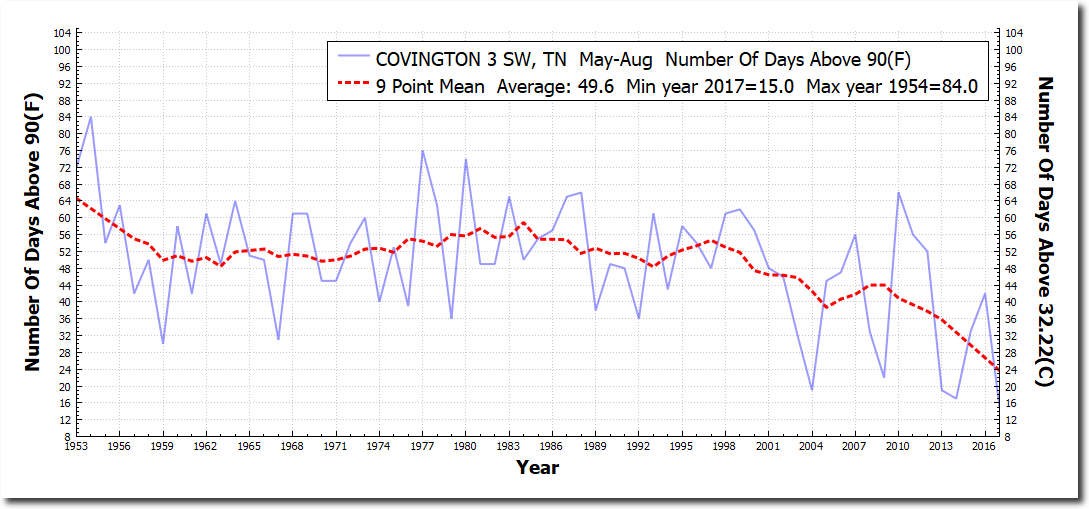
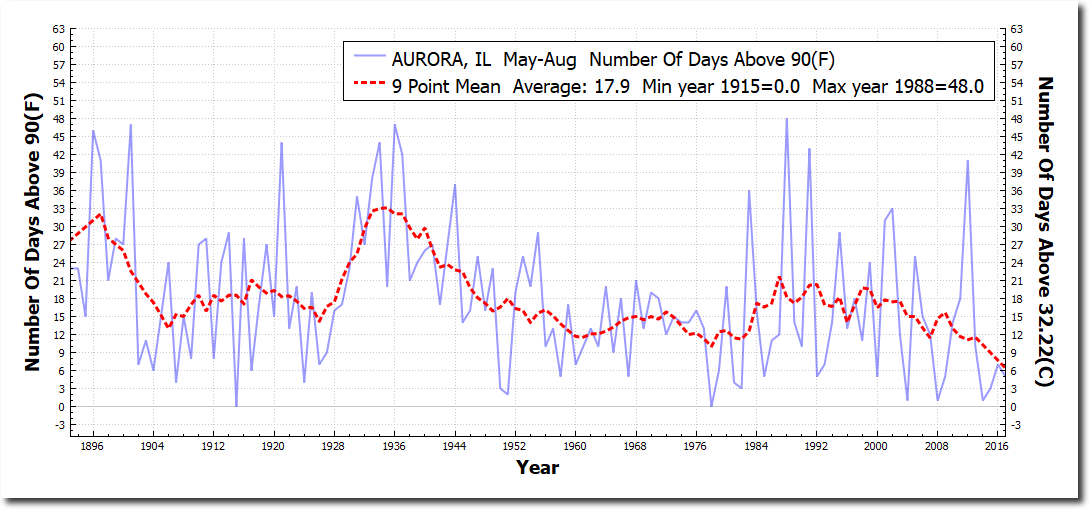
Hansen made specific predictions about the number of 100 degree days skyrocketing in several cities around the US, and growing cotton in Siberia.
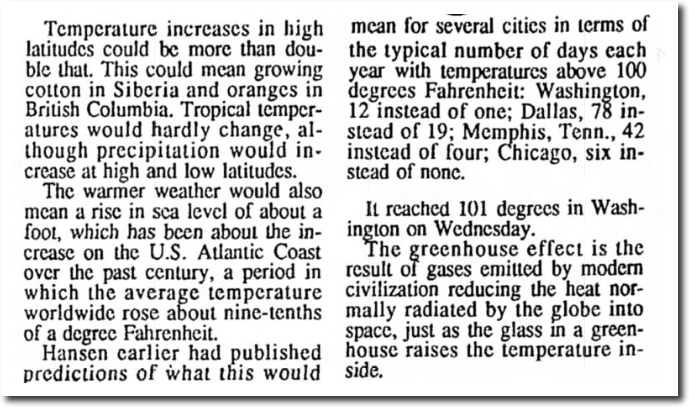
Every one of his predictions was backwards. The frequency 90 and 100 degree days has plummeted in the US.
Closest Virginia USHCN station to Washington DC
Closest USHCN station to Dallas.
Closest USHCN station to Memphis.
Closest USHCN station to Chicago.
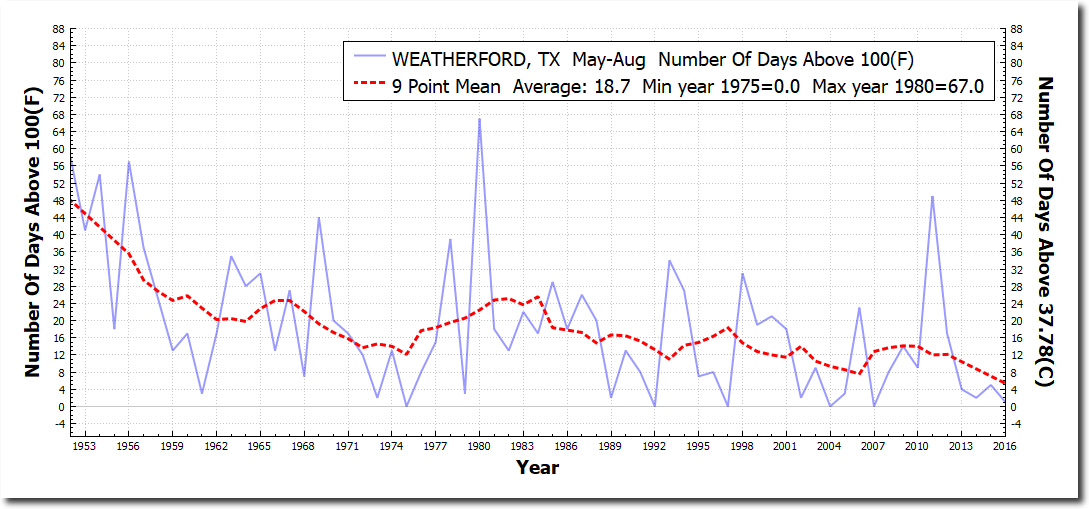
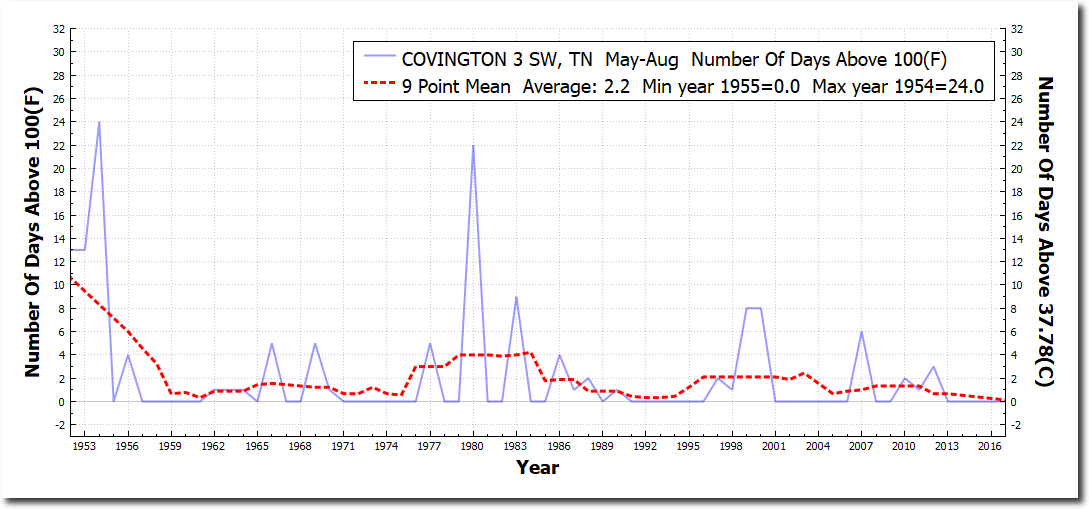
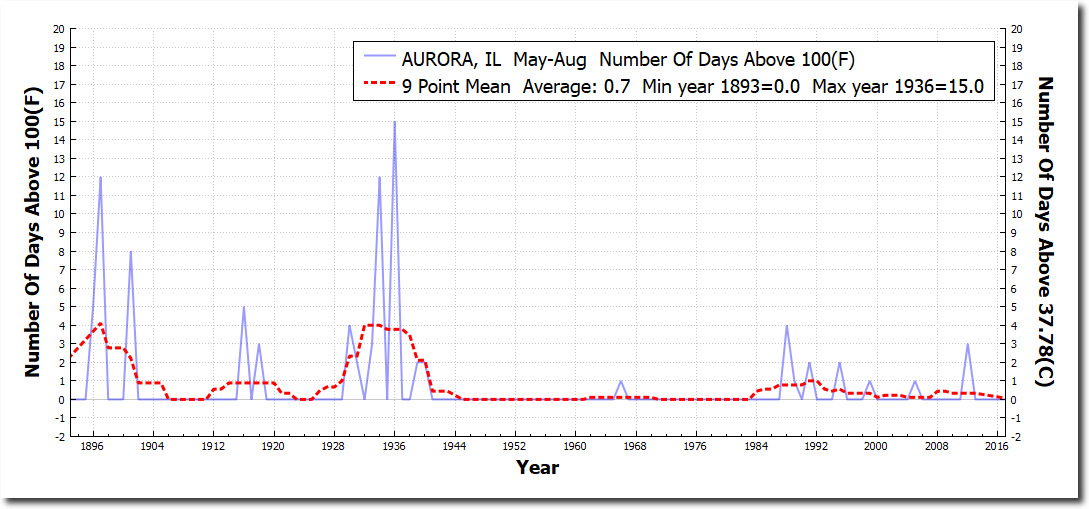

All of Hansen’s temperature forecasts were wrong, as were his drought forecasts. Both the US and the Midwest have gotten much wetter over the past century, exact opposite of Hansen’s forecasts.
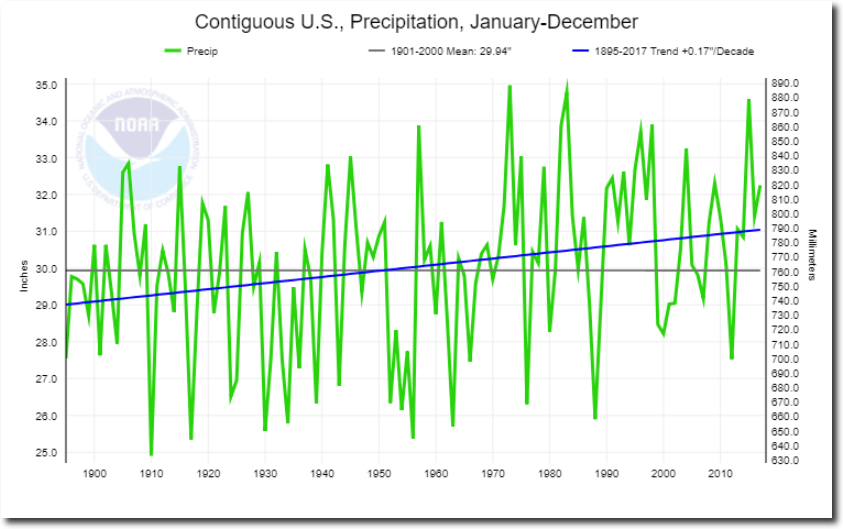
Climate at a Glance | National Centers for Environmental Information (NCEI)
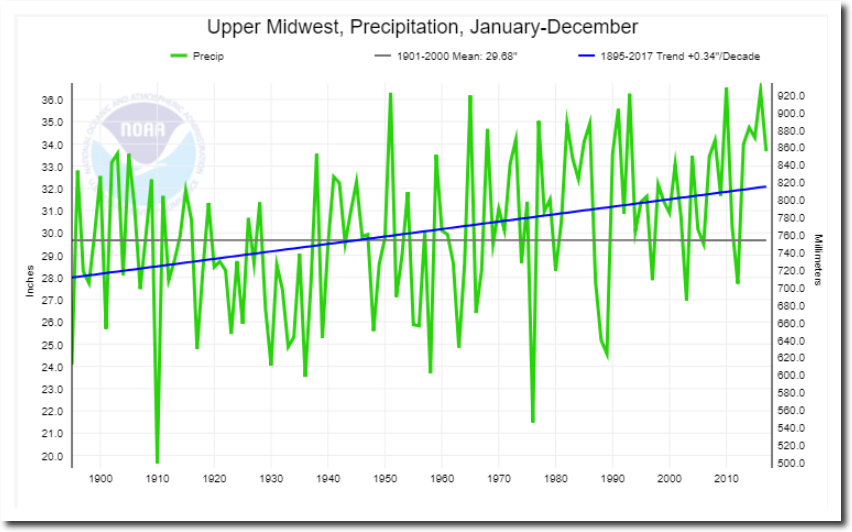
Climate at a Glance | National Centers for Environmental Information (NCEI)
And what about the predictions of growing cotton in Siberia? Scientists got this idiocy from Arrhenius over 100 years ago.
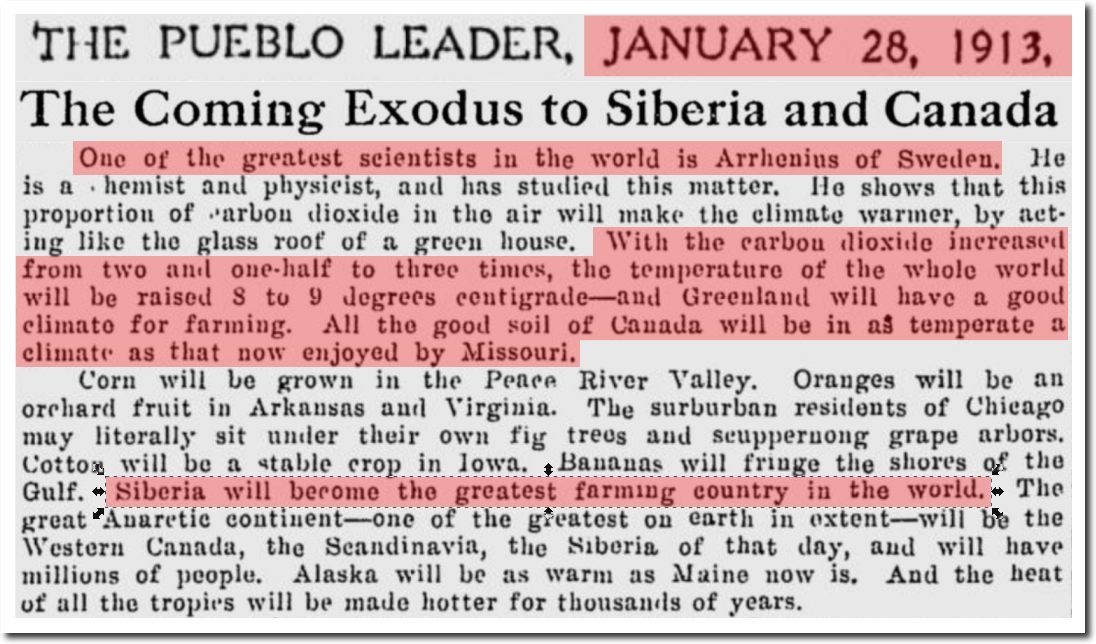
The Pueblo Leader – Google News Archive Search
Siberia broke the Northern Hemisphere record for cold this year. Cotton doesn’t grow at -62C.
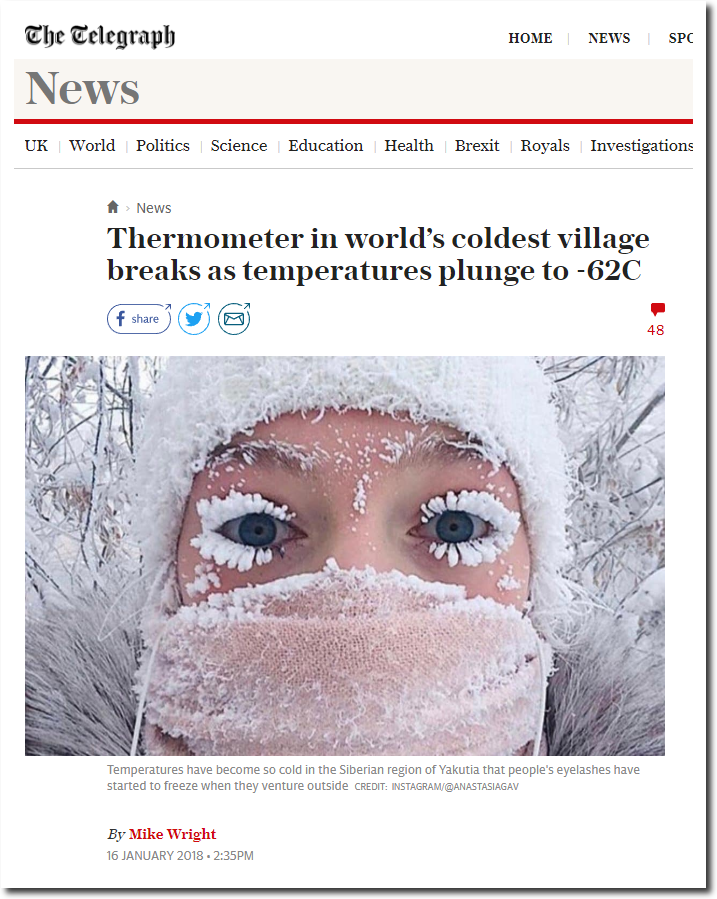
Thermometer in world’s coldest village breaks as temperatures plunge to -62C
Hansen “echoing the work of other scientists” predicted the Arctic would be ice-free no later than 2018. Democrats declared him a prophet over that prediction.
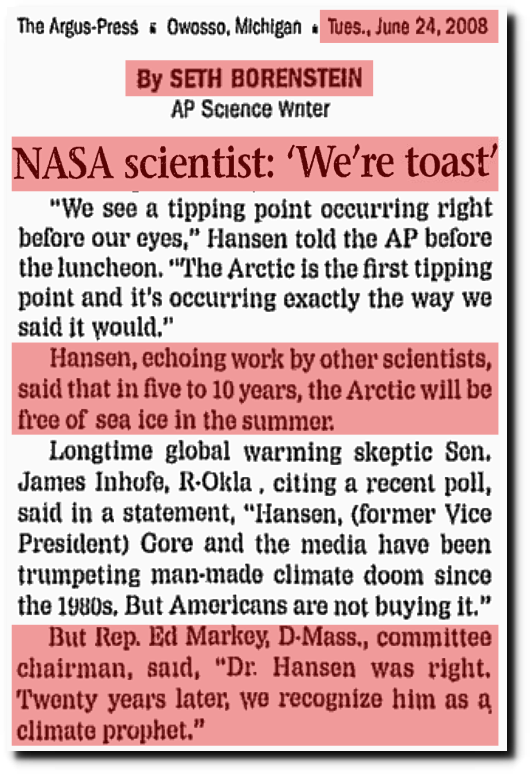
The Argus-Press – Google News Archive Search
Instead, we are seeing the highest volume of sea ice in several years, very slow melt, and ice volume almost reaching the “normal line.”
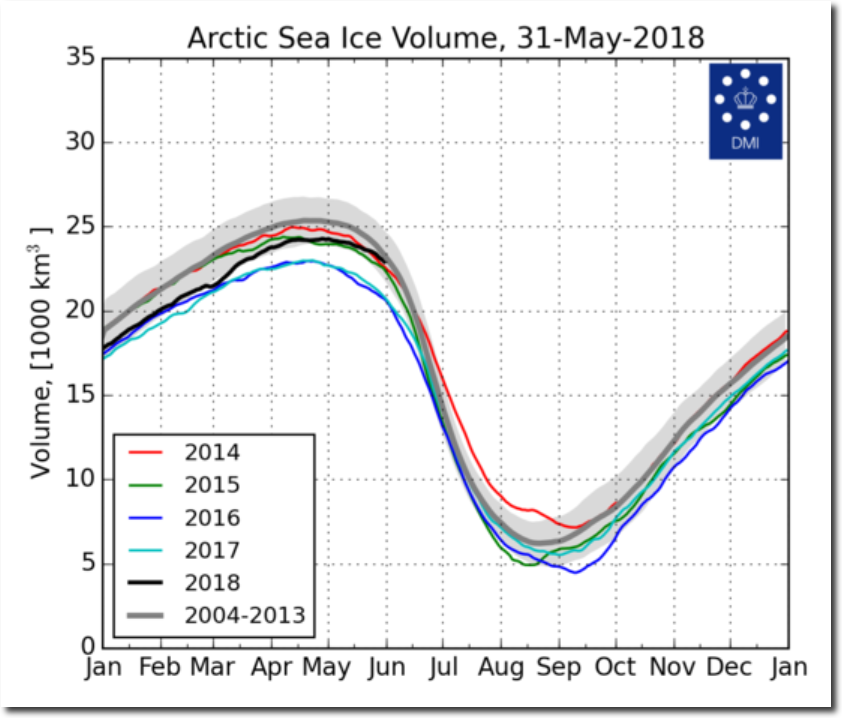
FullSize_CICE_combine_thick_SM_EN_20180531.png (1337×1113)
Climate scientists have been pushing junk global warming theory on and off for over a century. But the real hysteria started with James Hansen in June, 1988. As his predictions failed, he began to tamper with the data to cover his tracks, and now all that climate science is left with is failed models, fraud and data tampering. It is a criminal venture in collapse.
The press is quite predictably parroting their usual lies and hysteria about the Ellicott City, MD flooding, where they received 3-6 inches of rain in two hours. Press geniuses are calling six inches inches of rain a 1-in-1000-year rain event.

I used to ride my bike to the Ellicott City Assembly of God church, where my friend Karen sang.

Racist Taunts In The Classroom | Real Science
Downtown Ellicott City is located in the bottom of an intermittent river channel, with lots of asphalt perched overhead. When it rains, all the drainage off the parking lots comes directly downtown.
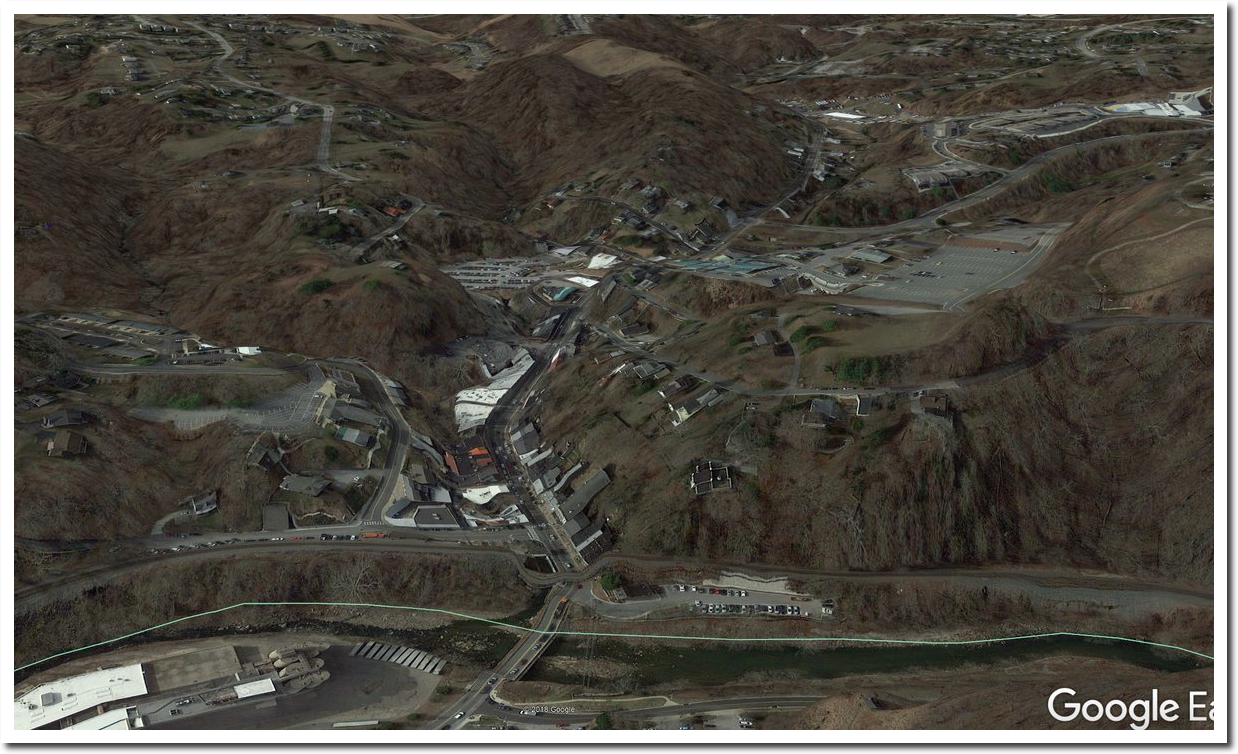
Even before the parking lots were built, Ellicott City had massive floods – their worst one occurring 150 years ago, with a “40 foot wall of water.” According to USA Today, that was more than 1,000 years ago.
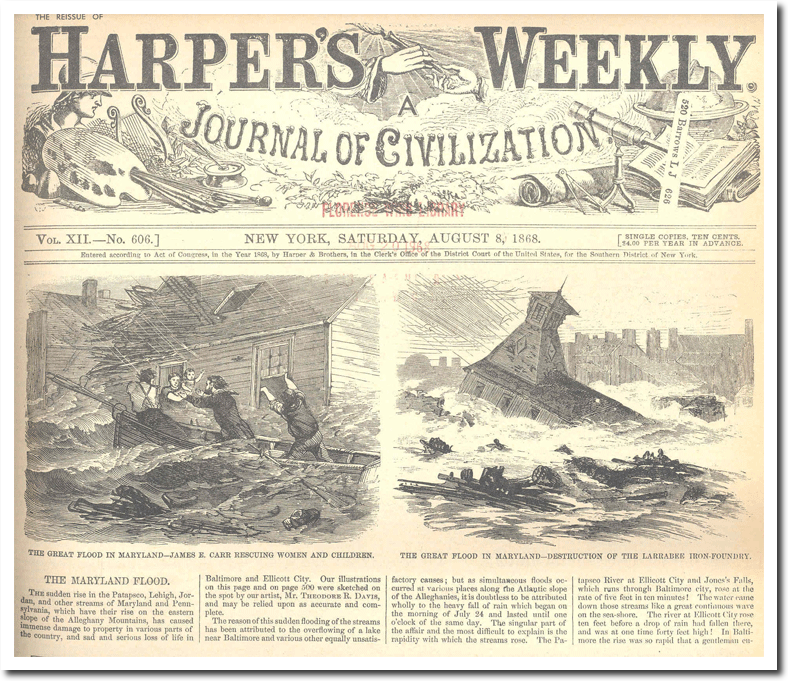
Historic Ellicott City, MD – Floods – Saturday, August 8, 1868
The Washington Post calls Ellicott City “a town of many, many floods” which the city has marked.

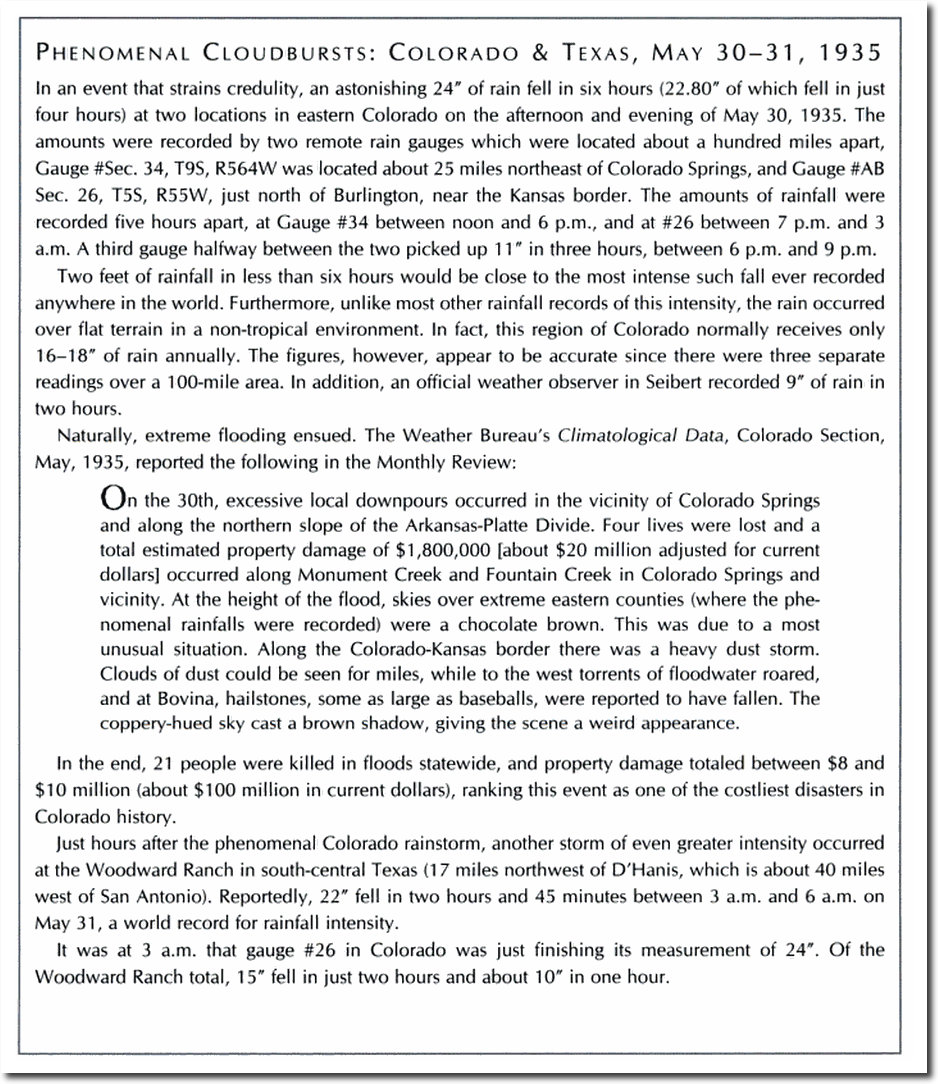
It is remarkable that anyone would would be stupid or dishonest enough to claim 3-6 inches of rain in two hours is a record. Maryland holds the US record of 1.23 inches of rain in one minute. On Memorial Day weekend 1935, Woodward Ranch, Texas received a world record fifteen inches of rain in two hours. And in 1942, Smethport, PA received a world record 28.5 inches of rain in three hours.
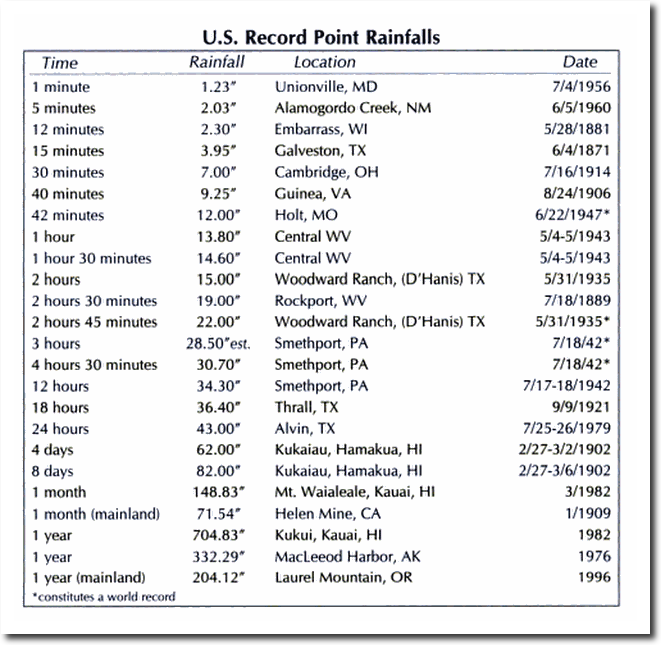
Extreme Weather: A Guide & Record Book – Christopher C. Burt – Google Books
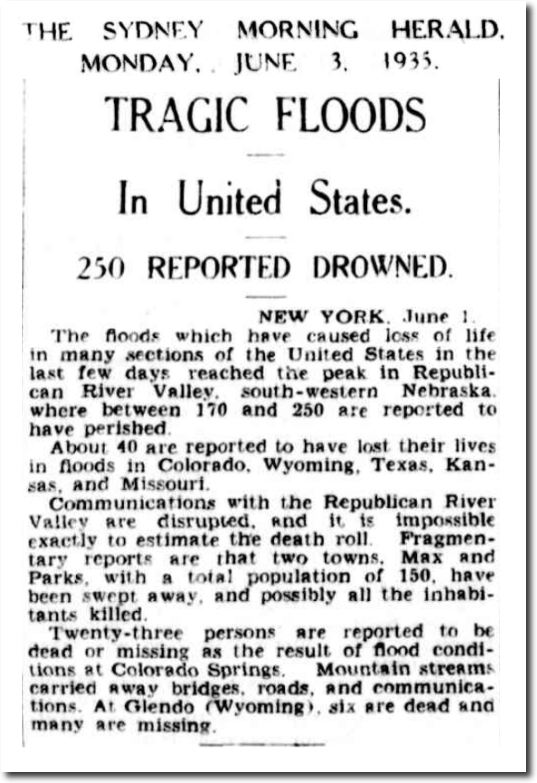
On this date in 1935, two locations in Colorado received 24 inches of rain in six hours, killing hundreds of people.
Extreme Weather: A Guide & Record Book – Christopher C. Burt – Google Books
03 Jun 1935 – TRAGIC FLOODS – Trove
Climate alarmism depends on lies, fake statistics and a misunderstanding of science and history. Downtown Ellicott City is a disaster waiting to happen every time it rains.
The likelihood of hot weather on May 31 has plummeted in the US over the past century.
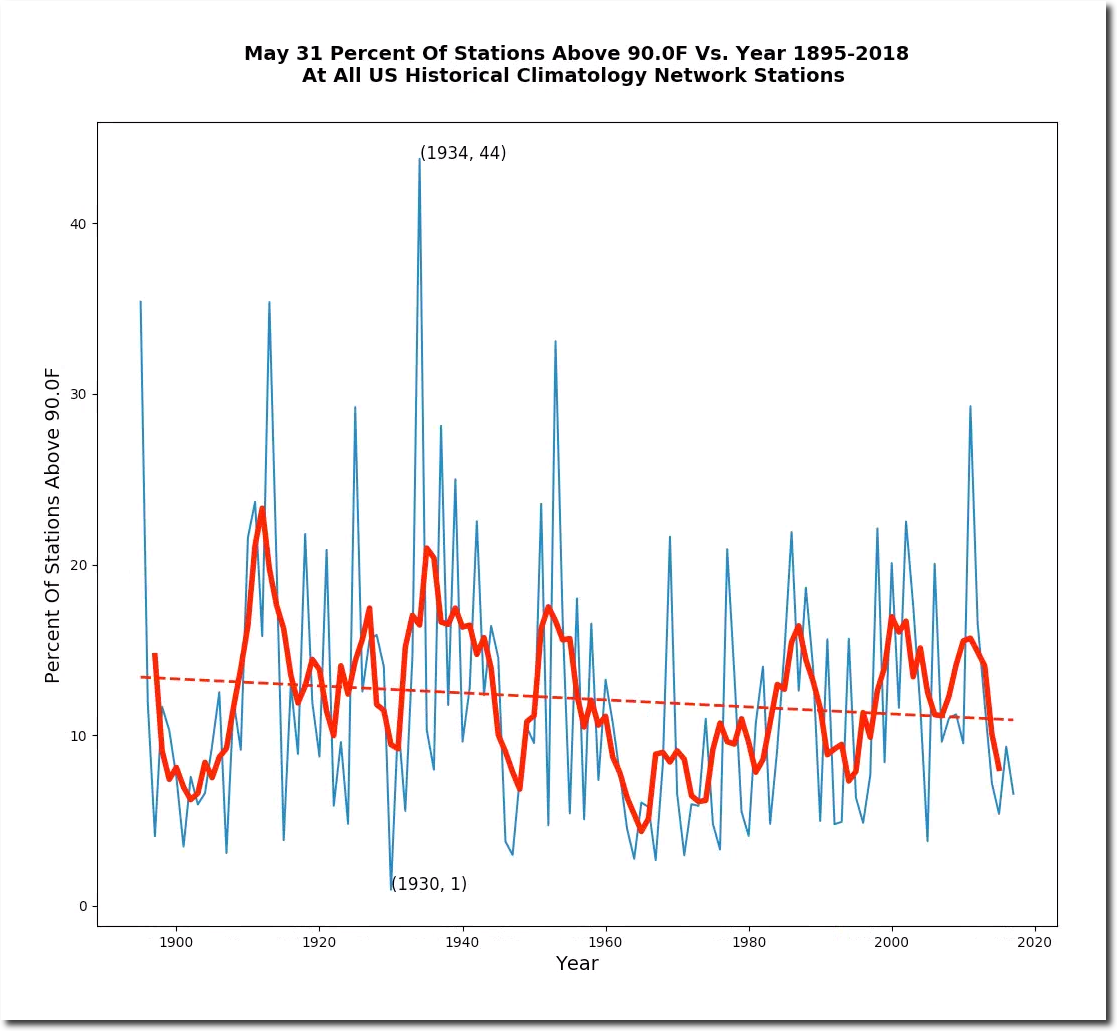
On the last day of May, 1934 100 degree temperatures covered the Great Plains and Midwest. Fayette, Iowa was 109 degrees. Temperatures that hot in Iowa are inconceivable now in July, much less in May.
1934 was the warmest year on record in the US, and NOAA compensates for the heat by simply erasing it.